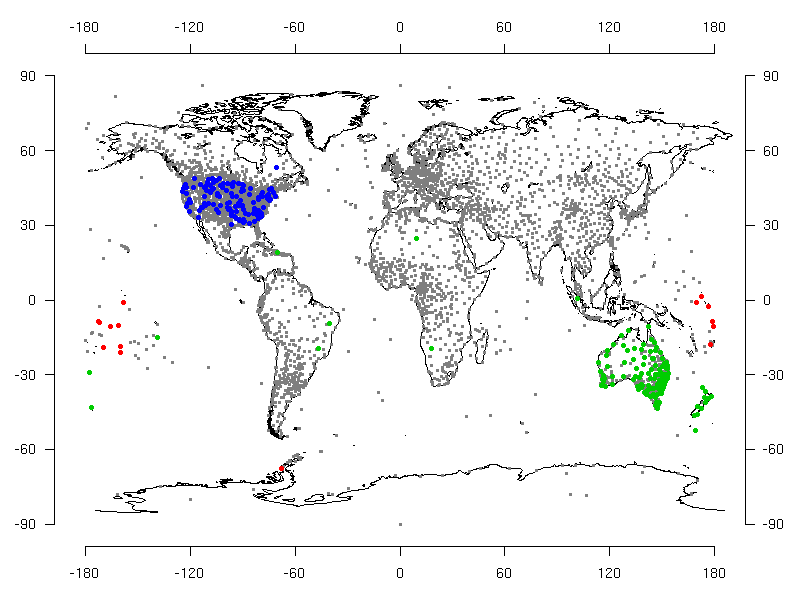
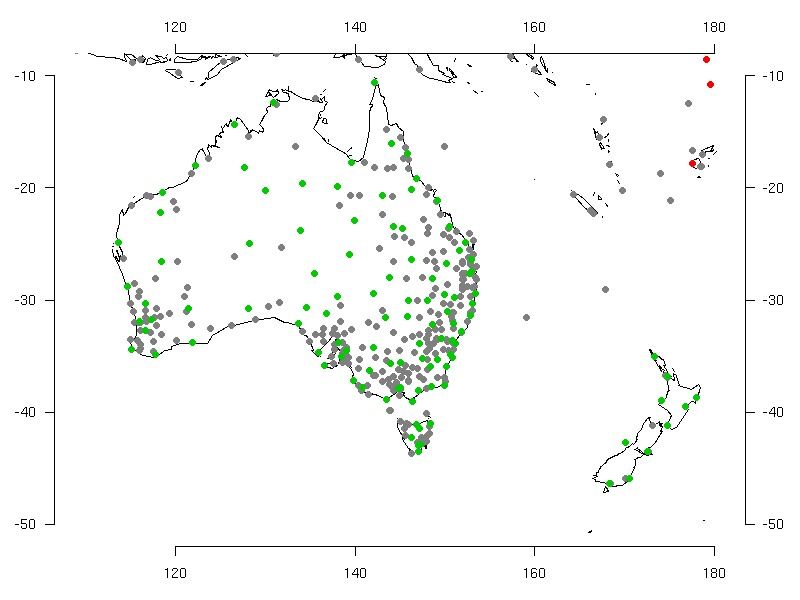
Figure 1: Locations of stations used in CRUTEM3. Grey stations (the majority) are unchanged. Green stations are changed normals/standard deviations. Blue stations are split duplicate IDs (changed numbers). Red stations have changed positions.
| Met Office Hadley Centre observations datasets |
| > Home > CRUTEM3 > |
In the latest update of CRUTEM3 we have made a number of corrections to the station level data on which the gridded product is based. The map below shows the locations of station data (grey dots) and highlights those that have been changed (coloured dots). Any subsequent changes will be similarly documented and we continue to welcome feedback.
The new version of the CRUTEM3 data set is here. The old version of CRUTEM3 has been archived here. If you use either version of the data set, please read the terms and conditions.
The new version of the HadCRUT3 data set is here. The old version of HadCRUT3 has been archived here. If you use either version of the data set, please read the terms and conditions.
112 stations (29% of the total) in WMO regions 93, 94 and 95 - principally Australia and New Zealand - had temperature normals that were not equal to the average of the data for the station over the period 1961-1990. This happened because the station data were updated giving a more complete coverage of data, but the normals, which should have been calculated at the same time, were not. New normals and standard deviations were calculated from the station data. The list of stations with new normals and standard deviations is here.
During construction of the data set, standard deviations for each station were calculated using data from the period 1941-1990. At least 16 years of data were required in this period to calculate a standard deviation. Seven stations had only 15 years of data in the period 1941-1990, so were not previously included in the analysis. These stations have normals (for which only 15 years of data are required in the calculation), but the absence of standard deviations meant that they were being excluded from the analysis. New standard deviations were calculated from the seven stations and they are now included in the analysis. A list of stations with new normals and standard deviations is here.
A number of COOP-network stations in the US had been assigned ID numbers in the CRUTEM database that were not unique. This meant that some station records were accidentally combined in the CRUTEM3 analysis: as a result many of the observations for these stations were unused, and some observations were assigned to the wrong stations. Each station has now been given a unique identifier and all these station records are now correctly included in the analysis. This affects 121 out of almost 1500 US stations, i.e. around 8% of the densely sampled US network. A list of stations which have been assigned new IDs is here.
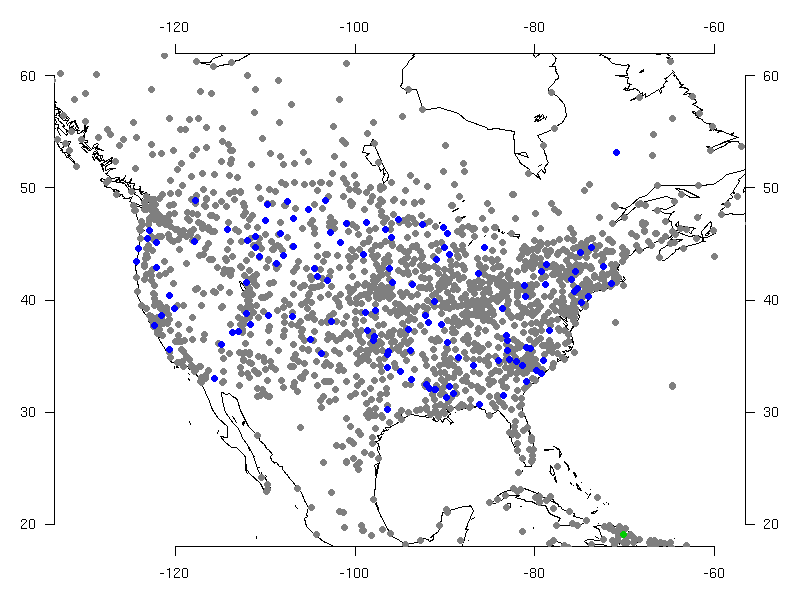
One Canadian station identifier (718260) was being used to identify two stations: one that is currently reporting and one, in a different location, that has now closed. The data from the currently reporting station was being appended to the station data file of the closed station. The difference in location of the two stations and the consequent difference in average temperature lead to an inhomogeneity in the station record. Data from after the closure of the original station were removed from the station data file.
15 stations had incorrect position information: one Antarctic station and fourteen Pacific islands that were close to the date line. The locations were corrected. A list of the stations which had incorrect locations and the changes is here.
The December 1994 reading for station 442130 (Baruunturuun, Mongolia) was missing a minus sign. This was corrected.
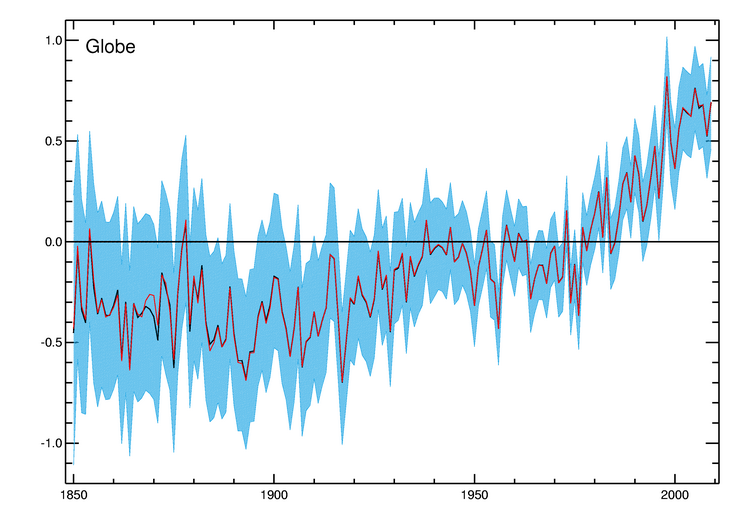
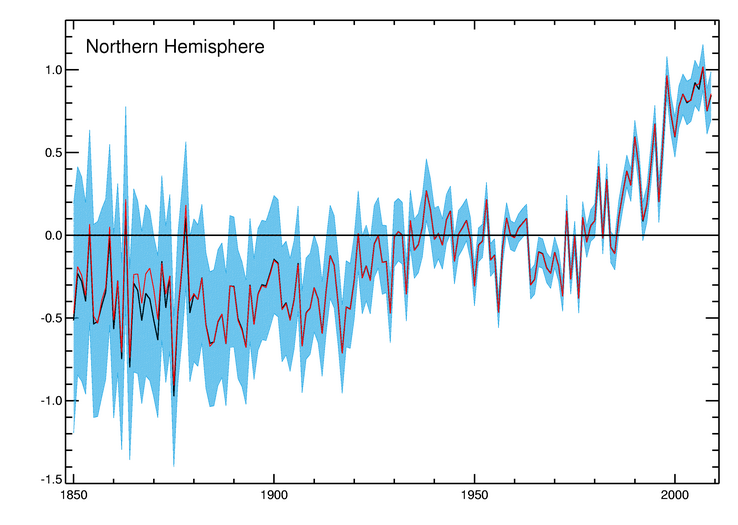
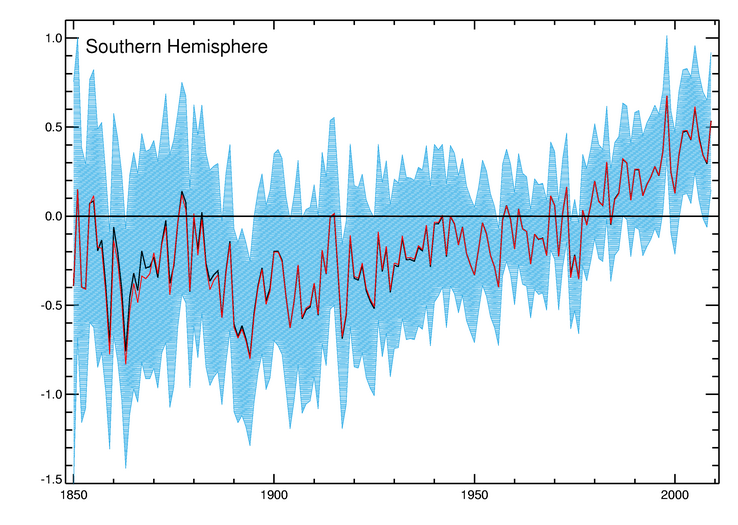
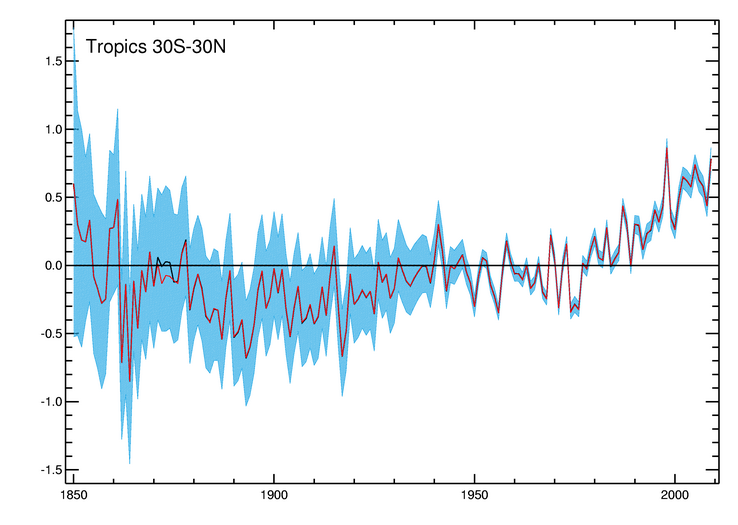
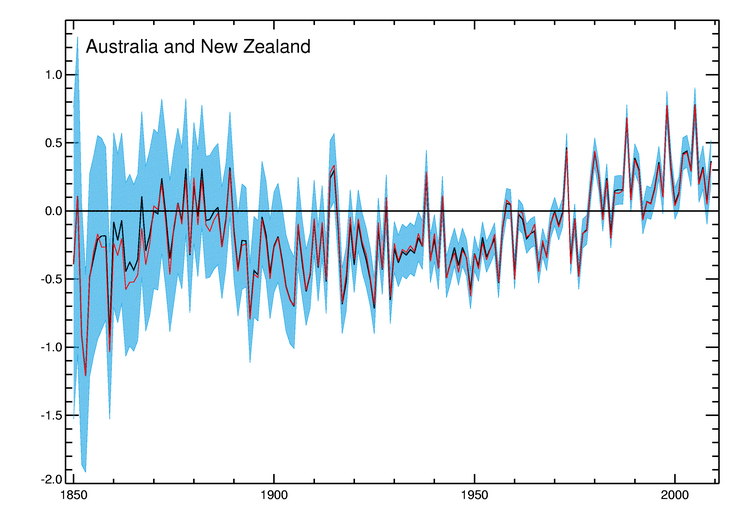
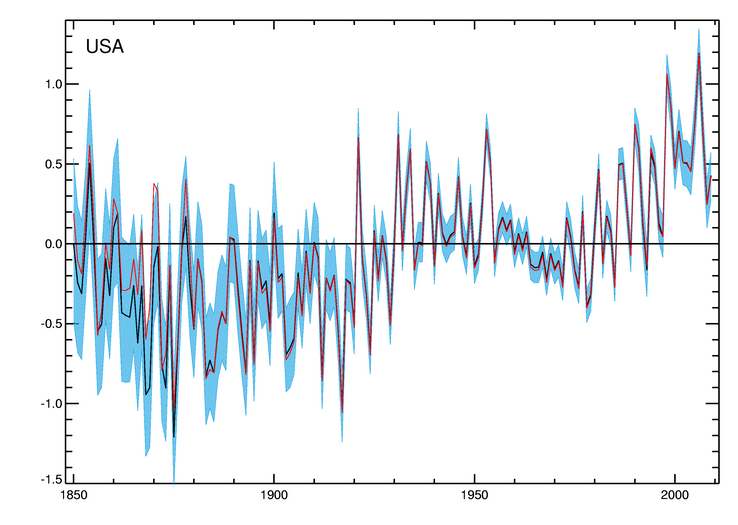
The following diagrams show annual average temperature anomalies for six different regions. In each case the old version of CRUTEM3 is shown in black and the blue area indicates the 95% uncertainty range. The red line shows the average from the corrected CRUTEM3 data.
The corrections made have minimal impact on changes at the largest scales. Even in the two regions most affected by the changes the United States and Australasia - the impact is only discernible in the nineteenth century when there are few stations and the published uncertainties are largest. The new version falls within the stated 95% confidence limits of the old version much more than 95% of the time.
Various other diagnostic plots are produced for CRUTEM3 as a matter of course. Archived versions of the plots from December 2009 are here.
Various other diagnostic plots are produced for HadCRUT3 as a matter of course. Archived versions of the plots from December 2009 are here.
Commercial and media enquiriesYou can access the Met Office Customer Centre, any time of the day or night by phone, fax or e-mail. Trained staff will help you find the information or products that are right for you. |
 |
Maintained by: John Kennedy |
© Crown Copyright
|