DIFFERENCES IN SPECIFIC HUMDITY
Difference Between Original and New Decadal Trends of Specific Humidity in g/kg for the Period 1973 to 2003
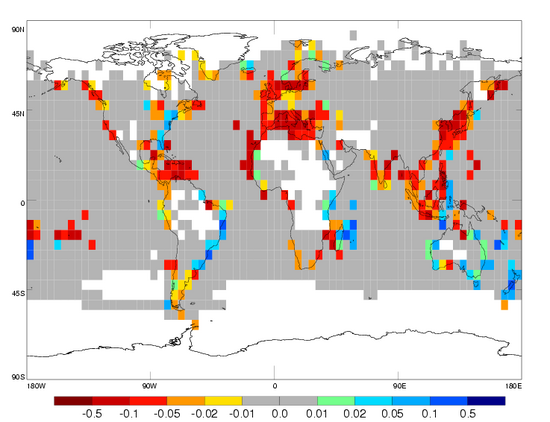
Original minus new HadCRUH Decadal trends of surface specific humidity are shown in g/kg over the period 1973 to 2003. Maximum differences are +0.19 g/kg and -0.26 g/kg. Mean difference is -0.0001 g/kg and standard deviation of the differences is 0.001 g/kg.
Difference between Original and New Zonally Averaged Monthly Mean Anomaly Surface Specific Humidity and Decadal Trends in g/kg
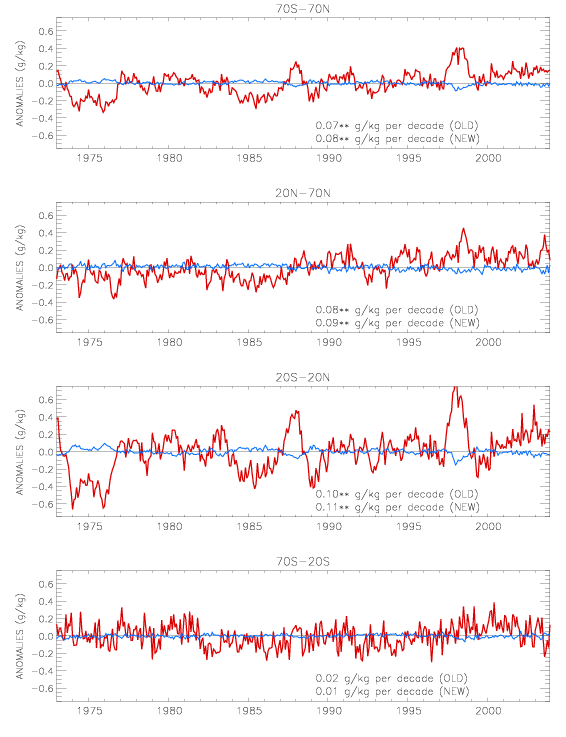
New zonally averaged monthly mean anomaly (relative to a 1974 to 2003 climatology) surface specific humidity timeseries for the Globe (70 °N to 70 °S), Northern Hemisphere (70 °N to 20 °N), Tropics (20 °N to 20 °S) and Southern Hemisphere (20 °S to 70 °S) are shown in red. Original minus new timseries are shown in blue. Both original and new decadal trends are also shown where ** and * denote significance at 1 % and 5 % respectively. The trend was estimated using the Restricted Maximum Likelihood method. Mean differences and standard deviation of the differences for the Globe, Northern Hemisphere, Tropics and Southern Hemisphere are: -0.001 and 0.021, -0.00009 and 0.028, -0.002 and 0.033 and -0.002 and 0.017 in g/kg.
Difference Between Original and New Decadal Trends of Relative Humidity in % for the Period 1973 to 2003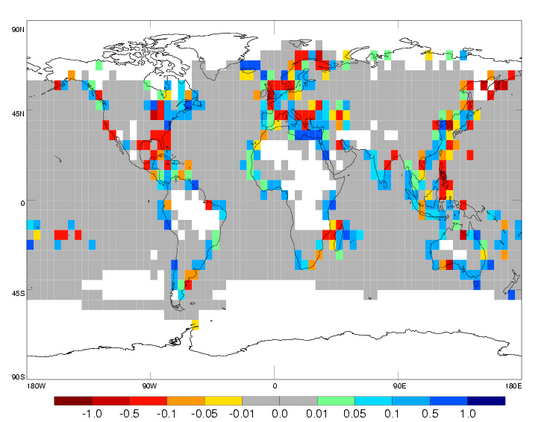 Original minus new HadCRUH Decadal trends of surface relative humidity are shown in % over the period 1973 to 2003. Maximum differences are +0.93 % and -0.72 %. Mean difference is -0.00002 % and standard deviation of the differences is 0.005 %. Difference between Original and New Zonally Averaged Monthly Mean Anomaly Surface Relative Humidity and Decadal Trends in %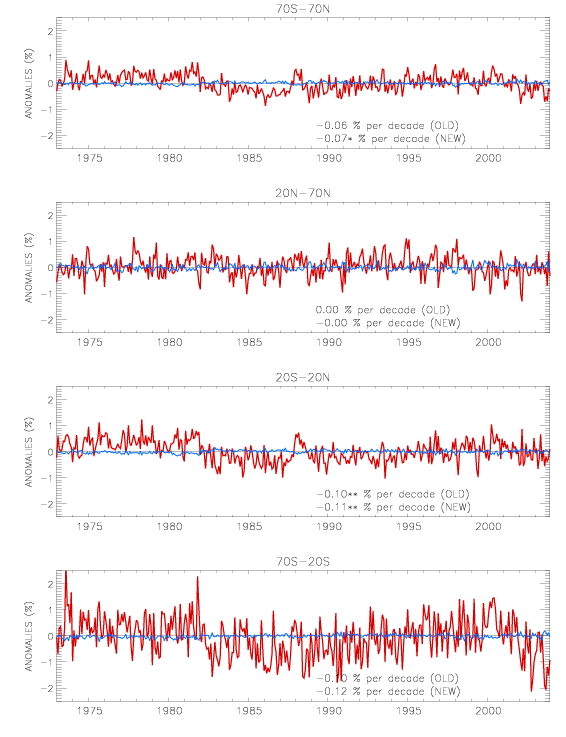 New zonally averaged monthly mean anomaly (relative to a 1974 to 2003 climatology) surface relative humidity timeseries for the Globe (70 °N to 70 °S), Northern Hemisphere (70 °N to 20 °N), Tropics (20 °N to 20 °S) and Southern Hemisphere (20 °S to 70 °S) are shown in red. Original minus new timseries are shown in blue. Both original and new decadal trends are also shown where ** and * denote significance at 1 % and 5 % respectively. The trend was estimated using the Restricted Maximum Likelihood method. Mean differences and standard deviation of the differences for the Globe, Northern Hemisphere, Tropics and Southern Hemisphere are: -0.004 and 0.049, -0.0003 and 0.096, -0.003 and 0.056 and -0.01 and 0.066 in %. |


