Atmospheric carbon dioxide at record high levels despite reduced emissions in 2020
Carbon dioxide has continued to build up in the atmosphere and is now 50% higher than before the industrial revolution
The latest measurements released by the Scripps Institution of Oceanography, UC San Diego show that the atmospheric CO2 concentrations at Mauna Loa Observatory, Hawaii, are now at record levels. The average for March 2021 was 417.14 parts per million (ppm), which is 50% higher than the average for 1750-1800. Independent measurements by NOAA also show record CO2 levels. The Met Office predicts monthly CO2 concentrations in 2021 to peak at 419.5 ± 0.6 ppm in May (Figure 1). This is despite a temporary reduction in global emissions last year due to the Covid-19 pandemic.
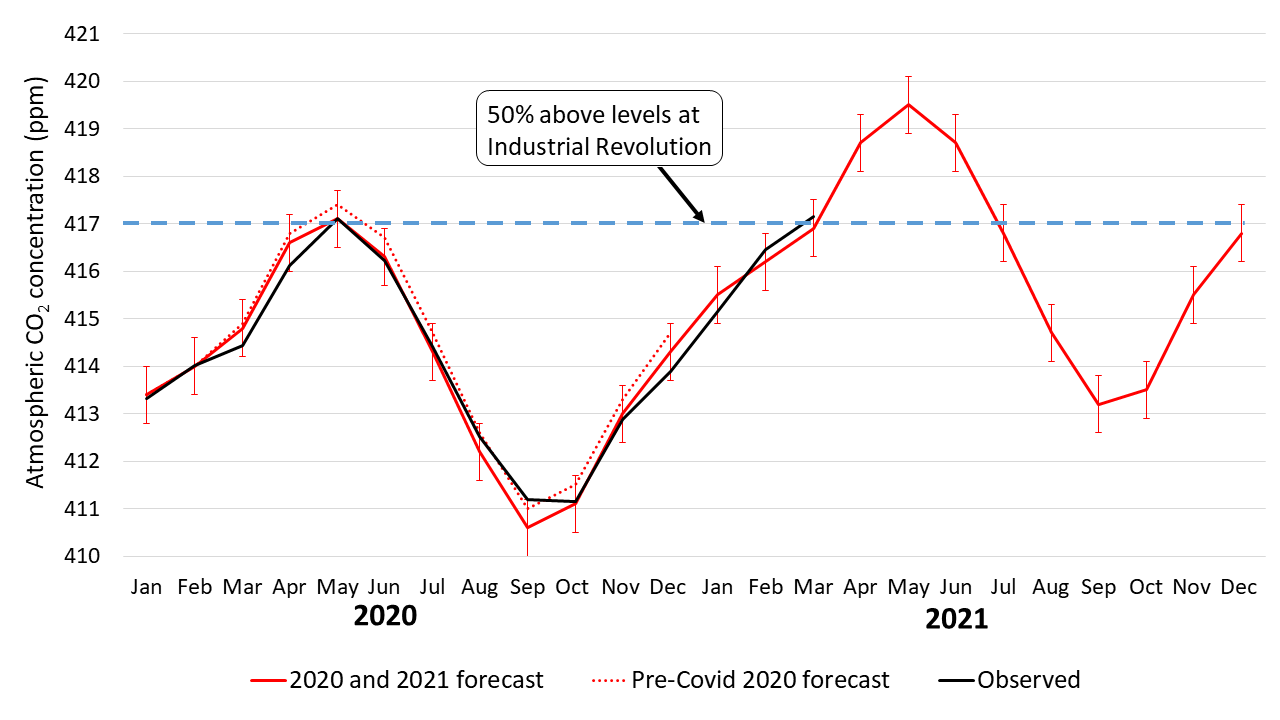
Figure 1. Measured and forecast monthly CO2 concentrations at Mauna Loa Observatory, Hawaii. Black line: measurements by the Scripps Institution of Oceanography, UC San Diego. Solid red line with vertical uncertainty bars: forecast by the Met Office, including the revised forecast for 2020 issued in May 2020 accounting for reduced global emissions due to societal responses to Covid-19. The forecast uncertainty estimate is ± 0.6 ppm. Dotted red line: original Met Office forecast for 2020 issued in January 2020, not accounting for Covid-related emissions reductions. Horizontal dashed blue line: 417 ppm, a 50% increase above 278 ppm, the level in 1750-1800 from ice core records.
Daily measurements often fluctuate by a few ppm around the monthly average, due to winds bringing localised regions of air with higher or lower CO2 concentrations to the measurement sites. On 3rd April, NOAA reported a daily CO2 concentration of 421.21 ppm, a new record high. This is the first daily measurement above 420 ppm, but is not representative of the average conditions.
The previous record for monthly CO2 concentrations at Mauna Loa in the Scripps dataset was 417.10 ppm in May 2020. From June to September, CO2 concentrations at Mauna Loa followed the usual temporarily decline due to uptake of carbon by ecosystems in the northern hemisphere growing season. After a minimum of 411.15 ppm in October 2020, CO2 concentrations increased again as ecosystems released carbon during the northern hemisphere autumn and winter. This natural seasonal cycle is a prominent feature of the famous Keeling Curve graph of atmospheric CO2 at Mauna Loa, on top of the clear long-term rising trend. The annual average atmospheric CO2 concentration is increasing year-on-year and is a major driver of global warming.
Ongoing monitoring of the global carbon budget confirms that the atmospheric CO2 rise is entirely caused by human activity, mainly though the burning of fossil fuels with further contributions from deforestation. Since natural carbon sinks remove CO2 from the atmosphere much more slowly than rate of these emissions, CO2 levels are continuously building up. Reducing emissions slows the rate of build-up but does not stop it altogether unless the overall input of CO2 to the atmosphere reaches zero.
The average CO2 concentration for 2020 in the Scripps Mauna Loa dataset was 413.94 ppm, based on a 12-month average centred on 1st July 2020. This was 2.51 ppm higher than the previous year. The NOAA measurements show an annual rise of 2.58 ppm. In the regular forecast of CO2 concentrations issued in 2020, the Met Office had originally predicted the CO2 rise between 2019 and 2020 to be 2.74 ± 0.57 ppm. However, in 2020, global emissions unexpectedly reduced temporarily due to reduced transport and economic activity as a result of the Covid-19 pandemic. This prompted a re-calculation of the Met Office atmospheric CO2 forecast for that year. The revised prediction of the CO2 rise was 2.48 ± 0.57 ppm - a slightly smaller increase than had previously been forecast, but still an ongoing rise.
The observed CO2 rise was therefore closer to the central estimate of the revised forecast accounting for the emissions reductions than the original forecast. However, the difference between the two forecasts was smaller than forecast uncertainty estimate and also smaller than the year-to-year variability in the atmospheric CO2 rise which occurs as a result of natural changes in carbon sinks. This shows that the emissions reduction in 2020 was not enough to substantially impact the build-up of CO2 in the atmosphere, and much larger, longer-term reductions in emissions will be required to slow or stop the rise.
The annual average CO2 concentration for 2021 is forecast to be 416.3 ± 0.6 ppm, an increase of 2.29 ± 0.55 ppm from 2020. Although this would be a slightly smaller rise than 2019-2020, this does not reflect an expectation of reduced CO2 emissions. The 2021 forecast calculation assumes that CO2 emissions in 2021 will be the same as 2019. The slightly smaller predicted rise in 2021 is due to the expected impacts of the recent La Niña event, as these events typically cause a temporary strengthening of land carbon sinks.
A CO2 concentration of 417 ppm is 50% higher than the levels at the time of the industrial revolution, which can be found with high confidence from ice core records (Figure 2). The average CO2 concentration between 1750 and 1800 was 278 ppm, and this is the value that the Intergovernmental Panel on Climate Change (IPCC) used as the pre-industrial baseline for CO2 in its fifth assessment report (pdf).
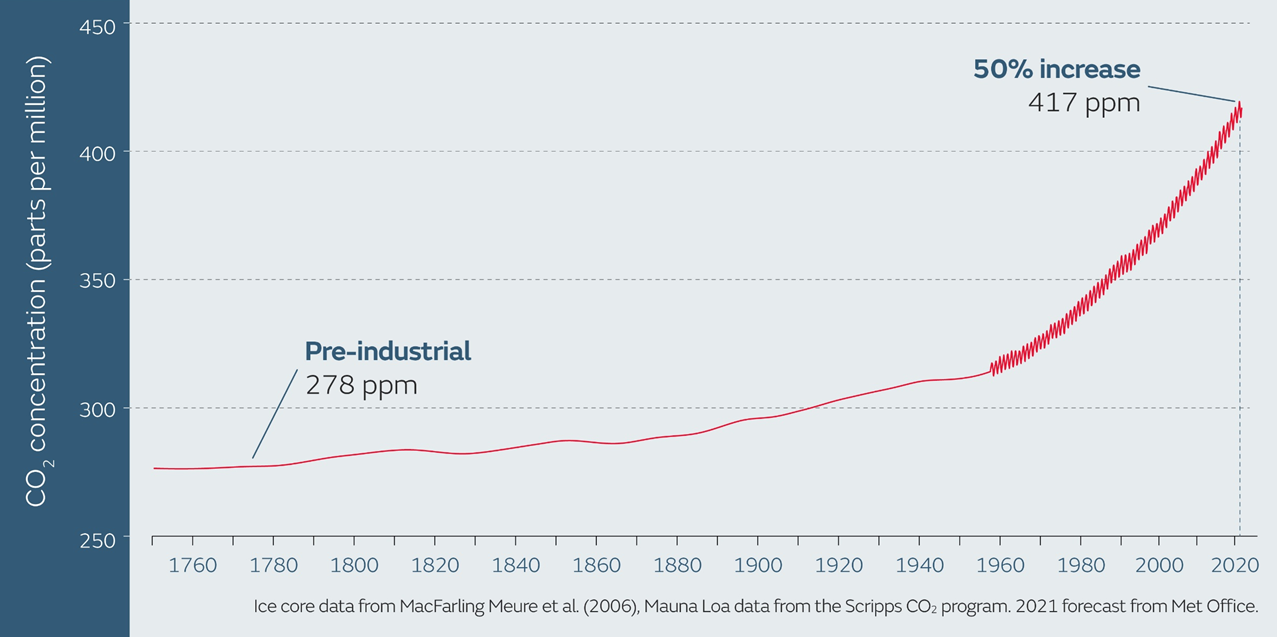 Figure 2. Atmospheric CO2 levels from 1700 to 2021. This is based on ice core data before 1958, then the instrumental record at Mauna Loa from the Scripps CO2 program and, finally, the 2021 CO2 forecast from the Met Office. The apparent change in 1958 is because ice core records do not capture the seasonal cycle seen in instrumental records.
The human-caused 50% increase in CO2 has been a major driver of the observed global temperature rise of over 1°C. It is also symbolic because a 50% increase is halfway towards “doubled-CO2” which has long been an important benchmark for quantifying future global warming. For example, the long-term warming in response to a doubling of CO2 concentrations relative to pre-industrial is defined with the standard metric of Equilibrium Climate Sensitivity (ECS), with recent research suggesting that ECS is likely to be between 2.6°C and 4.1°C.
The build-up of CO2 in the atmosphere has also been accelerating. It took over 200 years for levels to increase by 25%, but now just over 30 years later, levels are at a 50% increase. If the current trend continues, doubled-CO2 will be reached in approximately 55 years. Reversing this trend and slowing the atmospheric CO2 rise and global warming will need global emissions to reduce. Projections by the IPCC suggest that to halt global warming at 1.5°C, global emissions will need to reach net zero by approximately 2050, possibly much sooner.
Authors:
Richard Betts, Met Office Hadley Centre and University of Exeter Global Systems Institute
Ralph Keeling, Scripps Institution of Oceanography, UC San Diego
7th April 2021