
Maintained by: Robert Dunn
Last updated: 29/01/2013 Expires: 29/01/2014
Hosted by: Met Office Hadley Centre
© Crown Copyright
| Met Office Hadley Centre observations datasets |
| > Home > HadISD > 1.0.1.2012p > Online Material > |
Please read the paper before using the material presented here.
The netCDF headers are listed below with some information as to what they contain.
| Field Name | Long Name | Units | |
|---|---|---|---|
| time | Time | Hours since 1-1-1973 00:00UT | |
| input_station_id | Primary source for timestep data | ||
| temperatures | C | ||
| dewpoints | C | ||
| total_cloud_cover | oktas | ||
| low_cloud_cover | oktas | ||
| mid_cloud_cover | oktas | ||
| high_cloud_cover | oktas | ||
| cloud_base | m | ||
| windspeeds | m/s | ||
| winddirs | degree | ||
| slp | sea-level pressure | hPa | |
| past_sigwx1 | Past significant weather code | ||
| precip1_depth | Depth of Precipitation | ||
| qc_flags | Quality control flags | ||
| flagged_values | Removed values (T, D, S, TC, LC, MC, HC, WS, WD) | ||
| change_points | Month and year for change in reporting or instrument resolution | ||
| change_notes | Any notes associated with the change point | ||
A number of files and plots are linked below which were used or generated when creating HadISD.
| Description | Subset | Data file | Notes |
|---|---|---|---|
| First Internal Checks | 1 | InternalLog1.txt | 1 |
| 2 | InternalLog2.txt | 1 | |
| 3 | InternalLog3.txt | 1 | |
| 4 | InternalLog4.txt | 1 | |
| First External Checks | ExternalLog.txt | ||
| First Masking Run | MaskingLog.txt | ||
| Second Internal Checks | 1 | InternalLog1_2.txt | 1 |
| 2 | InternalLog2_2.txt | 1 | |
| 3 | InternalLog3_2.txt | 1 | |
| 4 | InternalLog4_2.txt | 1 | |
| Second External Checks | ExternalLog_2.txt | ||
| Second Masking Run | MaskingLog_2.txt | ||
| First Internal Summary | qc_summary_internal.txt | 2 | |
| First External Summary | qc_summary_external.txt | 2 | |
| Second Internal Summary | qc_summary_internal2.txt | 2 | |
| Second External Summary | qc_summary_external2.txt | 2 | |
| Second Mask Summary | qc_summary_mask2.txt | 2 | |
| Description | Station Number | Data file | Notes |
| HadISD Station List | 6103 | hadisd_station_info_v101.txt | 3 |
| Full Station List | 6103 | kept_station_info.txt | 3 |
| Composite Stations | 943 | composites_sorted.txt | 4 |
| Duplicated Stations | 83 | final_remove_dups_MAY09.txt | |
| No neighbours to do comparison check | 704 | no_neighbour_checks.txt | |
| Spurious Stations - noted in the QC | spurious_stations.txt | ||
| Expert Stations | 73 | expert_stations.txt | |
| Checked Composite Stations | 20 | checked_composites.dat | |
| Final Thinning - Accepted stations | 4206 | accept_20_1980_2000_12_24_3_3_20_5pc.txt | |
| Final Thinning - Rejected stations | 1897 | reject_20_1980_2000_12_24_3_3_20_5pc.txt | |
| User Identified erroneous data | user_identified_bad_stations.txt | 9 January 2013 | |
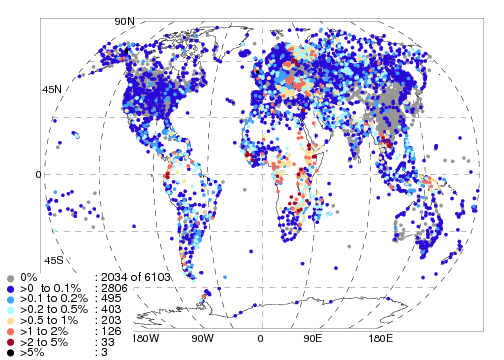
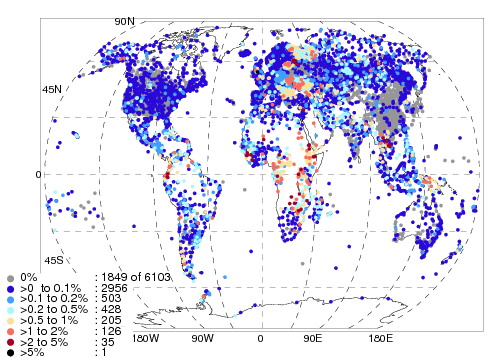
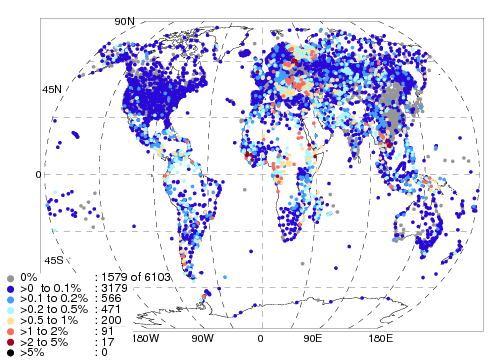
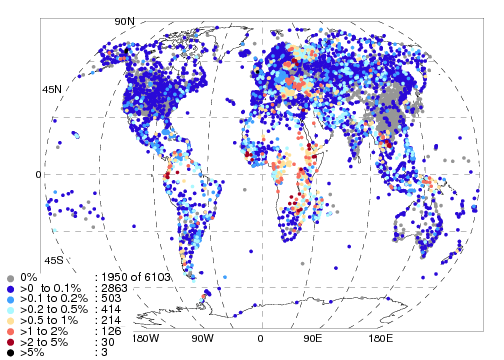
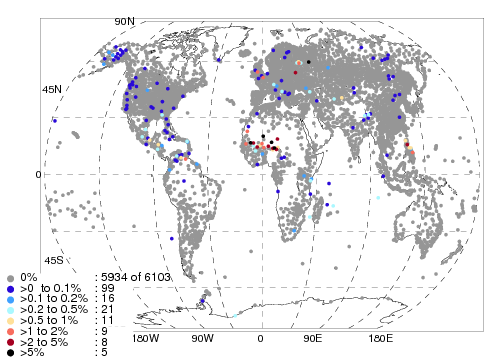
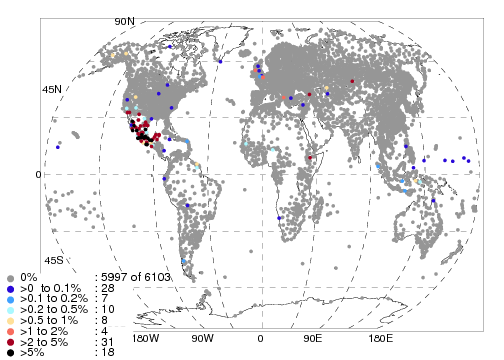
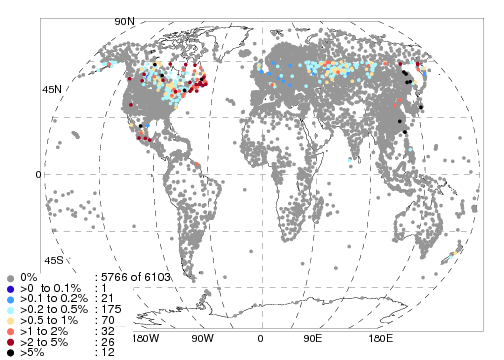
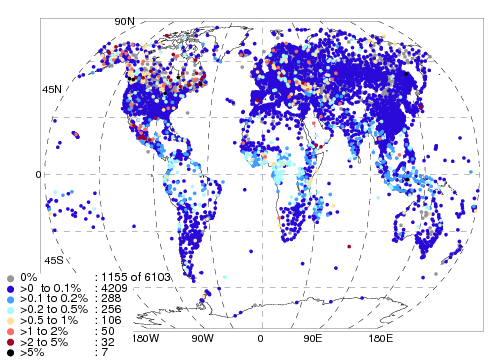
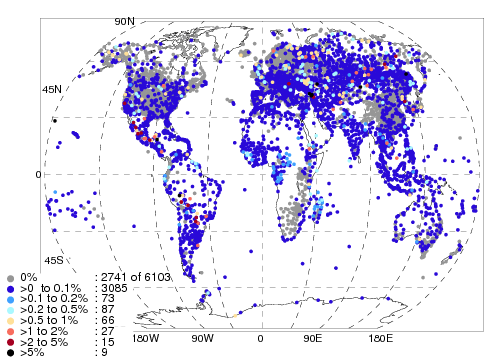
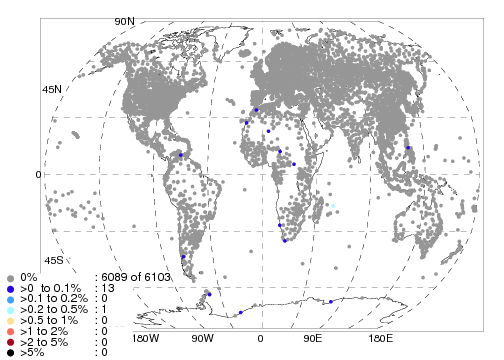
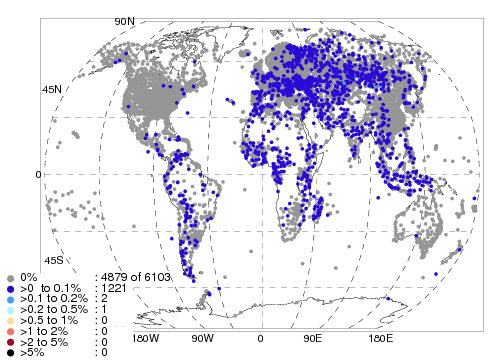
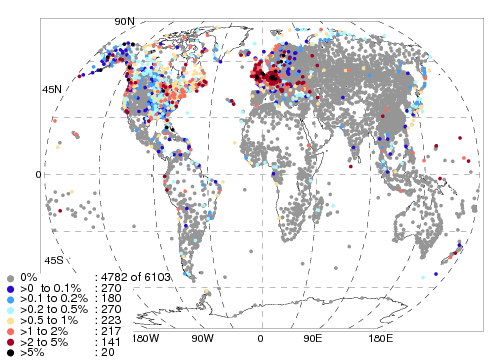
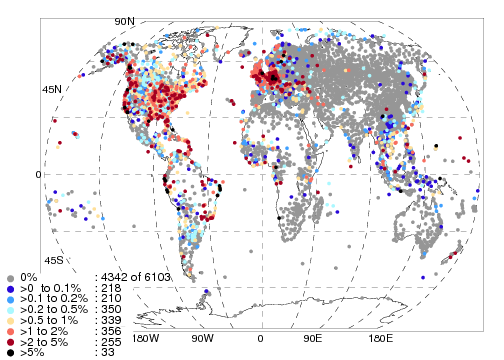
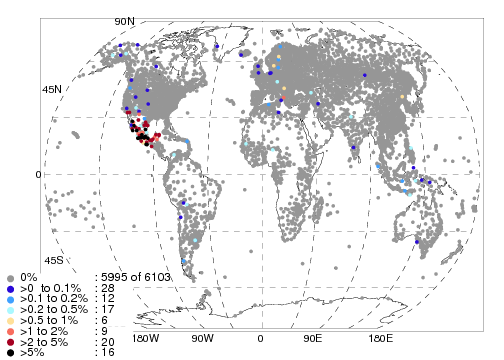
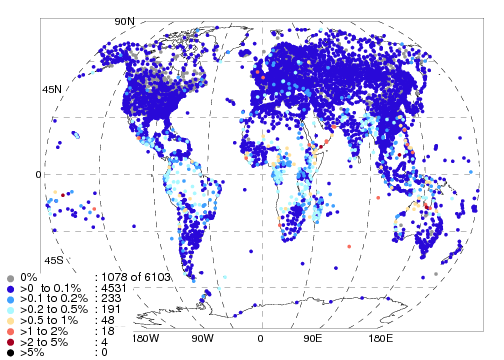
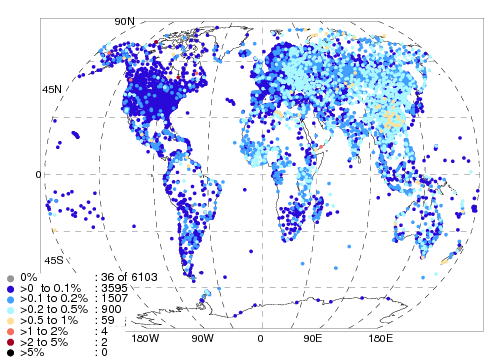
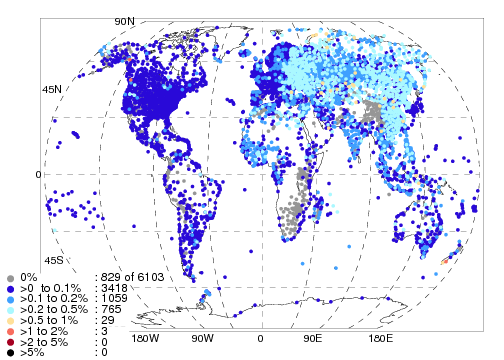
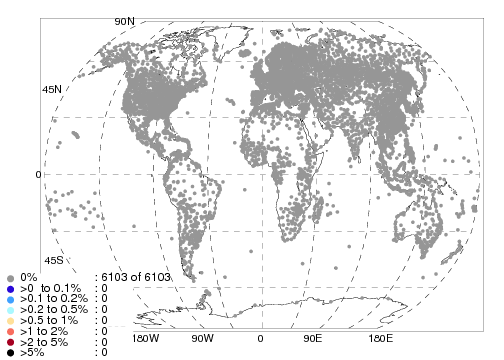
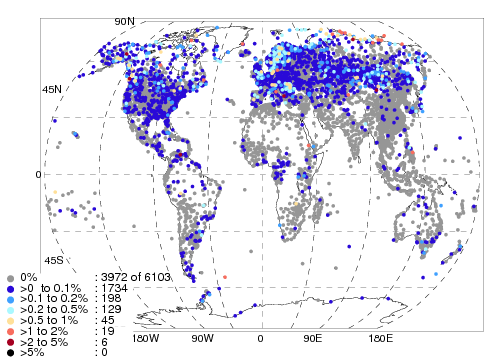
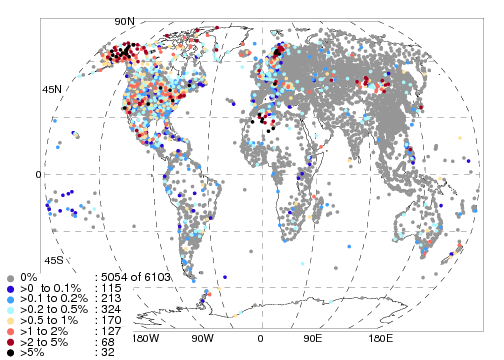
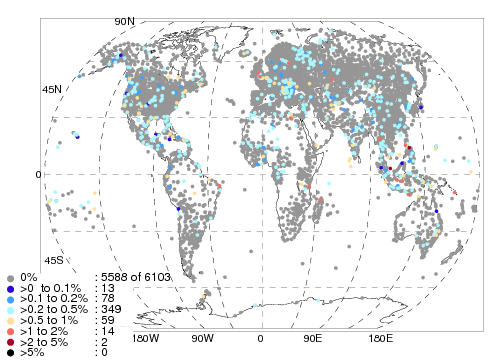
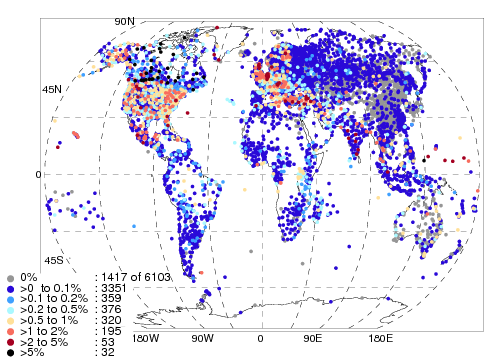
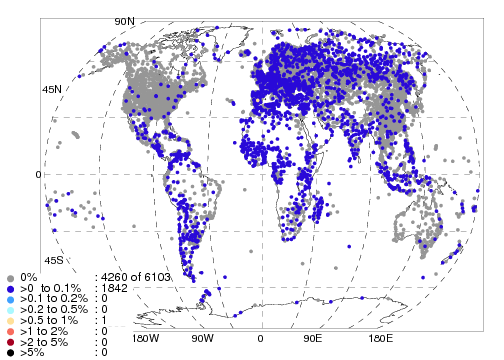
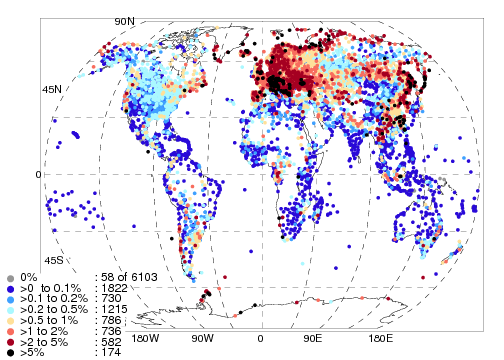
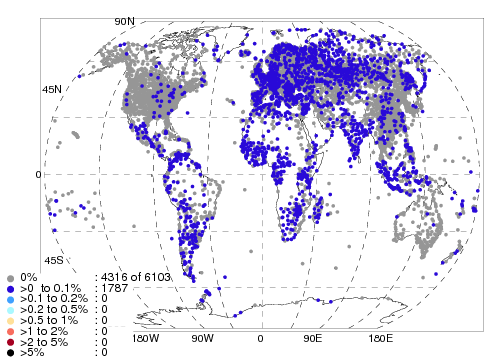
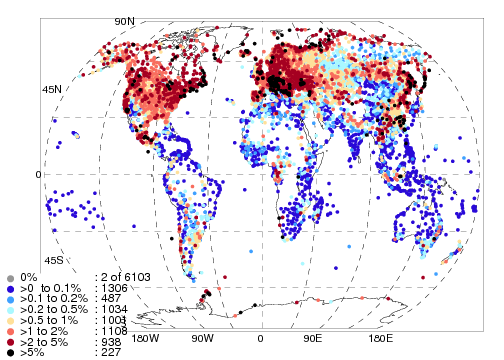
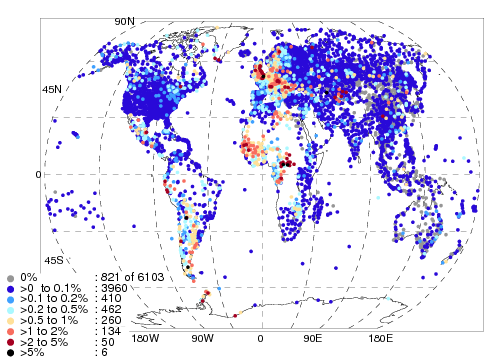
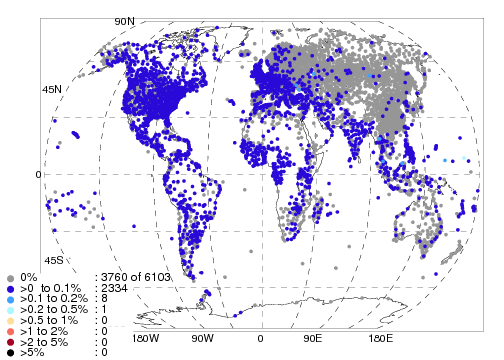
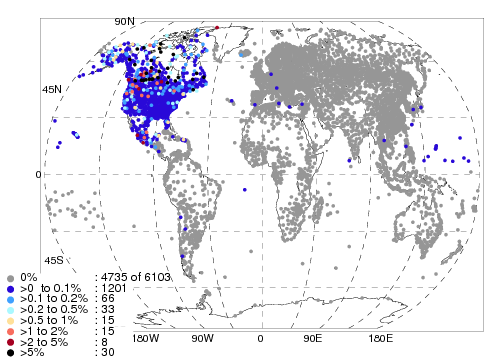
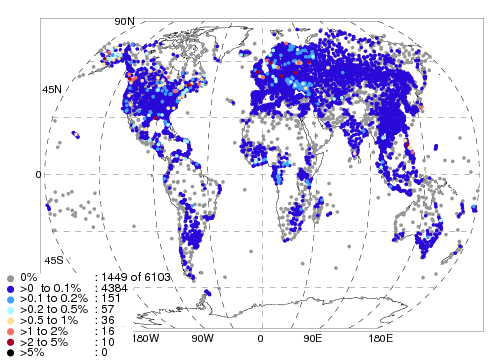
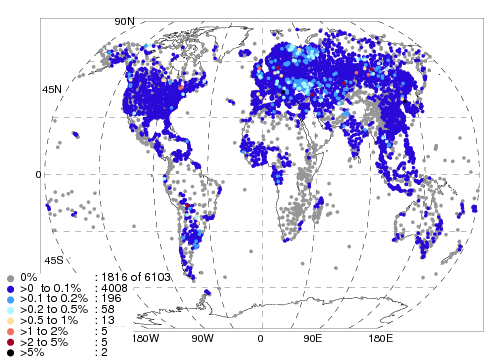
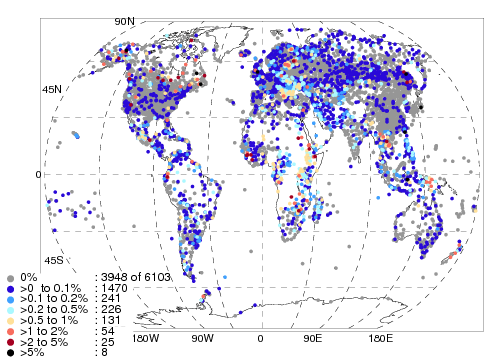
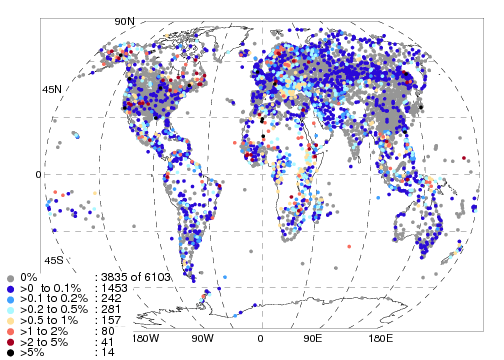
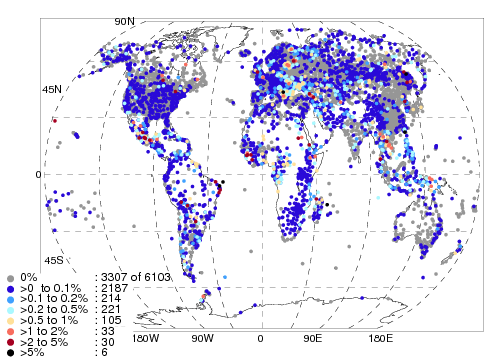
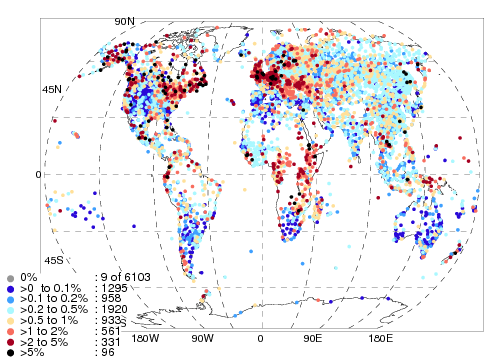
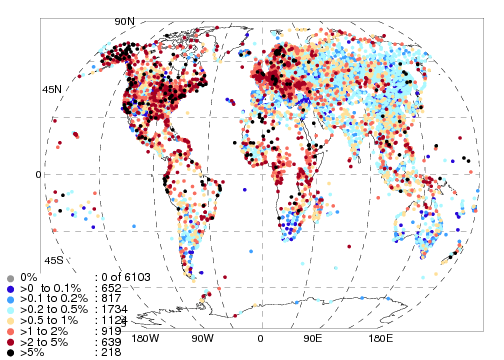
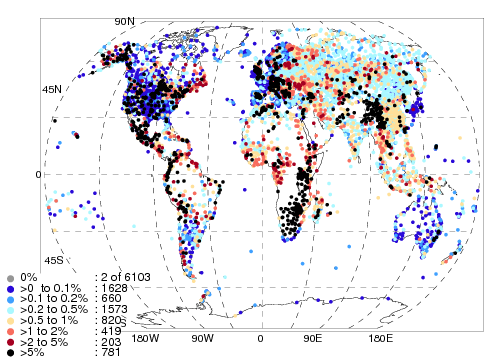
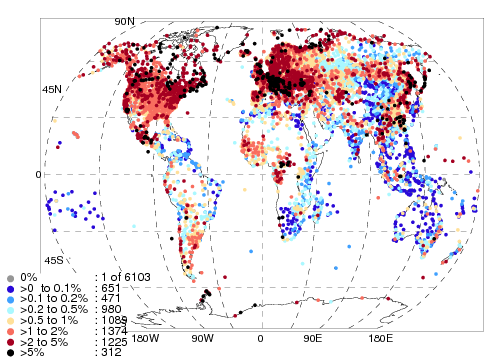
| Number of stations with a failures from a certain test in percentage bins | all_fails_summary_20130123.dat | 5 | |
| As above but for non-composite stations | all_fails_summary_20130123_non_comp.dat | ||
| As above but for composite stations | all_fails_summary_20130123_comp.dat | ||
| Test 3-letter code descriptor | tests_codes.txt | ||
| Test | Variable | PostScript | PNG |
|---|---|---|---|
| Duplicate months | All | eps | png |
| Odd Cluster | Temperatures | eps | png |
| Odd Cluster | Dew Points | eps | png |
| Odd Cluster | SLP | eps | png |
| Odd Cluster | Wind Speed | eps | png |
| Frequent Value Check | Temperature | eps | png |
| Frequent Values | Dew point | eps | png |
| Frequent Values | SLP | eps | png |
| Diurnal Cycle Check | All | eps | png |
| Gap Check | Temperature | eps | png |
| Gap Check | Dew point | eps | png |
| Gap Check | SLP | eps | png |
| Record Check | Temperature | eps | png |
| Record Check | Dew point | eps | png |
| Record Check | SLP | eps | png |
| Record Check | Wind Speed | eps | png |
| Day Strings | Temperature | eps | png |
| Day Strings | Dew point | eps | png |
| Day Strings | SLP | eps | png |
| Day Strings | Wind Speed | eps | png |
| Straight Strings | Temperature | eps | png |
| Straight Strings | Dew point | eps | png |
| Straight Strings | SLP | eps | png |
| Straight Strings | Wind Speed | eps | png |
| Hour Strings | Temperature | eps | png |
| Hour Strings | Dew point | eps | png |
| Hour Strings | SLP | eps | png |
| Hour Strings | Wind Speed | eps | png |
| All temperature strings | Temperature | eps | png |
| All dewpoint strings | Dew point | eps | png |
| All SLP strings | SLP | eps | png |
| All wind strings | Wind Speed | eps | png |
| Climatological Check | Temperature | eps | png |
| Climatological Check | Dew point | eps | png |
| Climatological Check | SLP | eps | png |
| Spike Check | Temperature | eps | png |
| Spike Check | Dew point | eps | png |
| Spike Check | SLP | eps | png |
| Supersaturation | Dew point | eps | png |
| Dew point depression | Dew point | eps | png |
| Dew point Cut Off | Dew point | eps | png |
| Variance Check | Temperature | eps | png |
| Variance Check | Dew point | eps | png |
| Variance Checks | SLP | eps | png |
| Cloud Total | Low,Mid,High,Total | eps | png |
| Unobservable | High Cloud | eps | png |
| Unobservable | Low Cloud | eps | png |
| Unobservable | Mid Cloud | eps | png |
| Unobservable | Total Cloud | eps | png |
| Full Low cloud check | Mid & High Cloud | eps | png |
| Full Mid cloud check | High Cloud | eps | png |
| Negative cloud value | All Cloud | eps | png |
| Neighbour Outlier | Temperature | eps | png |
| Neighbour Outlier | Dew point | eps | png |
| Neighbour Outlier | SLP | eps | png |
| Month cleared | Temperature | eps | png |
| Month cleared | Dew point | eps | png |
| Month cleared | SLP | eps | png |
| Month Cleared | Wind Speed | eps | png |
| Month cleared | Wind Direction | eps | png |
| Month cleared | Total cloud | eps | png |
| Month cleared | High Cloud | eps | png |
| Month cleared | Mid Cloud | eps | png |
| Month cleared | Low Cloud | eps | png |
| Month cleared | Cloud Base | eps | png |
| All | Temperature | eps | png |
| All | Dew point | eps | png |
| All | SLP | eps | png |
| All | Cloud | eps | png |
Notes
[1] The internal checks were run as 4 separate IDL process, and so
there are 4 separate log files, each covering 1/4 of the stations.
[3] You will need the test_codes.txt to interpret
these outputs
[3] Station ID, latitude, longitude and elevation used.
[4] First ID in the line is the station ID used throughout the
processing. The remainder are ones which were composited into this
station record.
[5] Table 6 in the paper was created from this
file. And you will need the test_codes.txt file to interpret these outputs.
|
Maintained by: Robert Dunn |
© Crown Copyright |