
Maintained by: Robert Dunn
Last updated: 20/01/2015 Expires: 20/01/2016
Hosted by: Met Office Hadley Centre
© Crown Copyright
| Met Office Hadley Centre observations datasets |
| > Home > HadISD > 1.0.4.2015p > Online Material > |
Please read the paper before using the material presented here.
The netCDF headers are listed below with some information as to what they contain.
| Field Name | Long Name | Units | |
|---|---|---|---|
| time | Time | Hours since 1-1-1973 00:00UT | |
| input_station_id | Primary source for timestep data | ||
| temperatures | C | ||
| dewpoints | C | ||
| total_cloud_cover | oktas | ||
| low_cloud_cover | oktas | ||
| mid_cloud_cover | oktas | ||
| high_cloud_cover | oktas | ||
| cloud_base | m | ||
| windspeeds | m/s | ||
| winddirs | degree | ||
| slp | sea-level pressure | hPa | |
| past_sigwx1 | Past significant weather code | ||
| precip1_depth | Depth of Precipitation | ||
| qc_flags | Quality control flags | ||
| flagged_values | Removed values (T, D, S, TC, LC, MC, HC, WS, WD) | ||
| change_points | Month and year for change in reporting or instrument resolution | ||
| change_notes | Any notes associated with the change point | ||
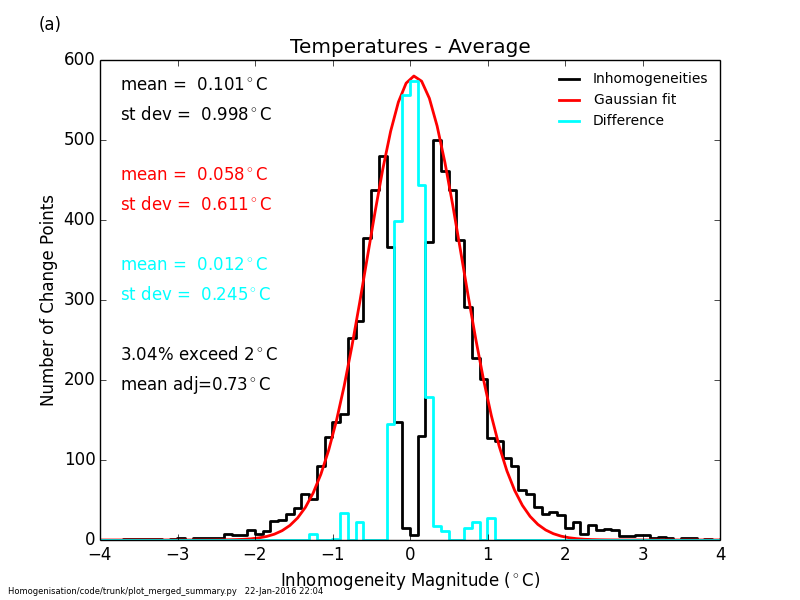
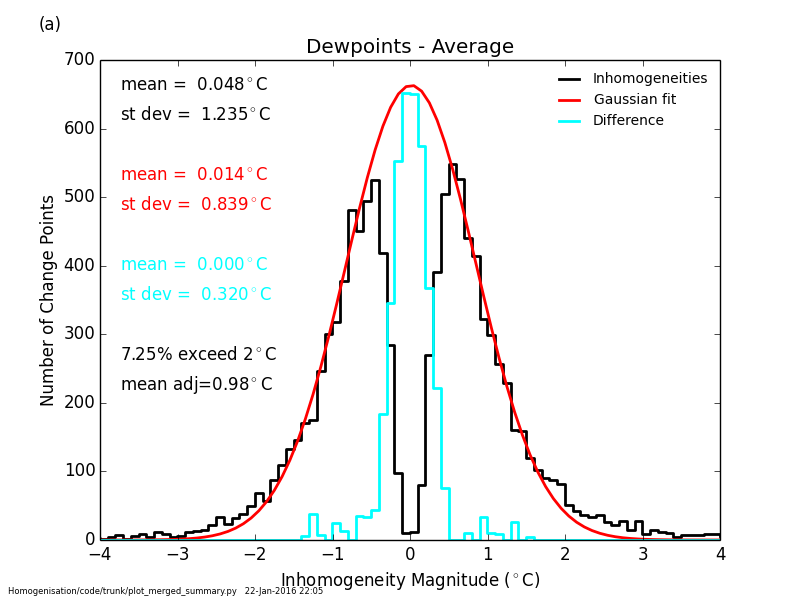
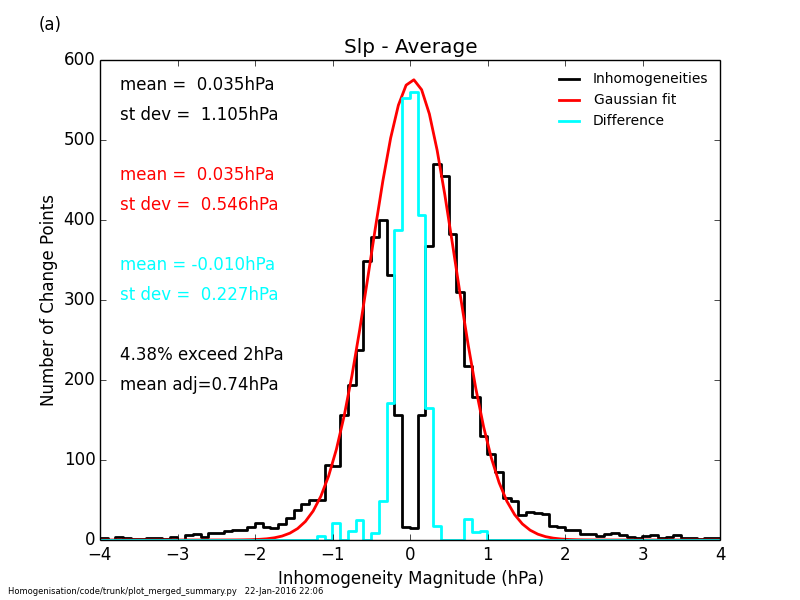
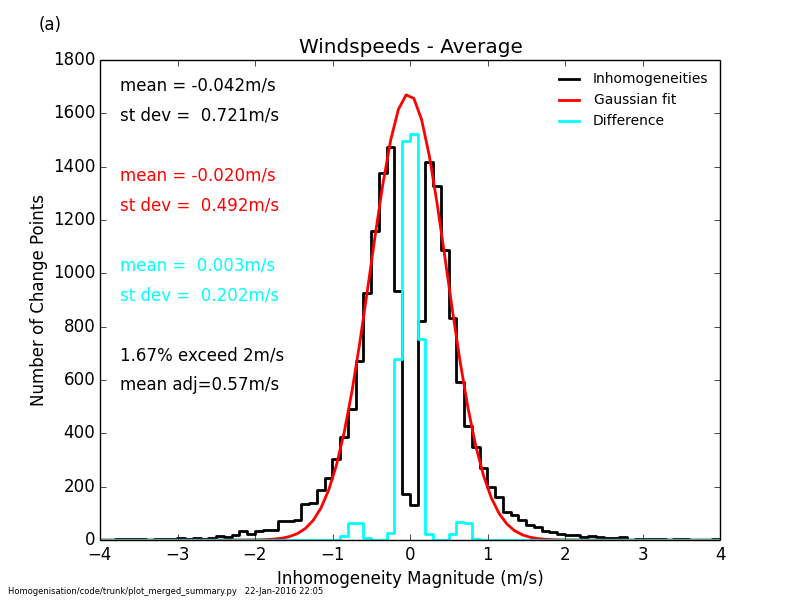
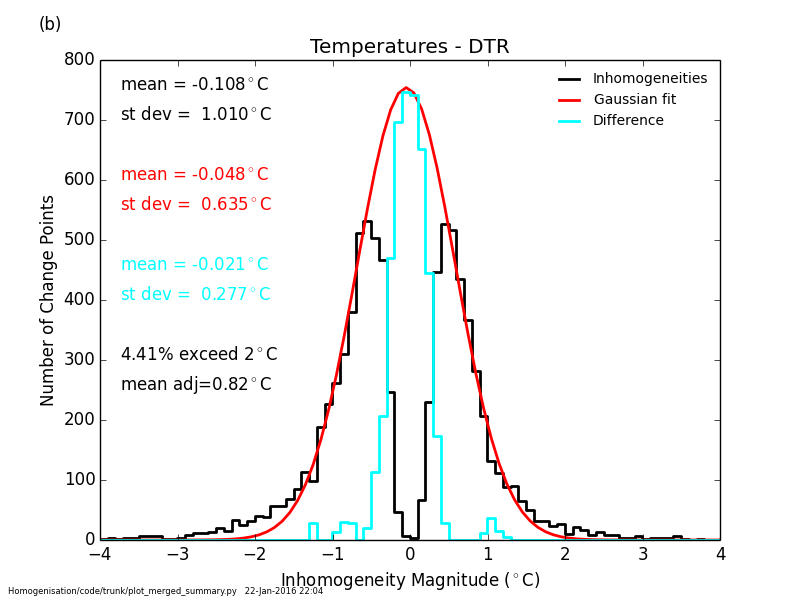
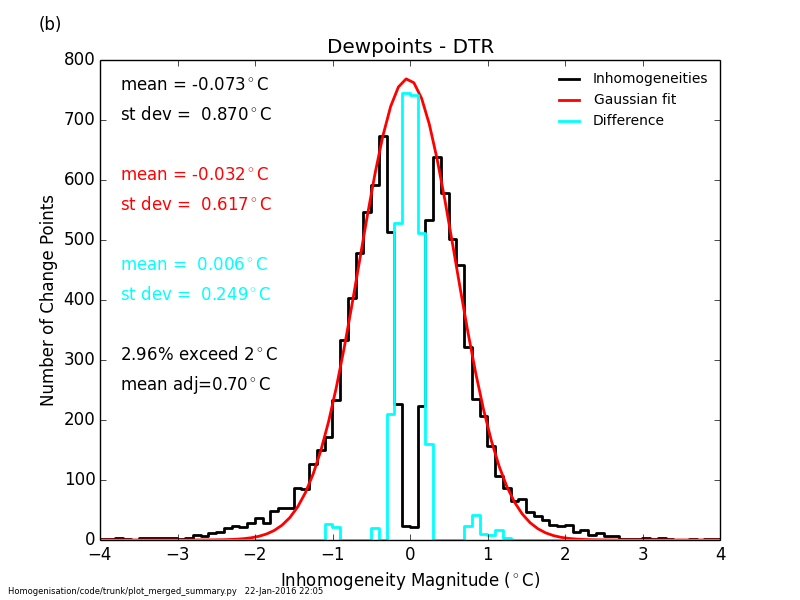
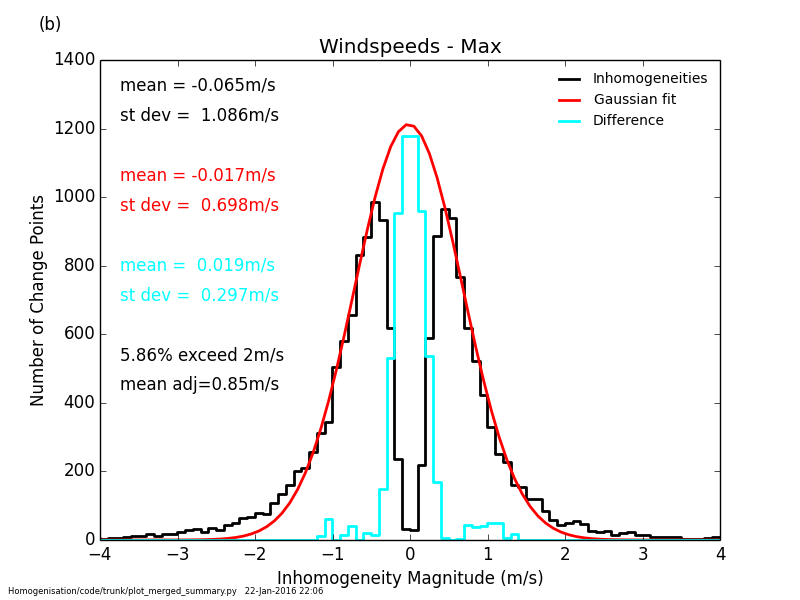
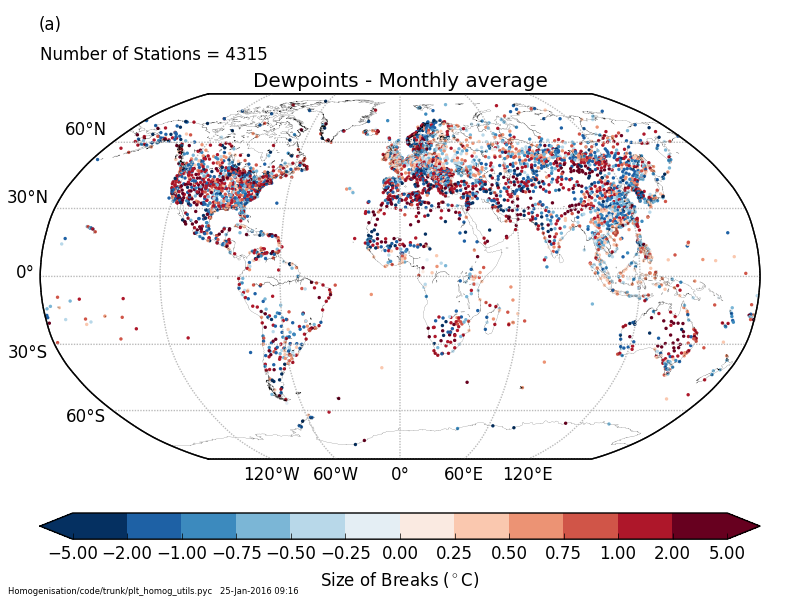
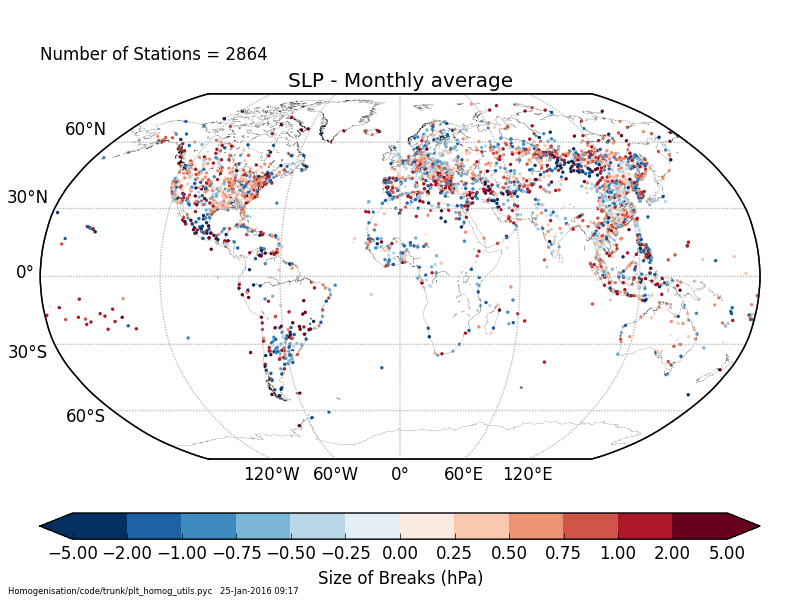
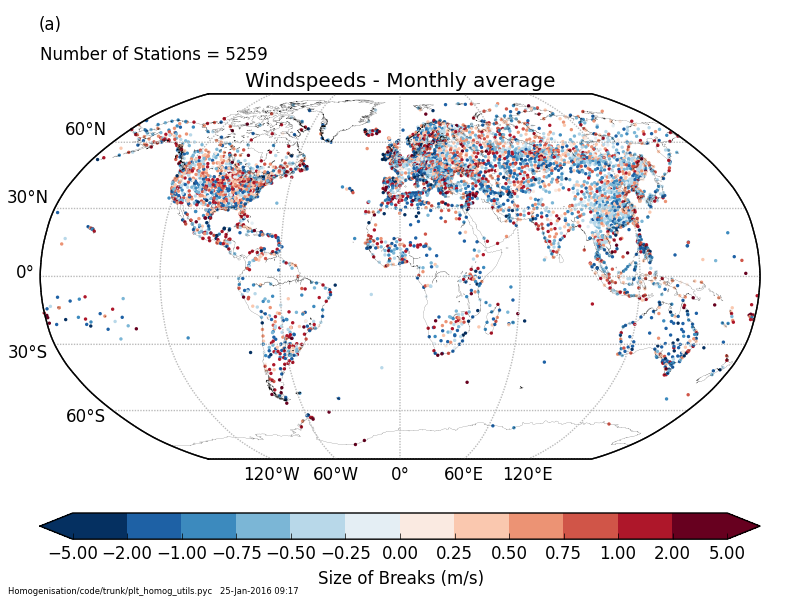
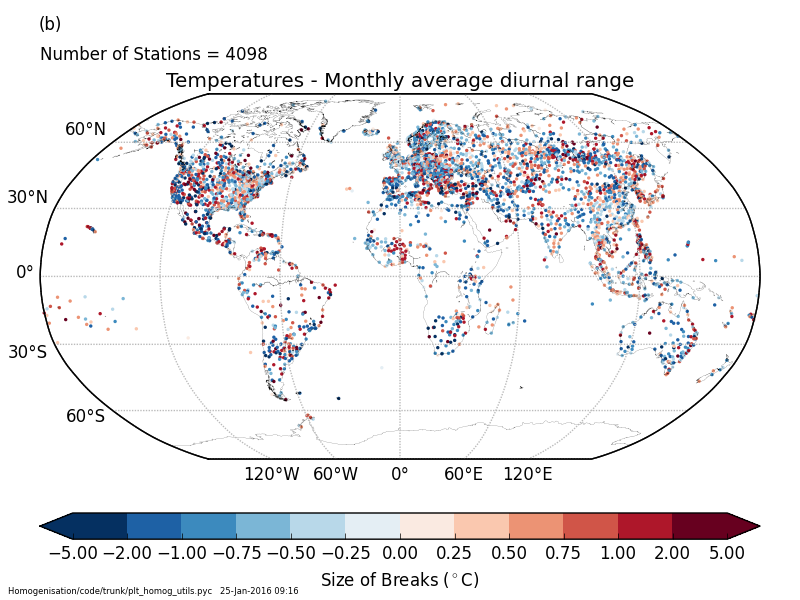
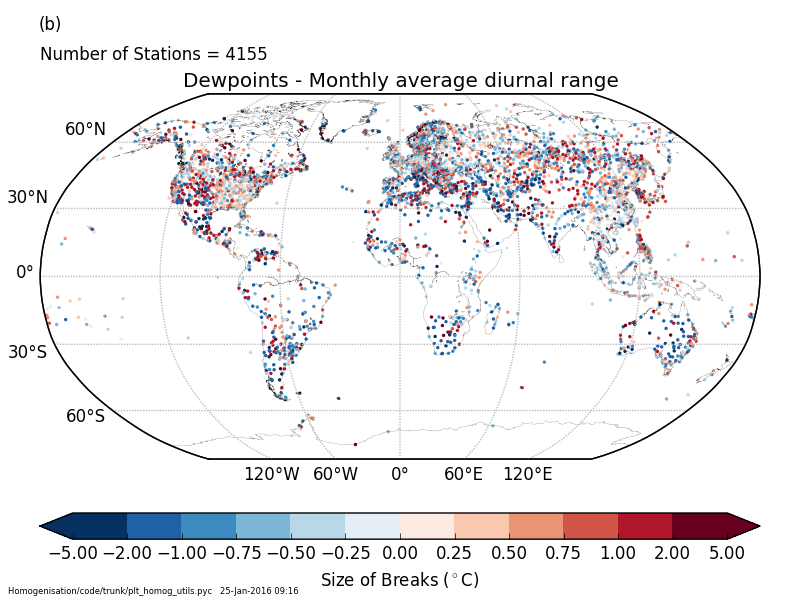
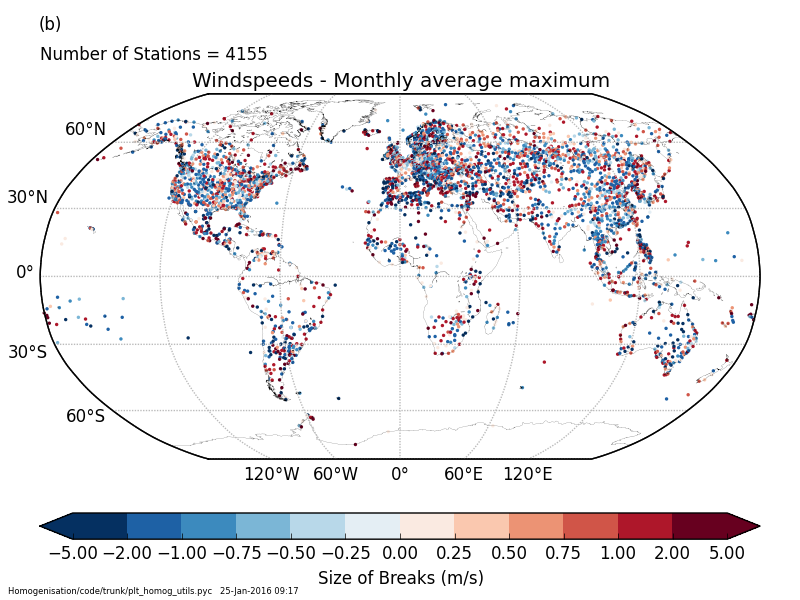
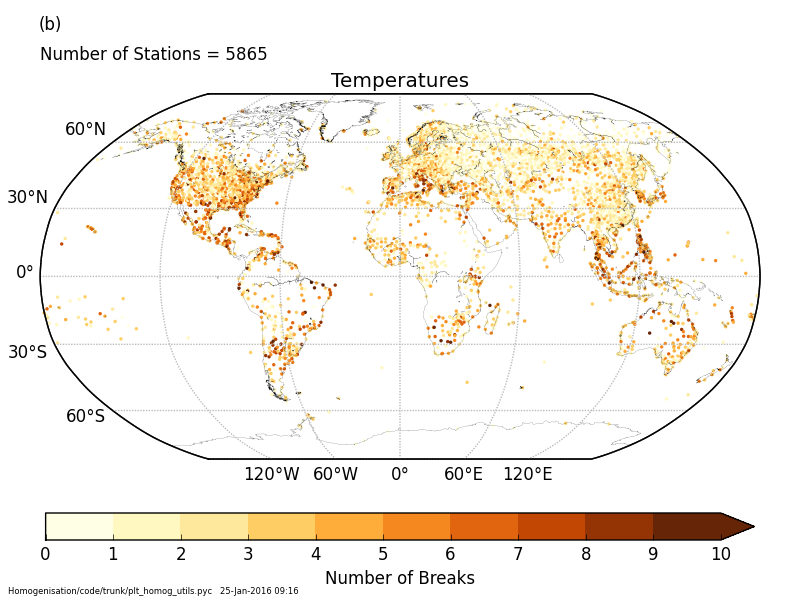
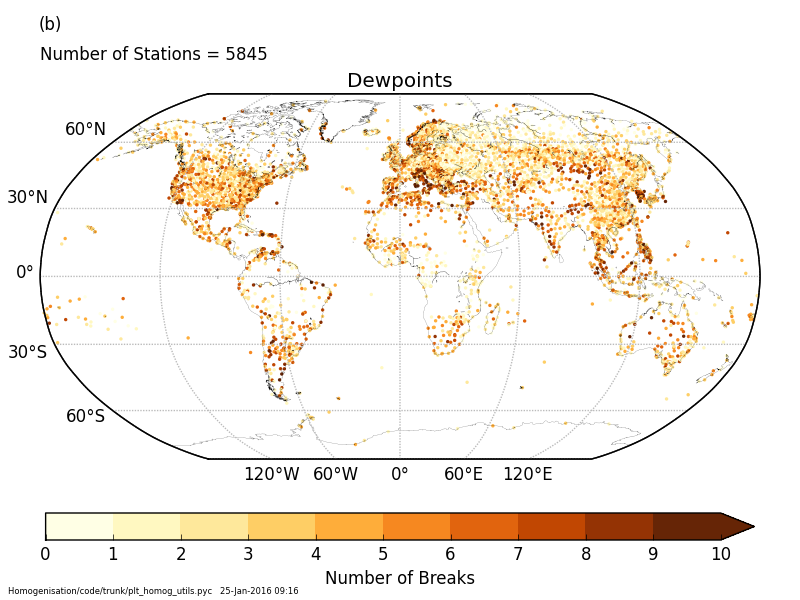
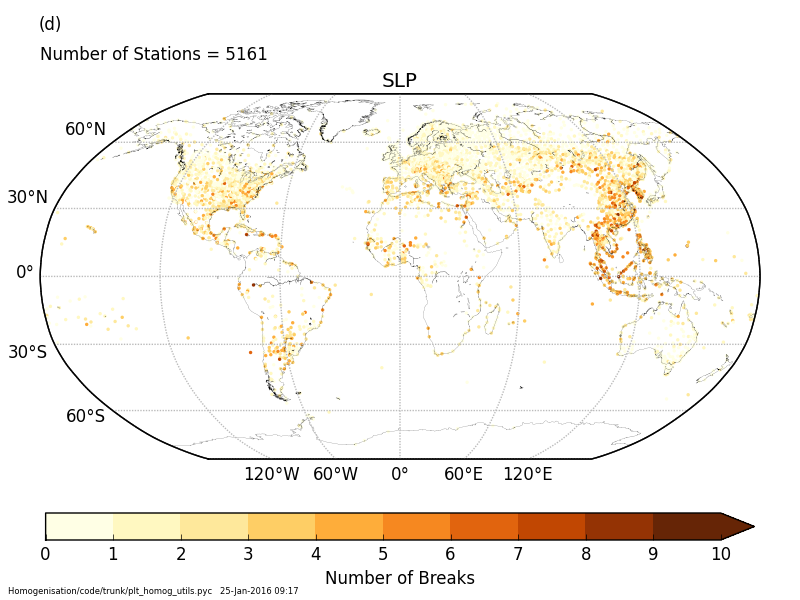
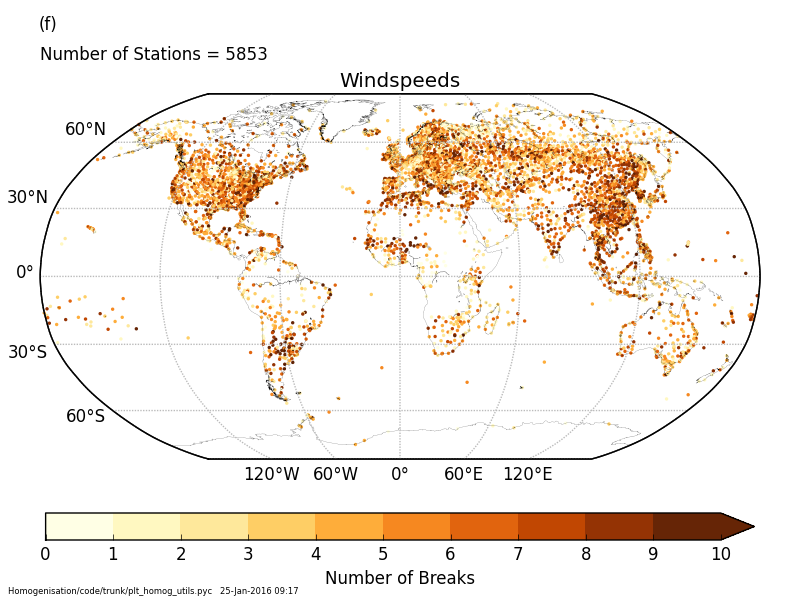
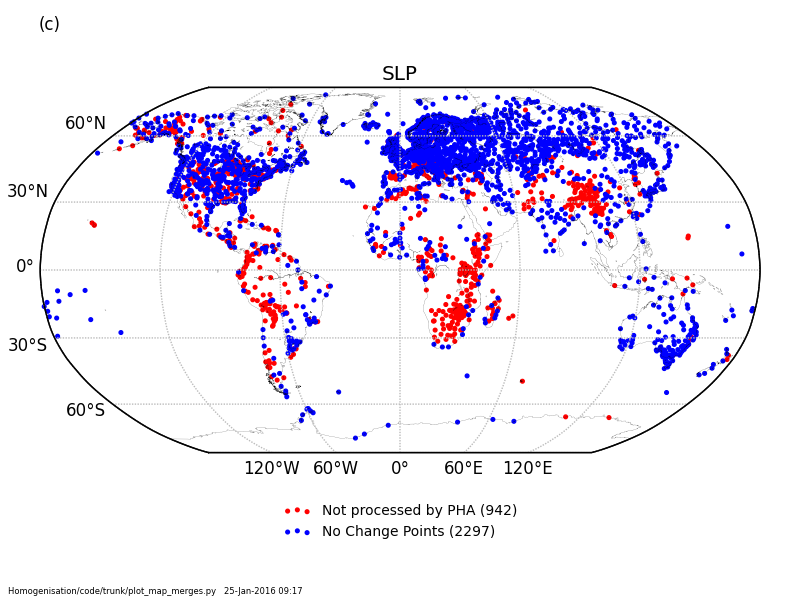
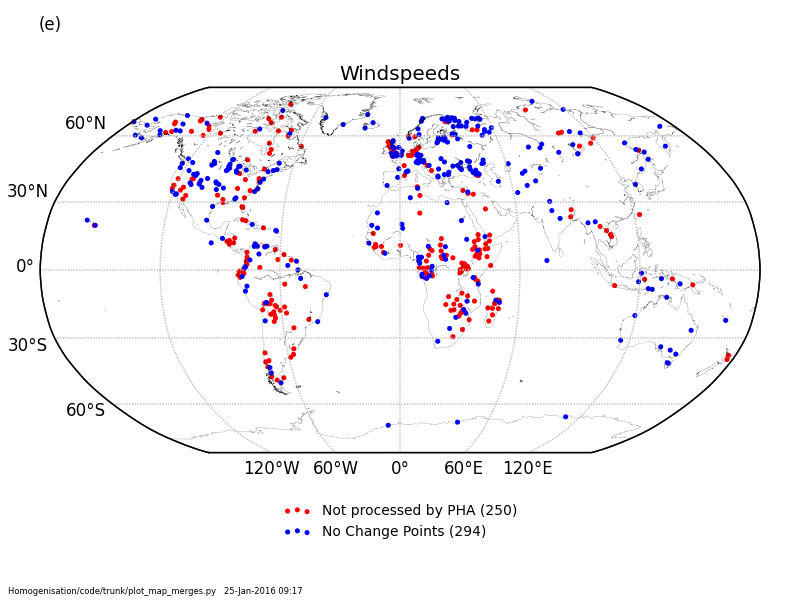
The homogeneity information for this version is available here - the list of breaks and also some of the graphical outputs. The columns of the datafiles give the Station ID, the date of the change point, and two break magnitudes (one in the case of SLP). The first is from the monthly mean value, and the second is from the monthly mean diurnal range (temperature & dewpoint temperatures) or monthly mean daily maximum (wind speed). Missing values are denoted by -99.99. Please get in touch if there are any queries.
| Description | Data file | Notes | |
|---|---|---|---|
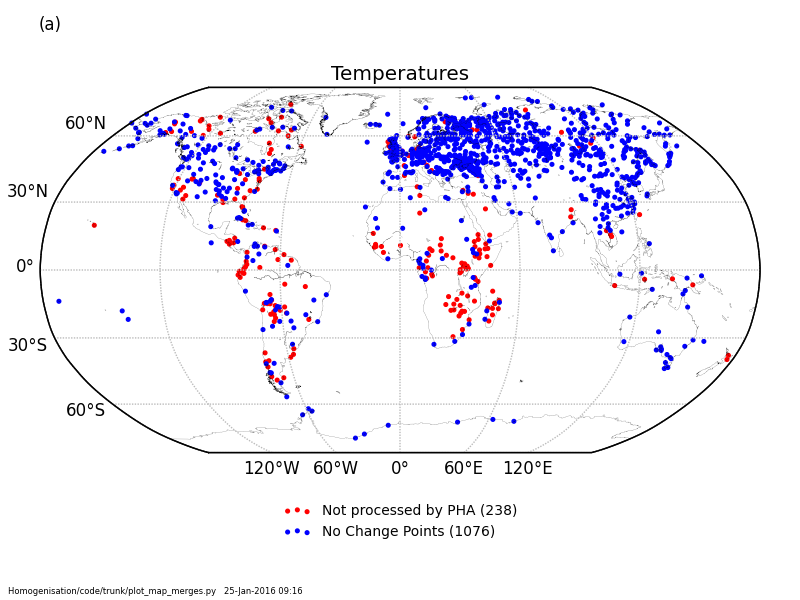
| Merged temperature inhomogeneities | MergedBreaks_temperatures.dat | ||
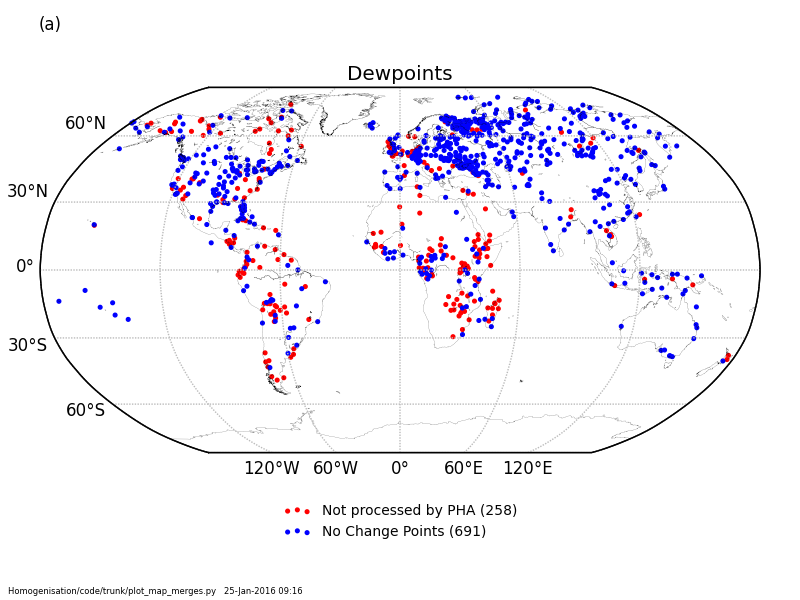
| Merged dewpoint inhomogeneities | MergedBreaks_dewpoints.dat | ||
| Merged SLP inhomogeneities | MergedBreaks_slp.dat | ||
| Merged windspeeds inhomogeneities | MergedBreaks_windspeeds.dat | ||
| Type | Temperature | Dewpoints | SLP | Windspeeds |
|---|---|---|---|---|
| Distribution - average | PHA_temperatures_average_distribution.png | PHA_dewpoints_average_distribution.png | PHA_slp_average_distribution.png | PHA_windspeeds_average_distribution.png |
| Distribution - DTR | PHA_temperatures_dtr_distribution.png | PHA_dewpoints_dtr_distribution.png | - | - |
| Distribution - max | - | - | - | PHA_windspeeds_max_distribution.png |
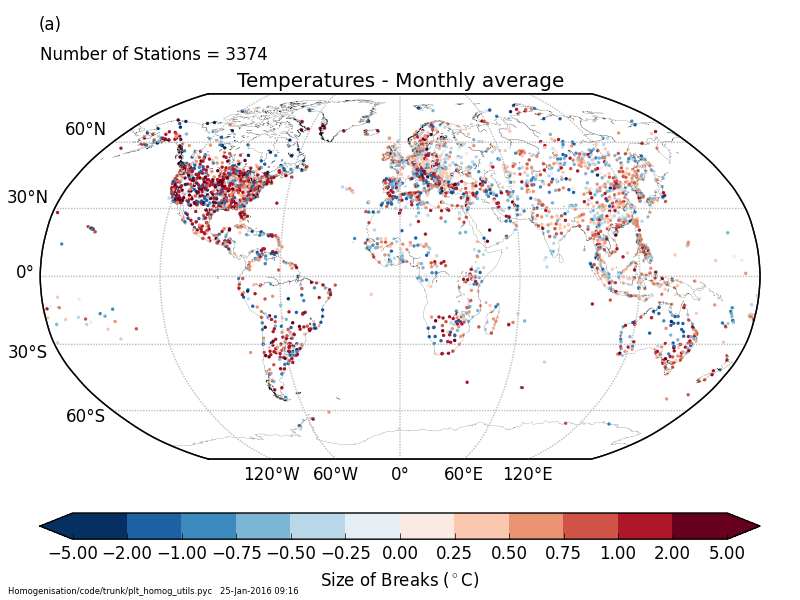
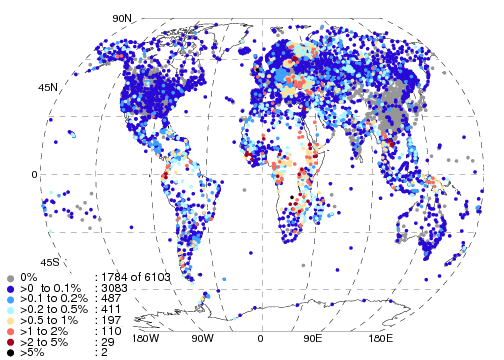
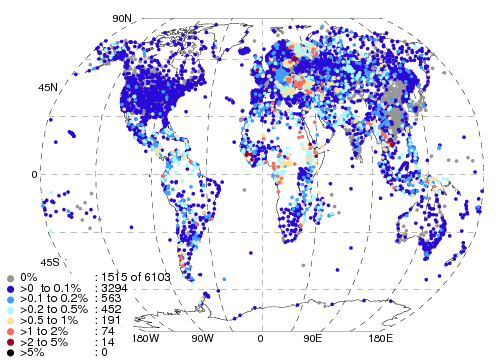
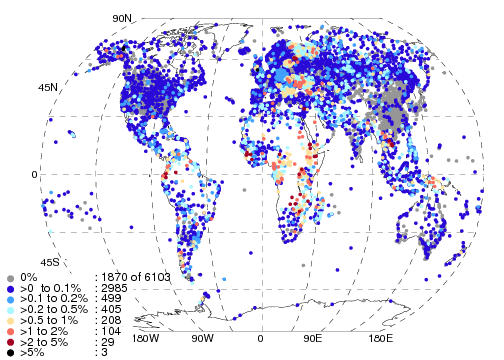
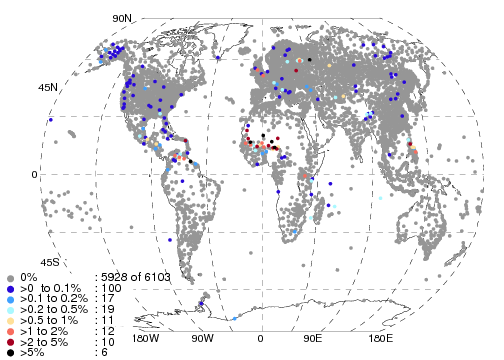
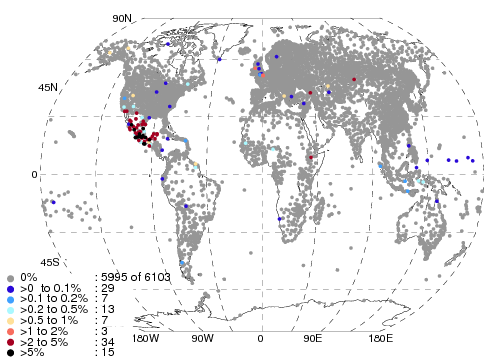
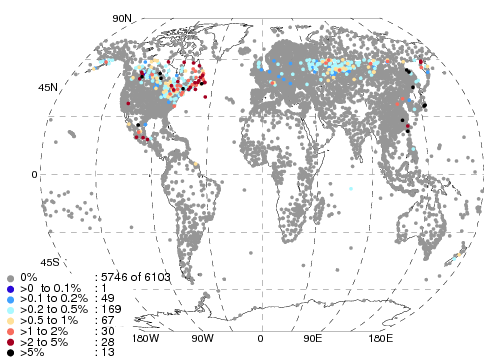
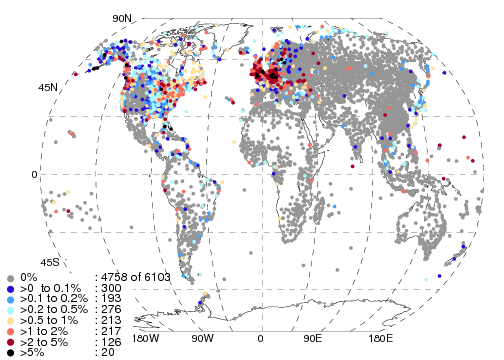
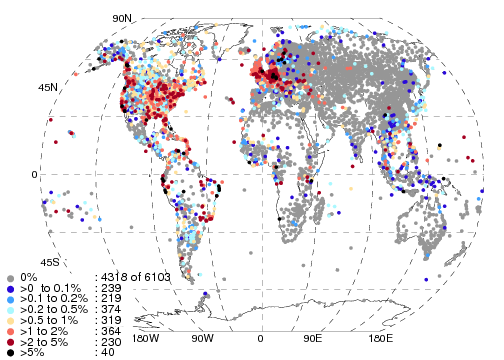
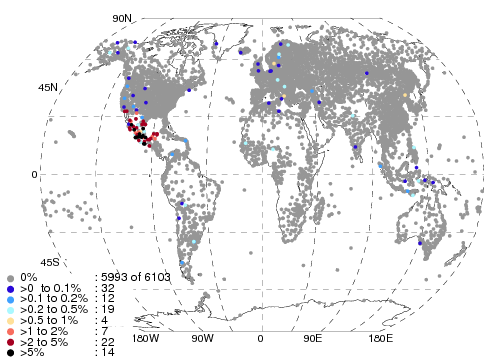
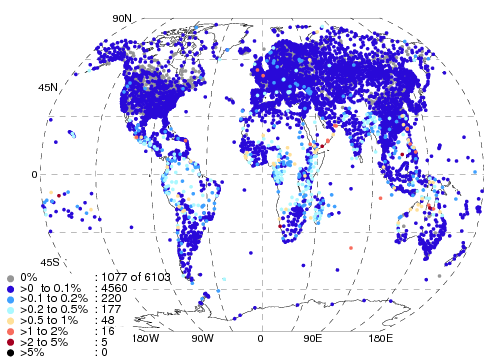
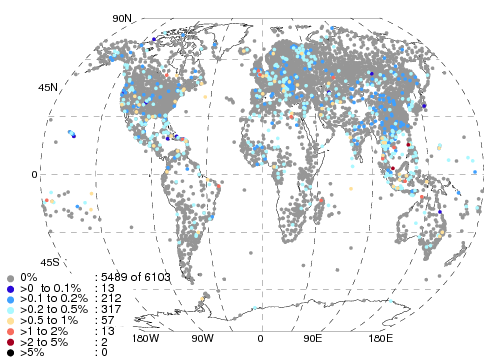
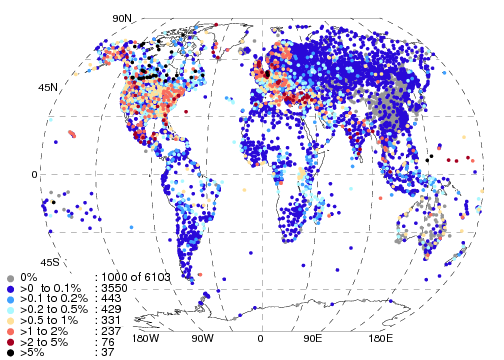
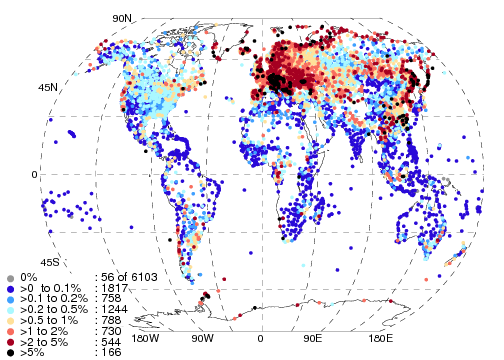
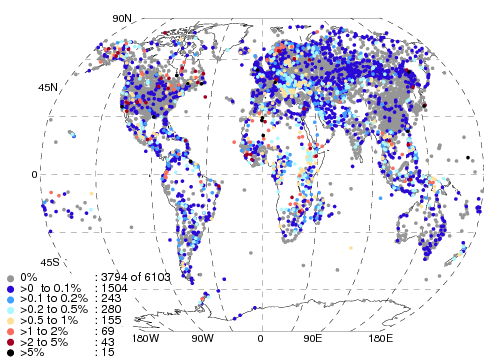
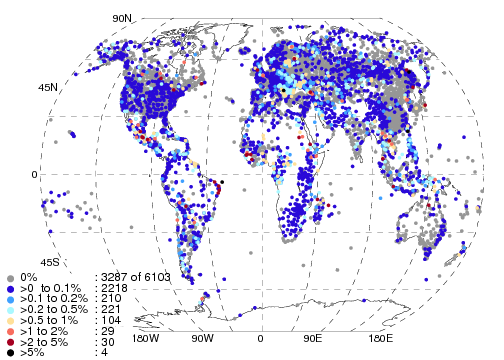
| Map - average - inhomogeneity size | break_size_map_temperatures_average.png | break_size_map_dewpoints_average.png | break_size_map_slp_average.png | break_size_map_windspeeds_average.png |
| Map - dtr - inhomogeneity size | break_size_map_temperatures_dtr.png | break_size_map_dewpoints_dtr.png | - | - |
| Map - max - inhomogeneity size | - | - | - | break_size_map_windspeeds_max.png |
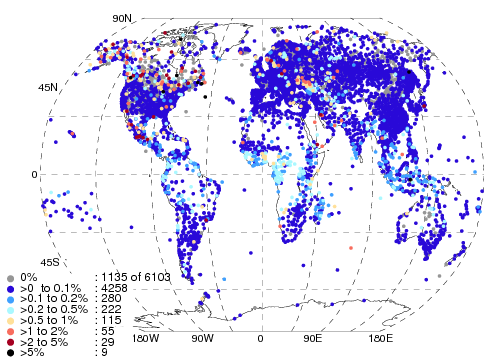
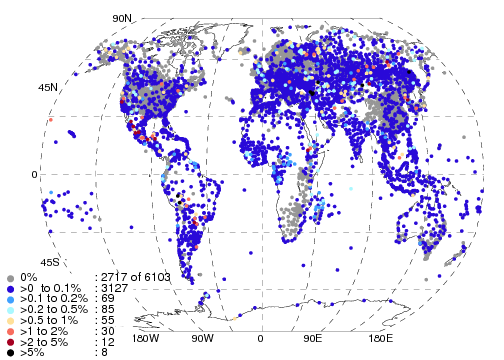
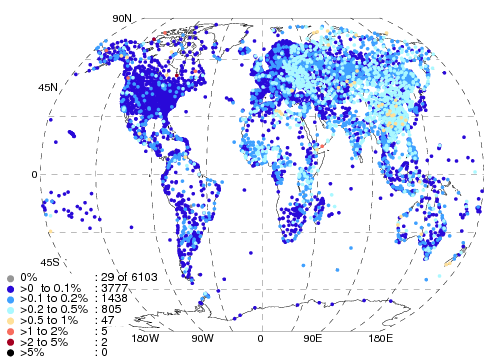
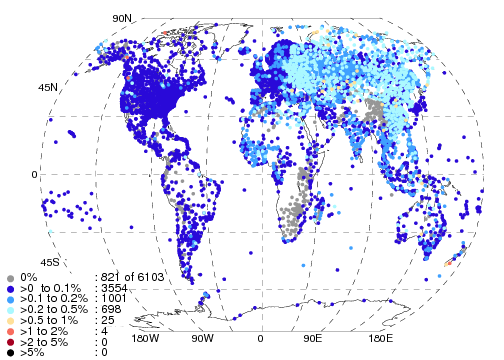
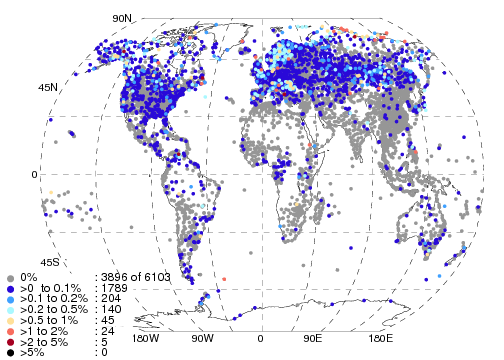
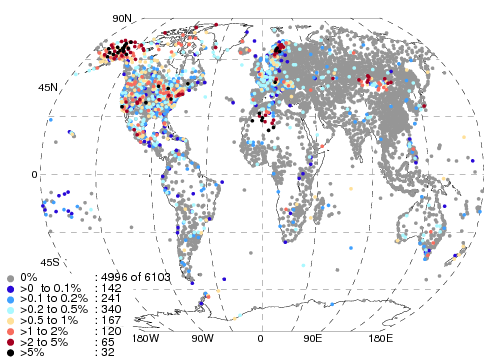
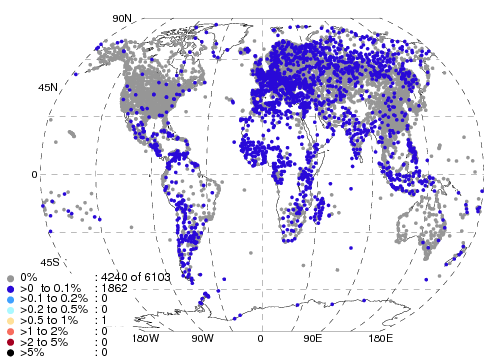
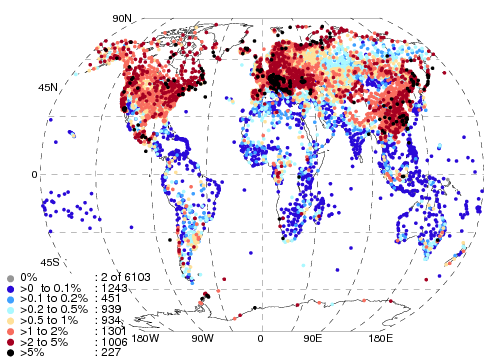
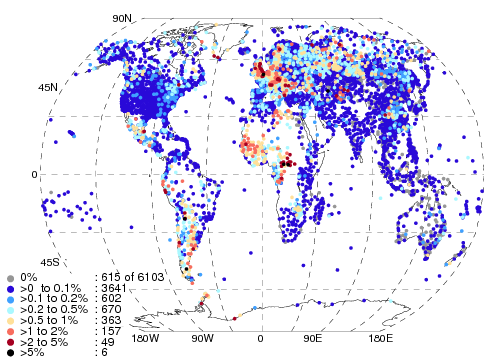
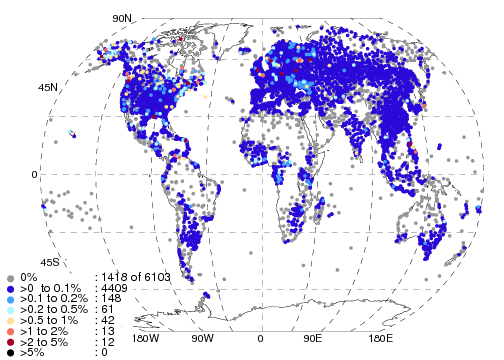
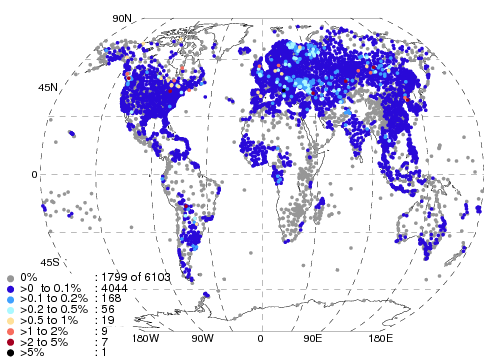
| Map - inhomogeneity number | break_number_map_temperatures.png | break_number_map_dewpoints.png | break_number_map_slp.png | break_number_map_windspeeds.png |
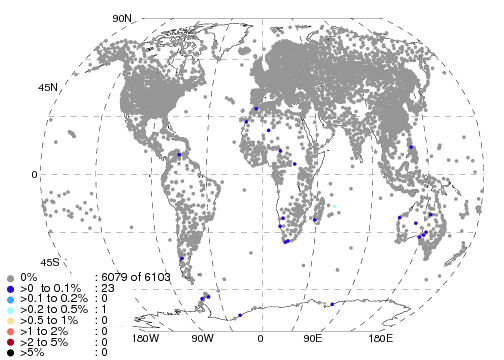
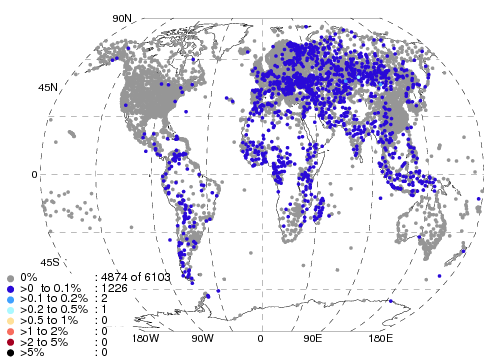
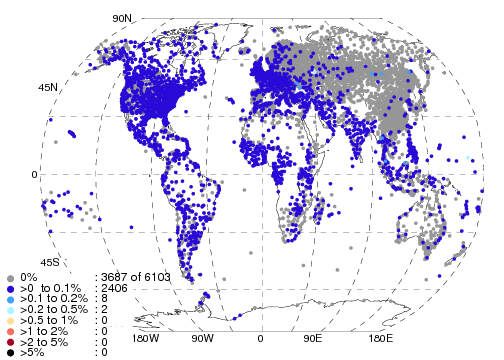
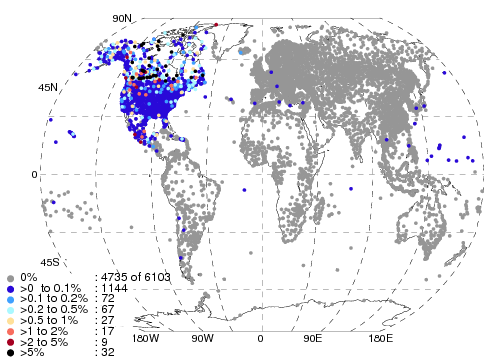
| Map - no inhomogeneities | zero_breaks_map_temperatures.png | zero_breaks_map_dewpoints.png | zero_breaks_map_slp.png | zero_breaks_map_windspeeds.png |
A number of files and plots are linked below which were used or generated when creating HadISD.
| Description | Subset | Data file | Notes |
|---|---|---|---|
| First Internal Checks | 1 | InternalLog1.txt | 1 |
| 2 | InternalLog2.txt | 1 | |
| 3 | InternalLog3.txt | 1 | |
| 4 | InternalLog4.txt | 1 | |
| First External Checks | ExternalLog.txt | ||
| First Masking Run | MaskingLog.txt | ||
| Second Internal Checks | 1 | InternalLog1_2.txt | 1 |
| 2 | InternalLog2_2.txt | 1 | |
| 3 | InternalLog3_2.txt | 1 | |
| 4 | InternalLog4_2.txt | 1 | |
| Second External Checks | ExternalLog_2.txt | ||
| Second Masking Run | MaskingLog_2.txt | ||
| First Internal Summary | qc_summary_internal.txt | 2 | |
| First External Summary | qc_summary_external.txt | 2 | |
| Second Internal Summary | qc_summary_internal2.txt | 2 | |
| Second External Summary | qc_summary_external2.txt | 2 | |
| Second Mask Summary | qc_summary_mask2.txt | 2 | |
| Description | Station Number | Data file | Notes |
| HadISD Station List | 6103 | hadisd_station_info_v104.txt | 3 |
| Full Station List | 6103 | kept_station_info.txt | 3 |
| Composite Stations | 943 | composites_sorted.txt | 4 |
| Duplicated Stations | 83 | final_remove_dups_MAY09.txt | |
| No neighbours to do comparison check | 704 | no_neighbour_checks.txt | |
| Spurious Stations - noted in the QC | spurious_stations.txt | ||
| Expert Stations | 73 | expert_stations.txt | |
| Checked Composite Stations | 20 | checked_composites.dat | |
| Final Thinning - Accepted stations | 4206 | accept_20_1980_2000_12_24_3_3_20_5pc.txt | |
| Final Thinning - Rejected stations | 1897 | reject_20_1980_2000_12_24_3_3_20_5pc.txt | |
| User Identified erroneous data | user_identified_bad_stations.txt | 9 January 2013 | |
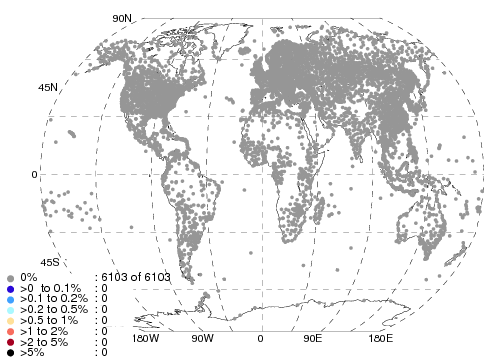
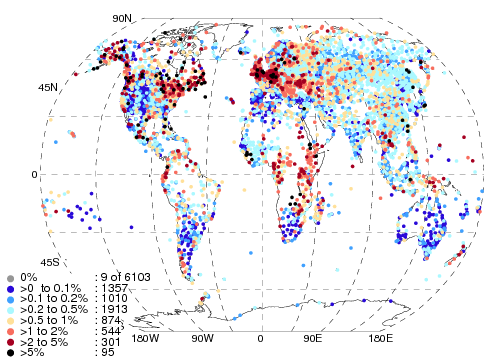
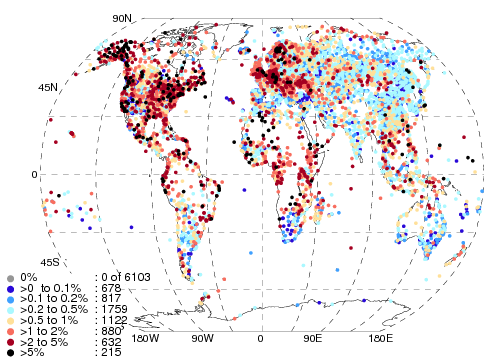
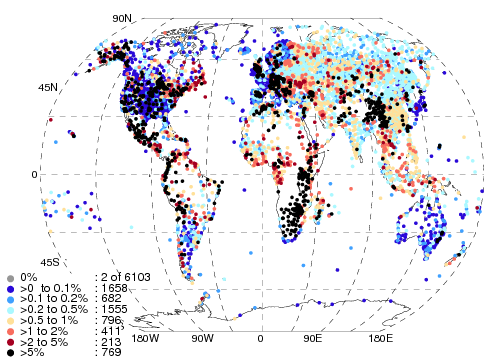
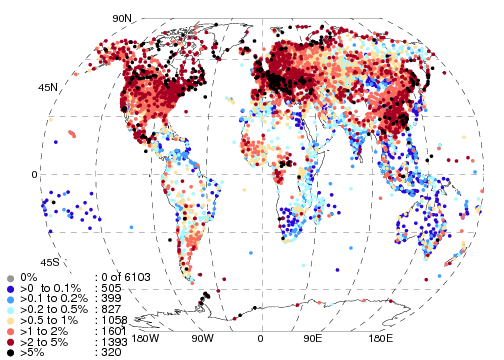
| Number of stations with a failures from a certain test in percentage bins | all_fails_summary_20160118.dat | 5 | |
| As above but for non-composite stations | all_fails_summary_20160118_non_comp.dat | ||
| As above but for composite stations | all_fails_summary_20160118_comp.dat | ||
| Test 3-letter code descriptor | tests_codes.txt | ||
| Test | Variable | PostScript | PNG |
|---|---|---|---|
| Duplicate months | All | eps | png |
| Odd Cluster | Temperatures | eps | png |
| Odd Cluster | Dew Points | eps | png |
| Odd Cluster | SLP | eps | png |
| Odd Cluster | Wind Speed | eps | png |
| Frequent Value Check | Temperature | eps | png |
| Frequent Values | Dew point | eps | png |
| Frequent Values | SLP | eps | png |
| Diurnal Cycle Check | All | eps | png |
| Gap Check | Temperature | eps | png |
| Gap Check | Dew point | eps | png |
| Gap Check | SLP | eps | png |
| Record Check | Temperature | eps | png |
| Record Check | Dew point | eps | png |
| Record Check | SLP | eps | png |
| Record Check | Wind Speed | eps | png |
| Day Strings | Temperature | eps | png |
| Day Strings | Dew point | eps | png |
| Day Strings | SLP | eps | png |
| Day Strings | Wind Speed | eps | png |
| Straight Strings | Temperature | eps | png |
| Straight Strings | Dew point | eps | png |
| Straight Strings | SLP | eps | png |
| Straight Strings | Wind Speed | eps | png |
| Hour Strings | Temperature | eps | png |
| Hour Strings | Dew point | eps | png |
| Hour Strings | SLP | eps | png |
| Hour Strings | Wind Speed | eps | png |
| All temperature strings | Temperature | eps | png |
| All dewpoint strings | Dew point | eps | png |
| All SLP strings | SLP | eps | png |
| All wind strings | Wind Speed | eps | png |
| Climatological Check | Temperature | eps | png |
| Climatological Check | Dew point | eps | png |
| Climatological Check | SLP | eps | png |
| Spike Check | Temperature | eps | png |
| Spike Check | Dew point | eps | png |
| Spike Check | SLP | eps | png |
| Supersaturation | Dew point | eps | png |
| Dew point depression | Dew point | eps | png |
| Dew point Cut Off | Dew point | eps | png |
| Variance Check | Temperature | eps | png |
| Variance Check | Dew point | eps | png |
| Variance Checks | SLP | eps | png |
| Cloud Total | Low,Mid,High,Total | eps | png |
| Unobservable | High Cloud | eps | png |
| Unobservable | Low Cloud | eps | png |
| Unobservable | Mid Cloud | eps | png |
| Unobservable | Total Cloud | eps | png |
| Full Low cloud check | Mid & High Cloud | eps | png |
| Full Mid cloud check | High Cloud | eps | png |
| Negative cloud value | All Cloud | eps | png |
| Neighbour Outlier | Temperature | eps | png |
| Neighbour Outlier | Dew point | eps | png |
| Neighbour Outlier | SLP | eps | png |
| Month cleared | Temperature | eps | png |
| Month cleared | Dew point | eps | png |
| Month cleared | SLP | eps | png |
| Month Cleared | Wind Speed | eps | png |
| Month cleared | Wind Direction | eps | png |
| Month cleared | Total cloud | eps | png |
| Month cleared | High Cloud | eps | png |
| Month cleared | Mid Cloud | eps | png |
| Month cleared | Low Cloud | eps | png |
| Month cleared | Cloud Base | eps | png |
| All | Temperature | eps | png |
| All | Dew point | eps | png |
| All | SLP | eps | png |
| All | Cloud | eps | png |
Notes
[1] The internal checks were run as 4 separate IDL process, and so
there are 4 separate log files, each covering 1/4 of the stations.
[3] You will need the test_codes.txt to interpret
these outputs
[3] Station ID, latitude, longitude and elevation used.
[4] First ID in the line is the station ID used throughout the
processing. The remainder are ones which were composited into this
station record.
[5] Table 6 in the paper was created from this
file. And you will need the test_codes.txt file to interpret these outputs.
|
Maintained by: Robert Dunn |
© Crown Copyright |