
Maintained by: Robert Dunn
Last updated: 23/03/2016 Expires: 22/03/2017
Hosted by: Met Office Hadley Centre
© Crown Copyright
| Met Office Hadley Centre observations datasets |
| > Home > HadISD > 2.0.2.2017f > Online Material > |
Please read the Geoscientific Instrumentation, Methods & Data Systems and Climate of the Past I and II papers before using the material presented here.
The netCDF headers are listed below with some information as to what they contain.
| Field Name | Long Name | Units | |
|---|---|---|---|
| time | Time | Hours since 1-1-1931 00:00UT | |
| input_station_id | Primary source for timestep data | ||
| temperatures | C | ||
| dewpoints | C | ||
| total_cloud_cover | oktas | ||
| low_cloud_cover | oktas | ||
| mid_cloud_cover | oktas | ||
| high_cloud_cover | oktas | ||
| cloud_base | m | ||
| windspeeds | m/s | ||
| winddirs | degree | ||
| wind gust | m/s | ||
| slp | sea-level pressure | hPa | |
| past_sigwx1 | Past significant weather code | ||
| precip1_depth | Depth of Precipitation from first ISD field | mm | |
| precip1_period | Precipitation Accumulation Period for first ISD field | hr | |
| qc_flags | Quality control flags | ||
| flagged_values | Removed values (T, D, S, TC, LC, MC, HC, WS, WD) | ||
Precipitation in HadISD: For users wishing to use the precipitation information available in HadISD, we ask them to take care and familiarise themselves with both the HadISD and the ISD documentation. The precip1_depth field derives from the first ISD precipitation field, and must be used with the precip1_period field, as the "1" in the name does not refer to hourly accumulations. Also, despite the time dimension being in hours, the precipitation accumulations may refer to longer time periods, detailed in precip1_period. Furthermore, we note here that the precipitation depths have not been quality controlled and users should confirm for themselves that the data are sufficiently free of erroneous measurements for their purposes (RJHD 26-February 2018).
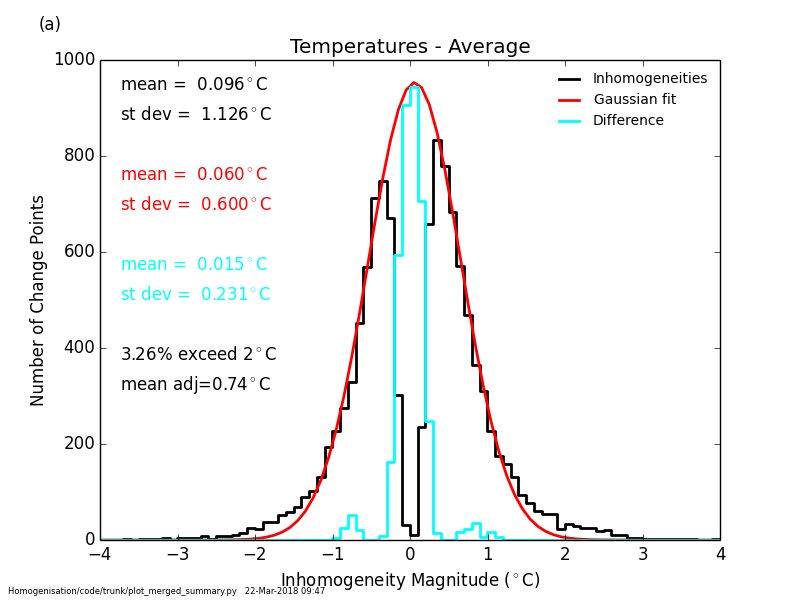
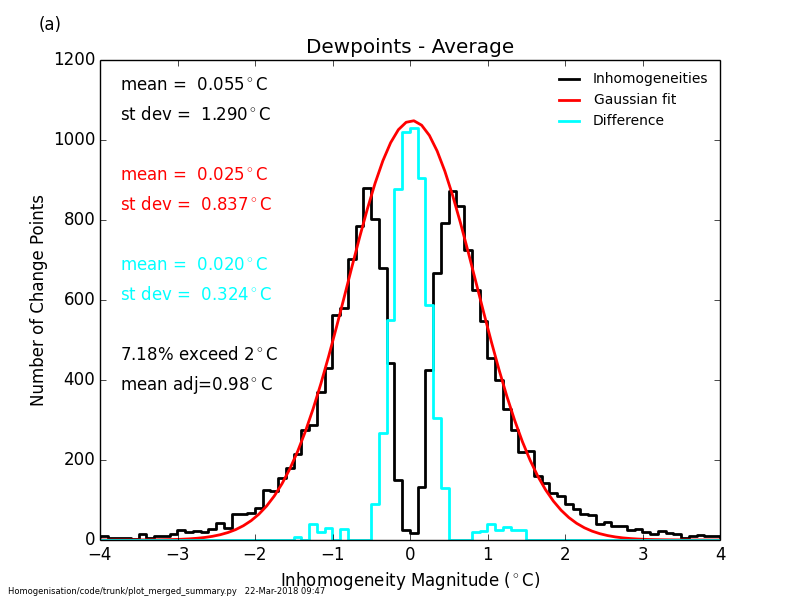
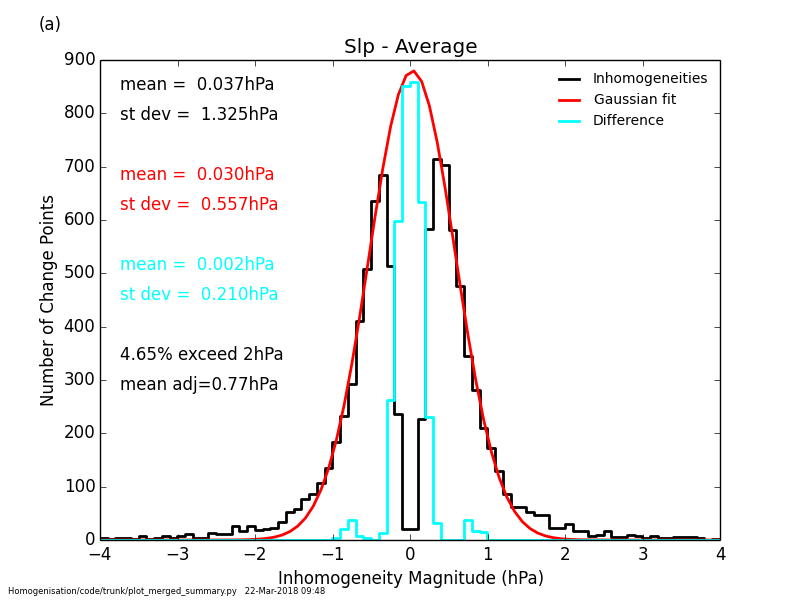
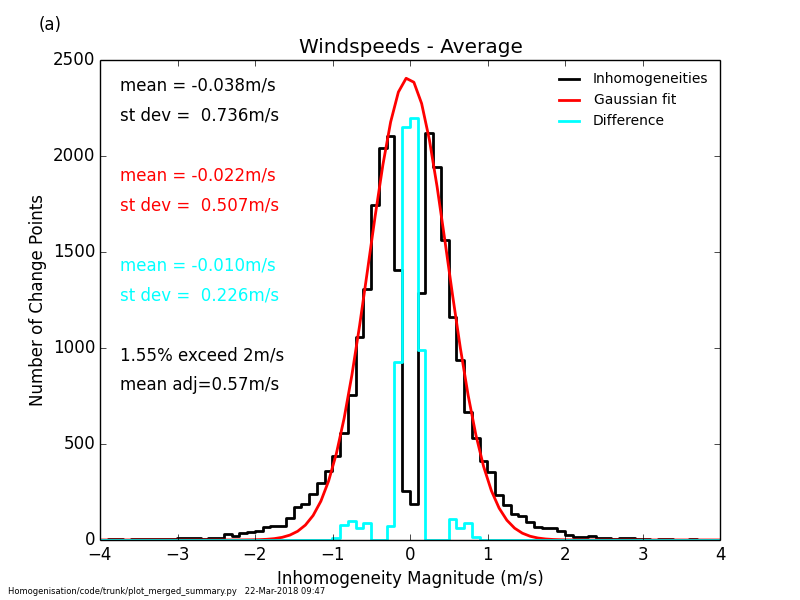
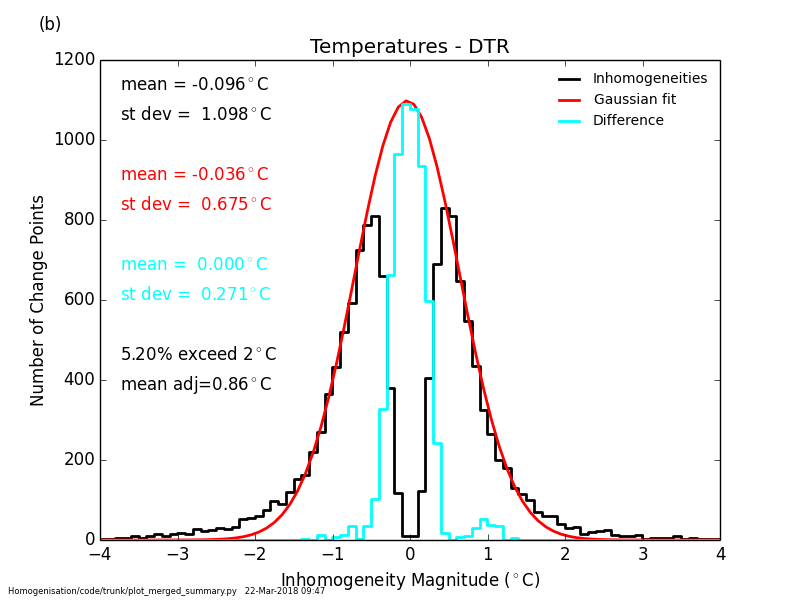
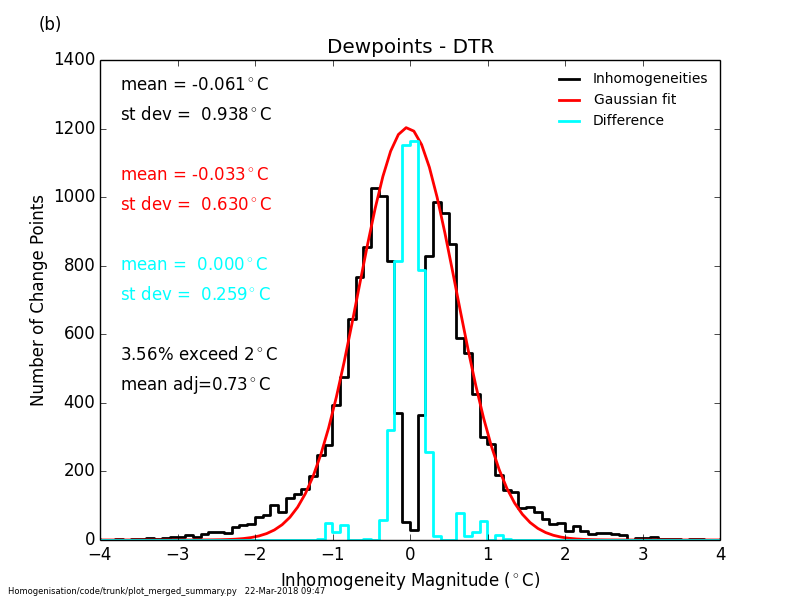
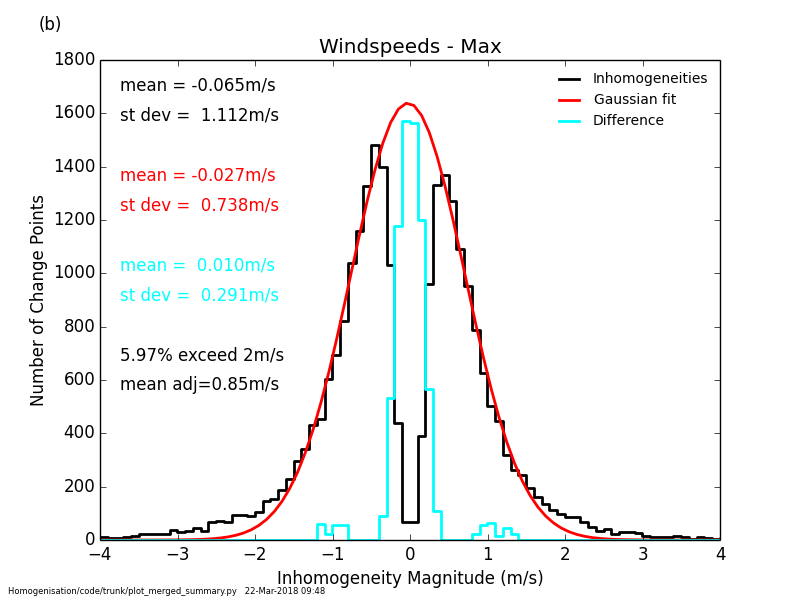
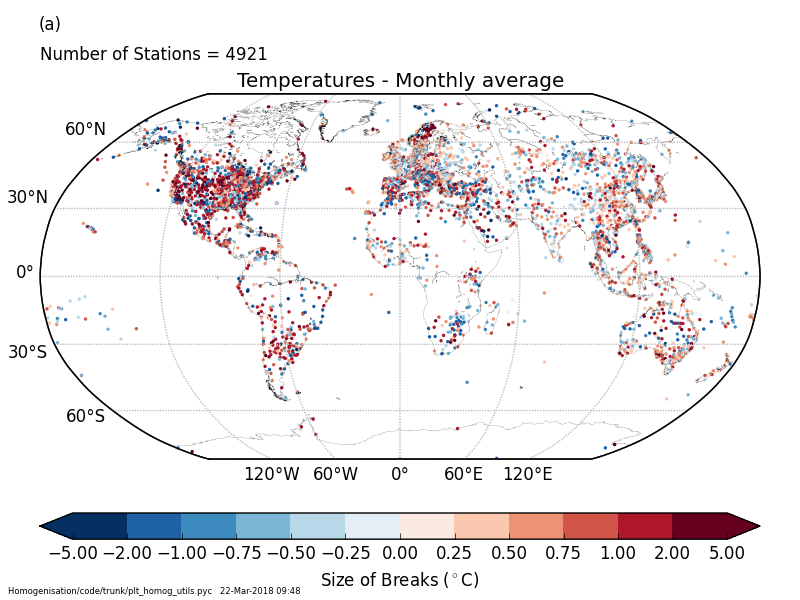
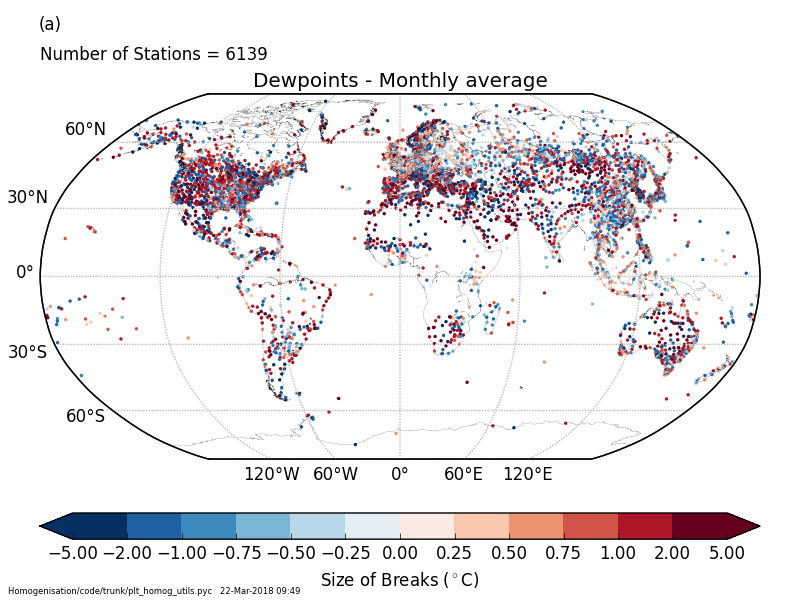
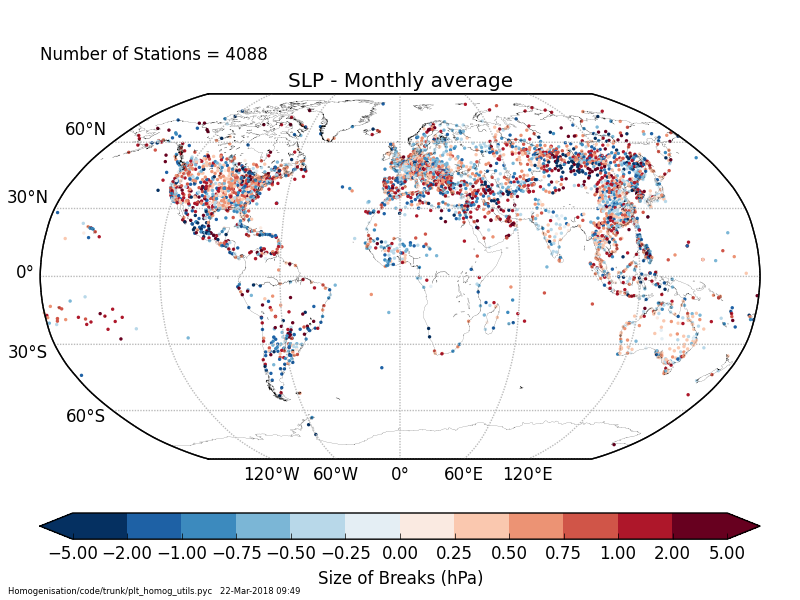
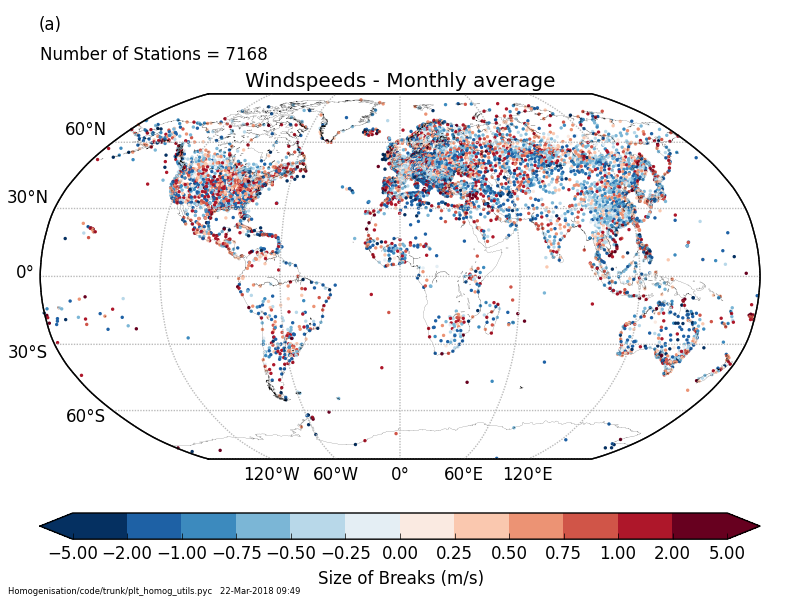
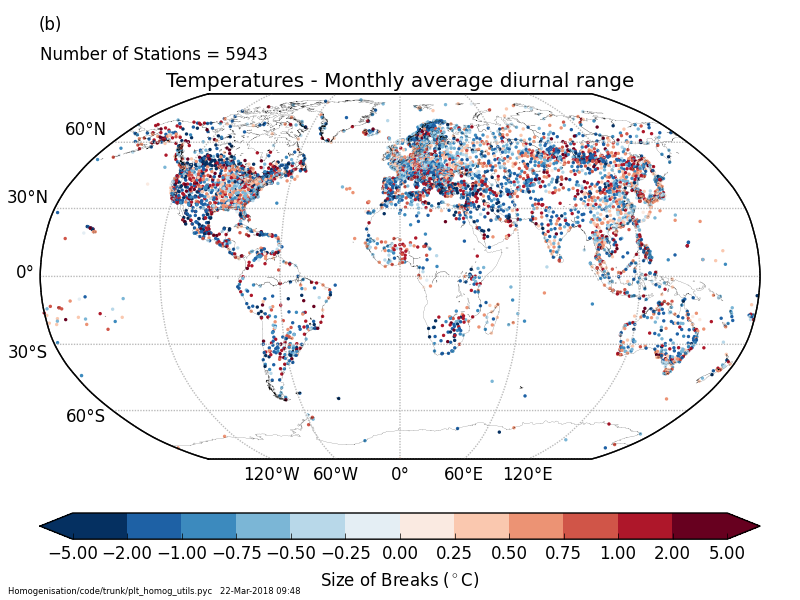
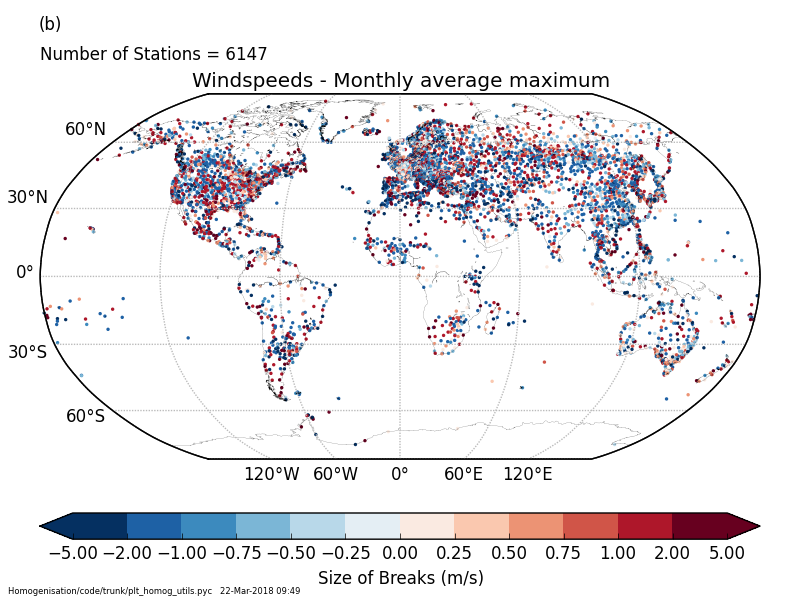
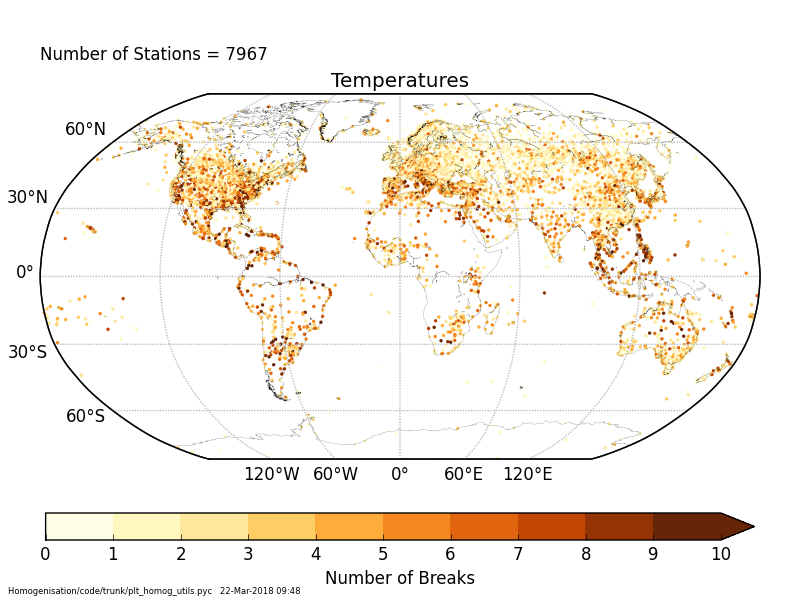
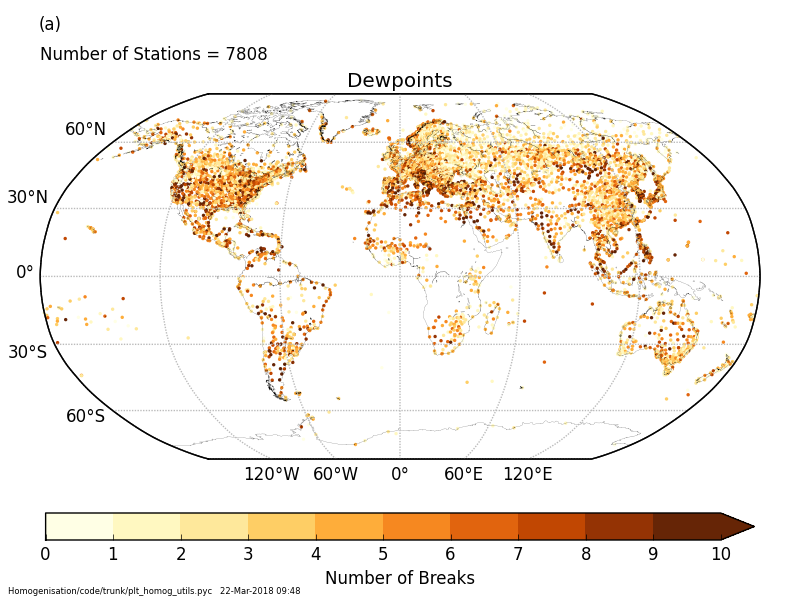
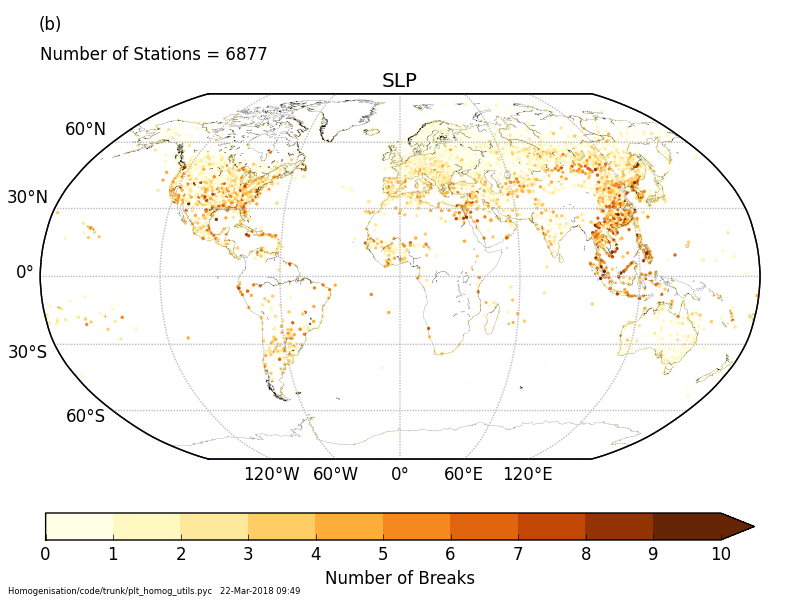
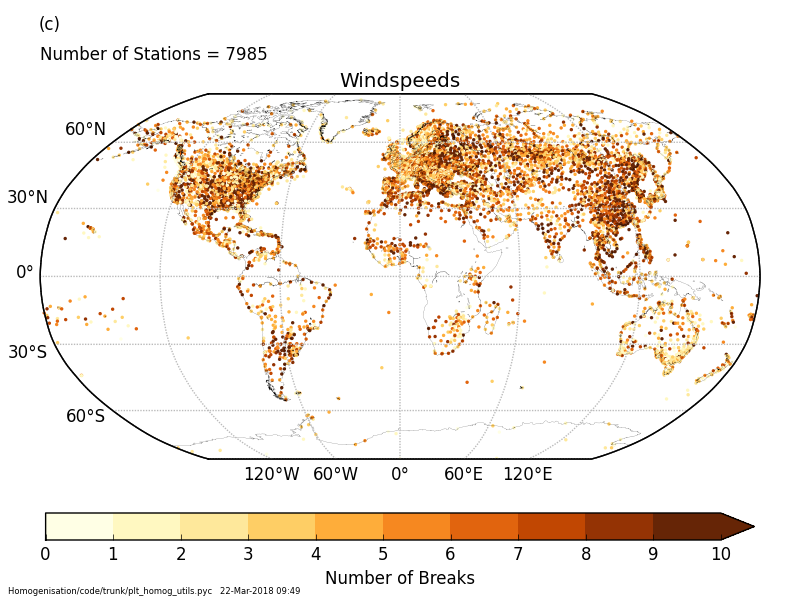
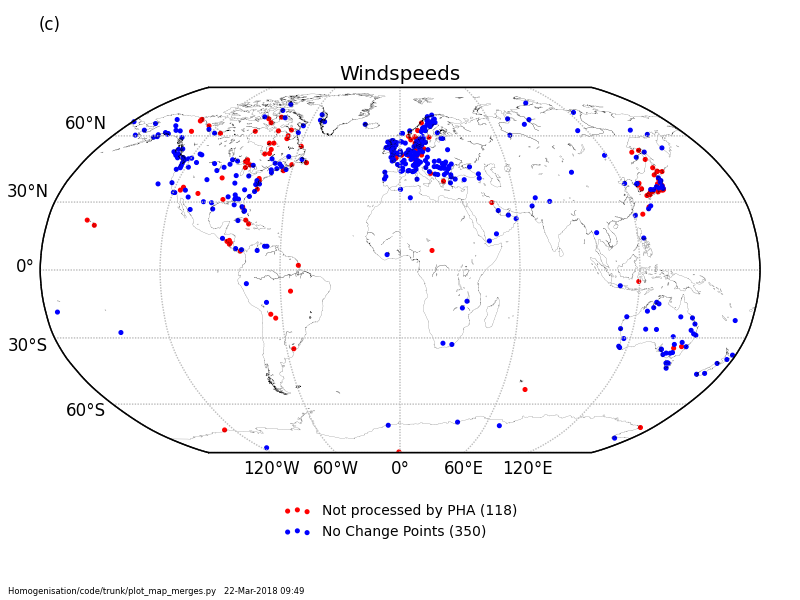
The homogeneity information for this version is available here - the list of breaks and also some of the graphical outputs. The columns of the datafiles give the Station ID, the date of the change point, and two break magnitudes (one in the case of SLP). The first is from the monthly mean value, and the second is from the monthly mean diurnal range (temperature & dewpoint temperatures) or monthly mean daily maximum (wind speed). Missing values are denoted by -99.99. Please get in touch if there are any queries.
The inhomogeneity information has been calculated presuming the most recent period of a station is accurate and hence tranversing the timeseriers backwards in time. Therefore a negative in homogeneity value given indicates that prior to the month given, the data is at a lower value (so the adjustment required would be positive). Conversely, a positive vaue indicates that prior to the month given the data is at a higher value (a negative adjustment required).
| Description | Data file | Notes | |
|---|---|---|---|
| Merged temperature inhomogeneities | MergedBreaks_temperatures.dat | ||
| Merged dewpoint inhomogeneities | MergedBreaks_dewpoints.dat | ||
| Merged SLP inhomogeneities | MergedBreaks_slp.dat | ||
| Merged windspeeds inhomogeneities | MergedBreaks_windspeeds.dat | ||
| Type | Temperature | Dewpoints | SLP | Windspeeds |
|---|---|---|---|---|
| Distribution - average | PHA_temperatures_average_distribution.png | PHA_dewpoints_average_distribution.png | PHA_slp_average_distribution.png | PHA_windspeeds_average_distribution.png |
| Distribution - DTR | PHA_temperatures_dtr_distribution.png | PHA_dewpoints_dtr_distribution.png | - | - |
| Distribution - max | - | - | - | PHA_windspeeds_max_distribution.png |
| Map - average - inhomogeneity size | break_size_map_temperatures_average.png | break_size_map_dewpoints_average.png | break_size_map_slp_average.png | break_size_map_windspeeds_average.png |
| Map - dtr - inhomogeneity size | break_size_map_temperatures_dtr.png | break_size_map_dewpoints_dtr.png | - | - |
| Map - max - inhomogeneity size | - | - | - | break_size_map_windspeeds_max.png |
| Map - inhomogeneity number | break_number_map_temperatures.png | break_number_map_dewpoints.png | break_number_map_slp.png | break_number_map_windspeeds.png |
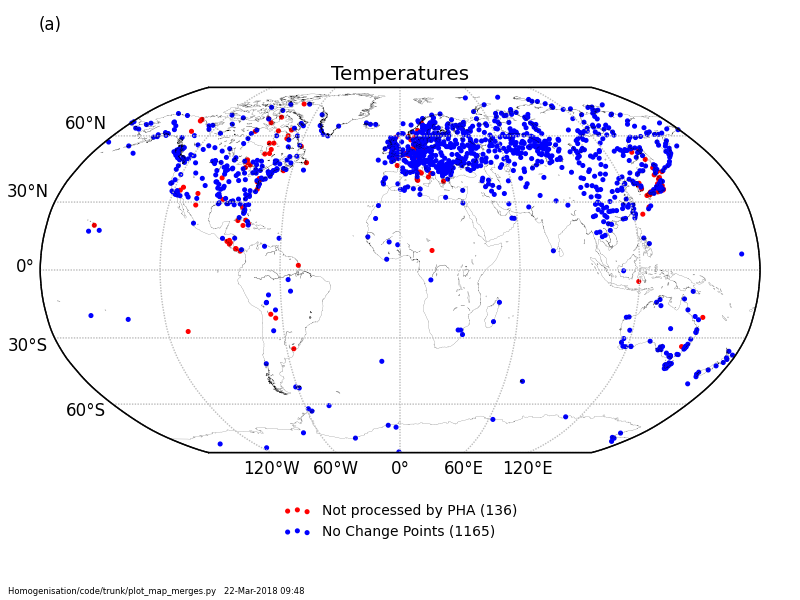
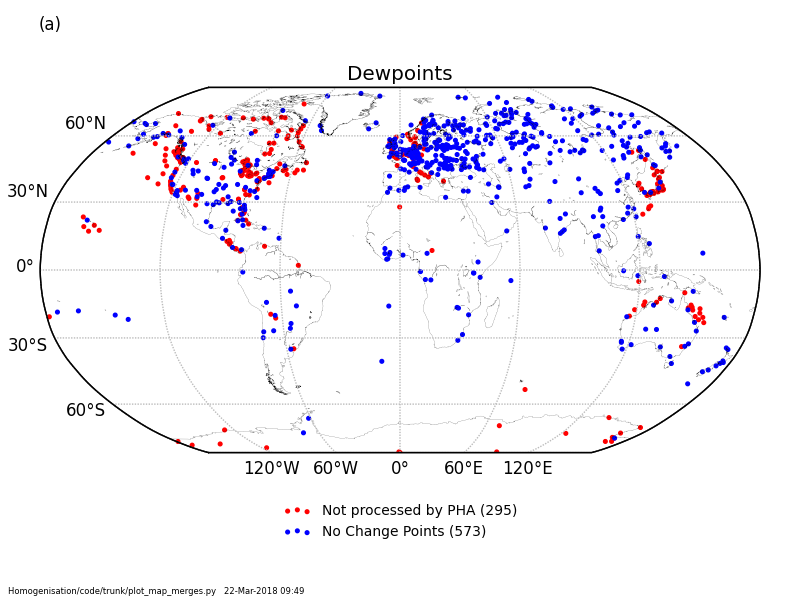
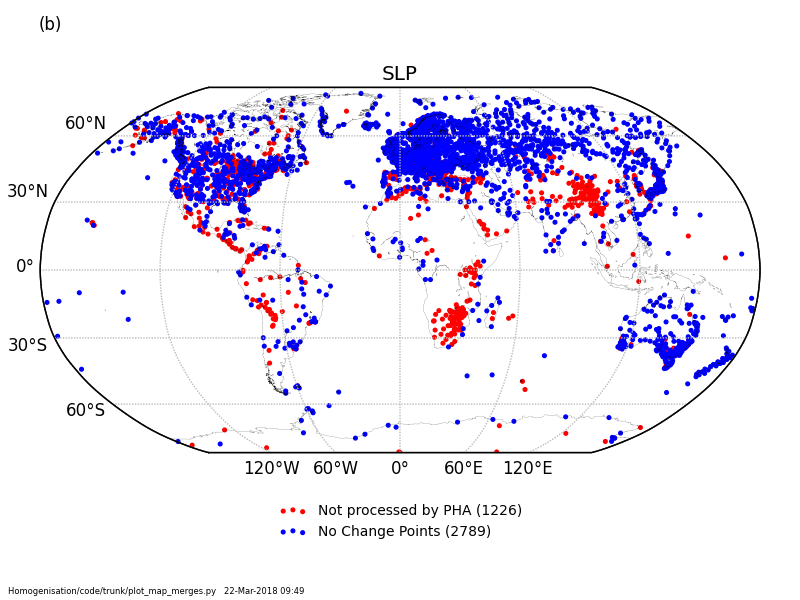
| Map - no inhomogeneities | zero_breaks_map_temperatures.png | zero_breaks_map_dewpoints.png | zero_breaks_map_slp.png | zero_breaks_map_windspeeds.png |
A number of files and plots are linked below which were used or generated when creating HadISD.
| Description | Station Number | Data file | Notes |
|---|---|---|---|
| HadISD Station List | 8103 | hadisd_station_info_v202.txt | 1 |
| HadISD Station Additions | 241 | hadisd_station_additions_v202.txt | |
| HadISD Station Removals | 15 | hadisd_station_removals_v202.txt | |
| Composite Stations | 2111 | final_mergers.txt | 2 |
| User Identified erroneous data | |||
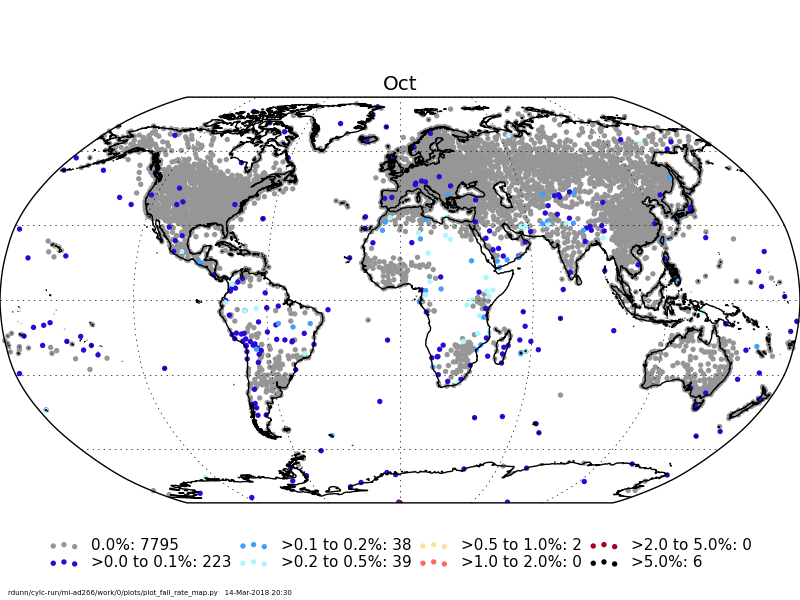
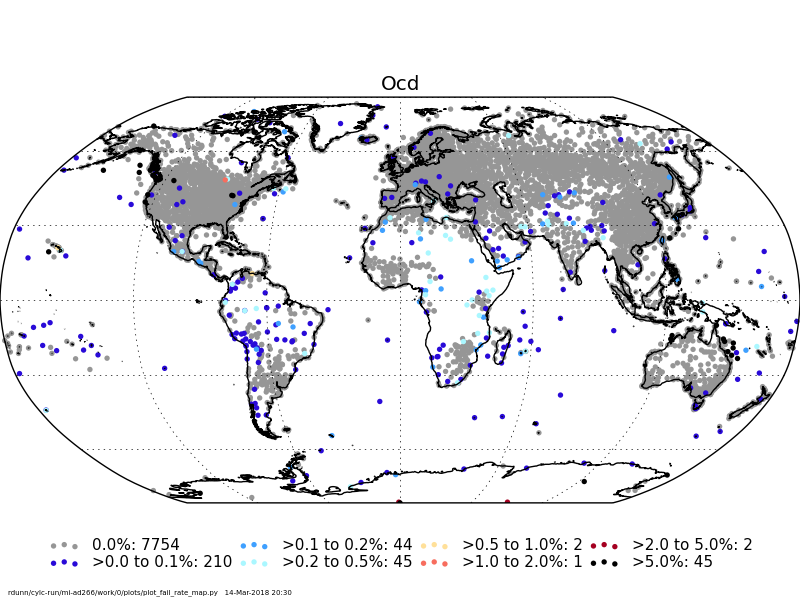
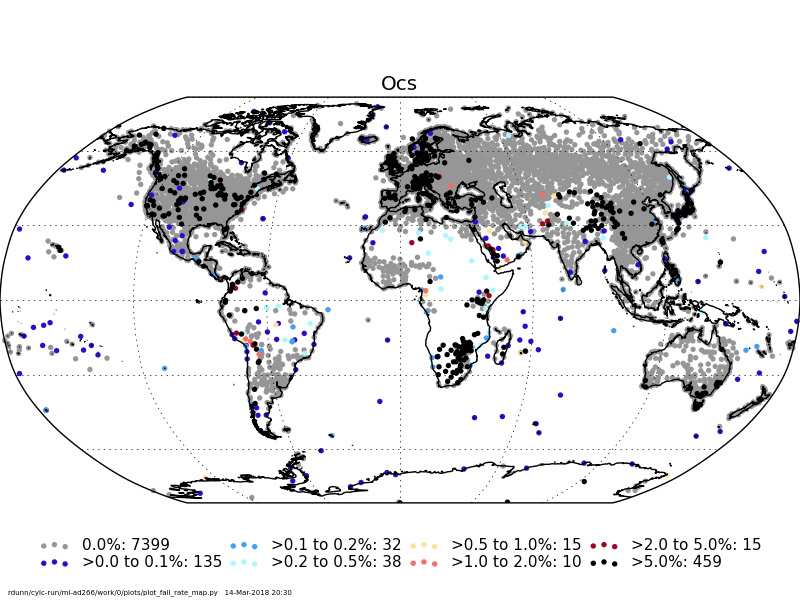
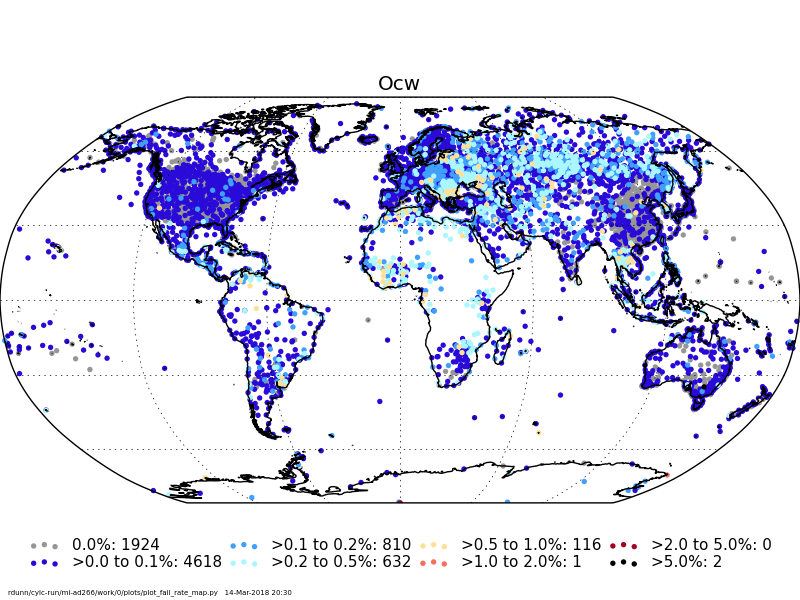
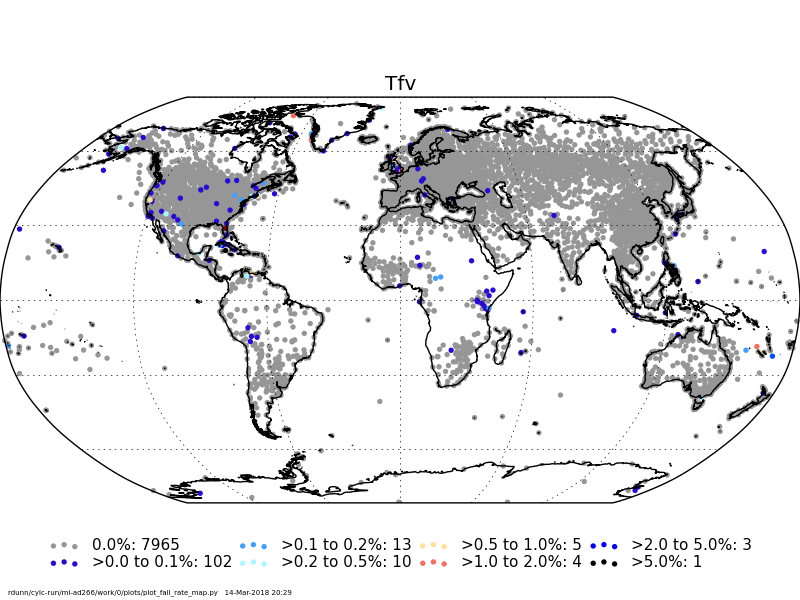
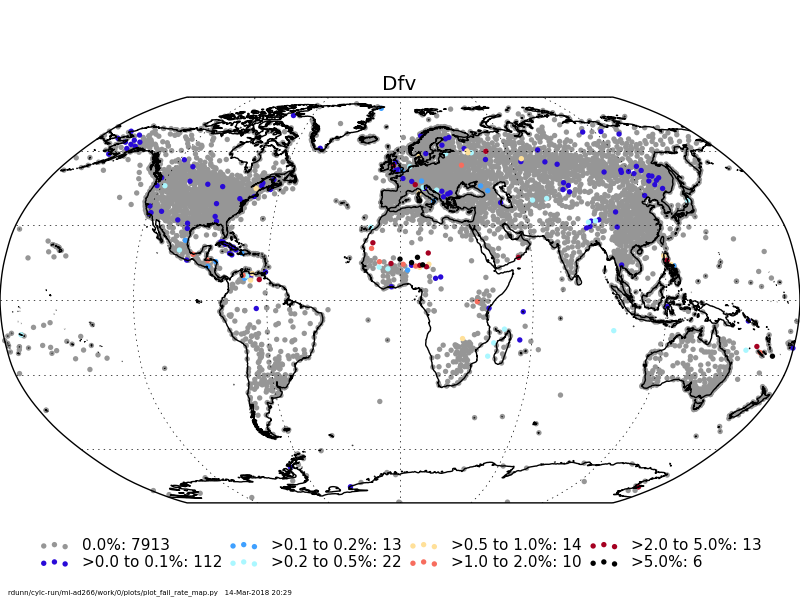
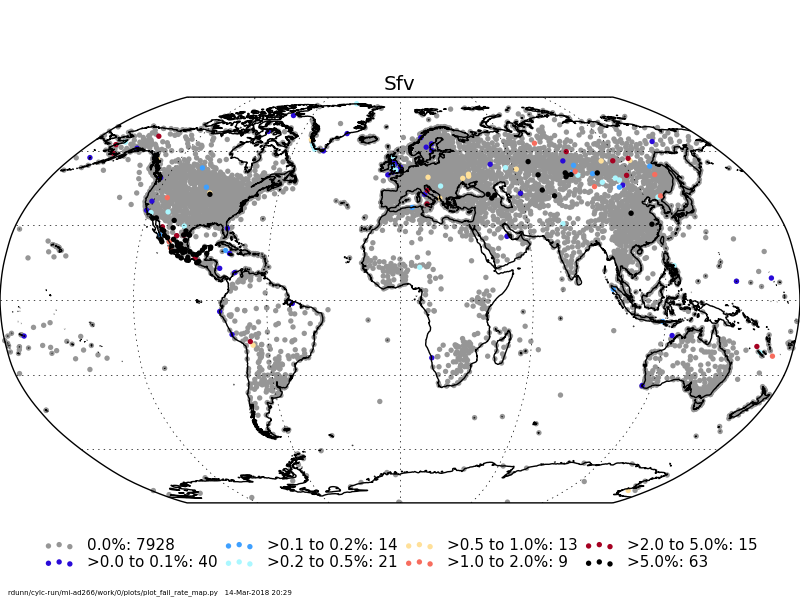
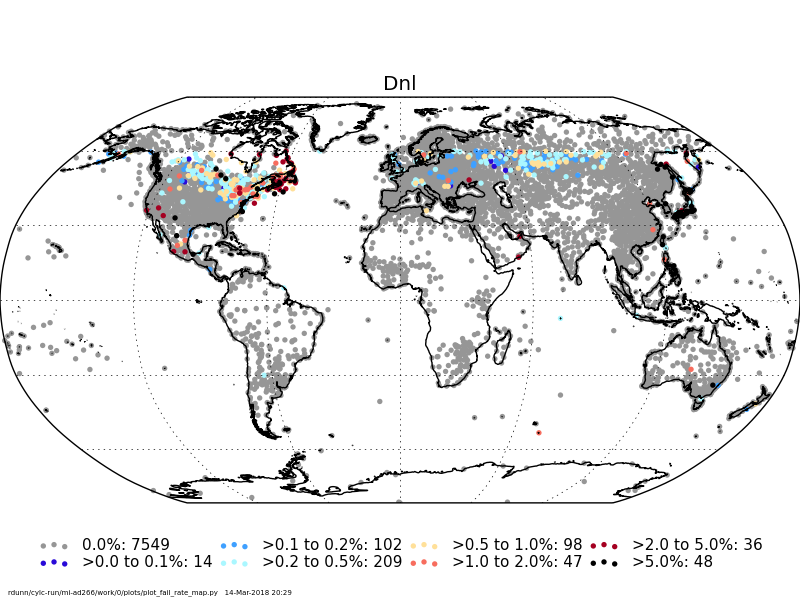
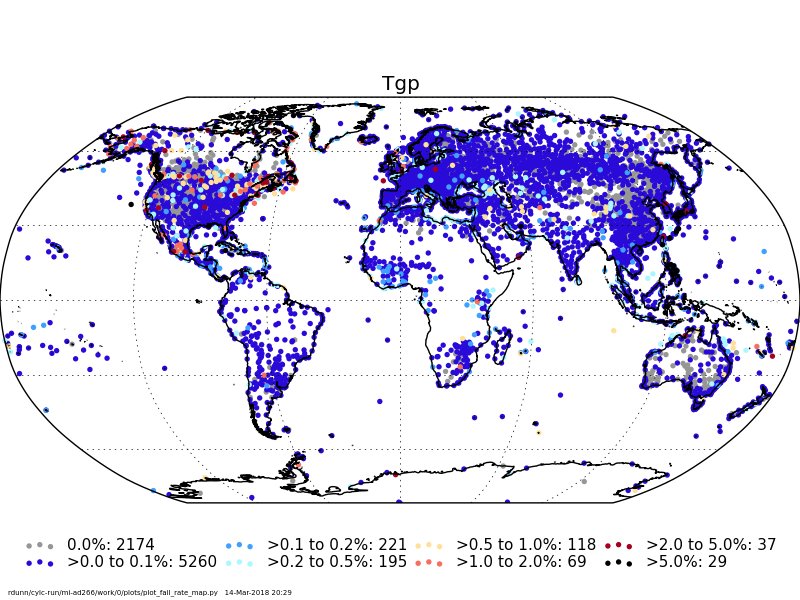
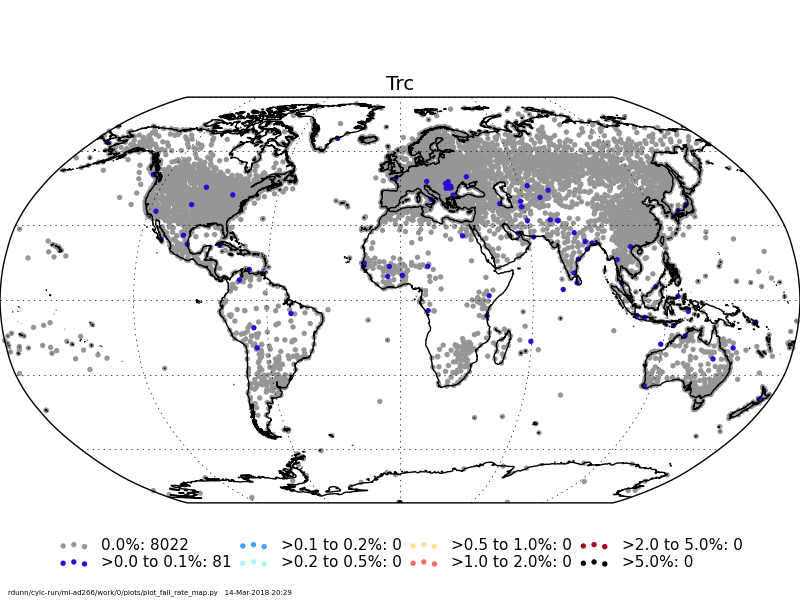
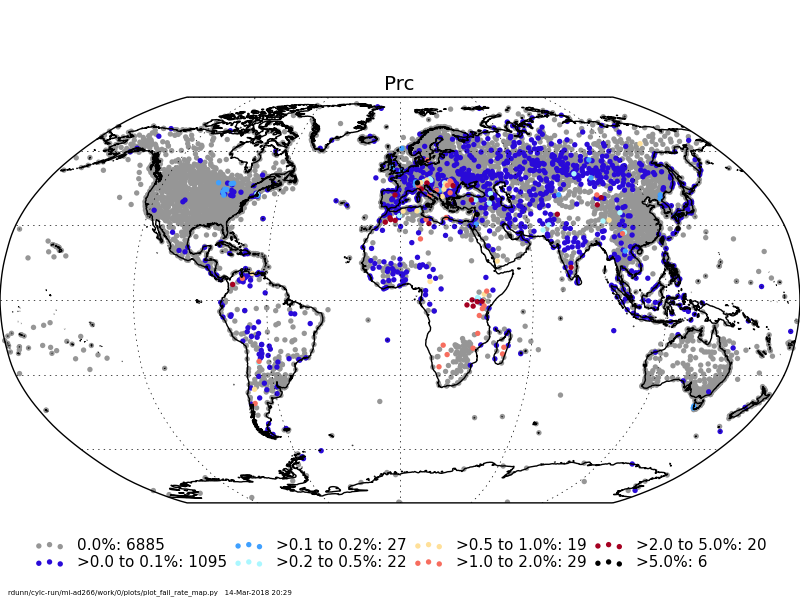
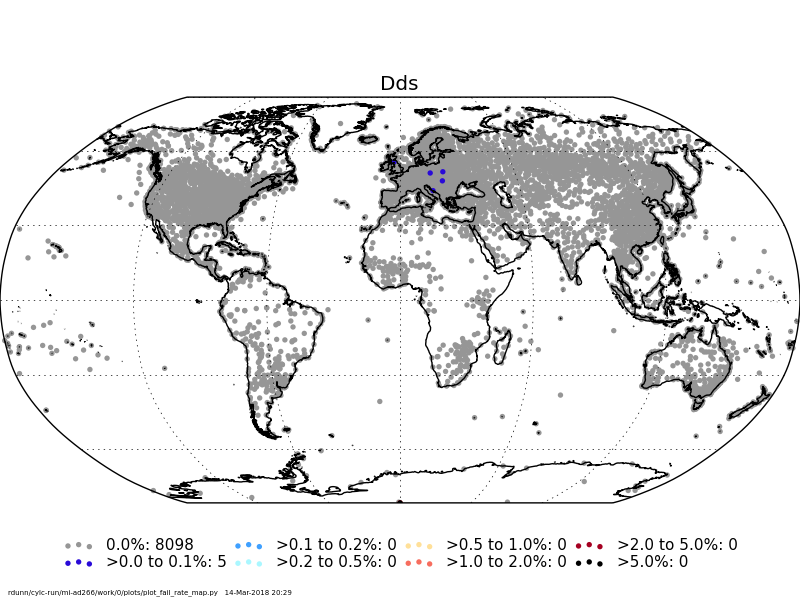
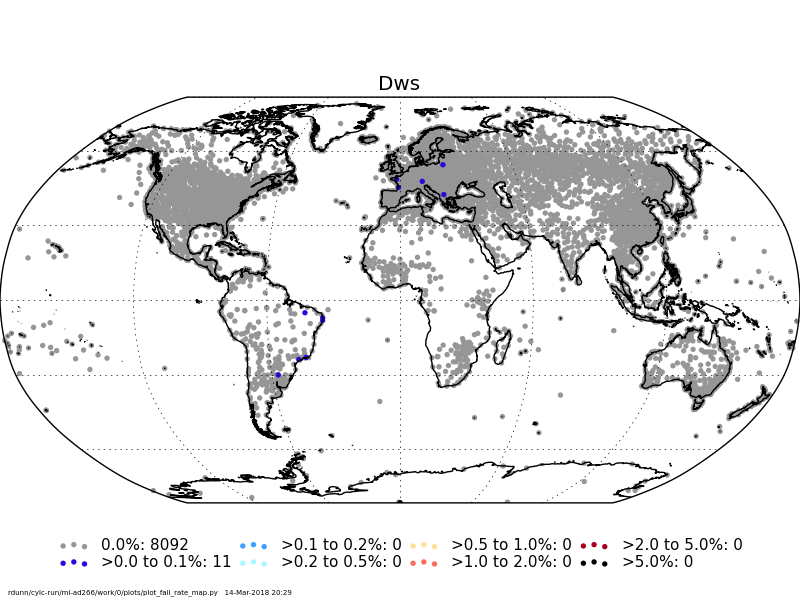
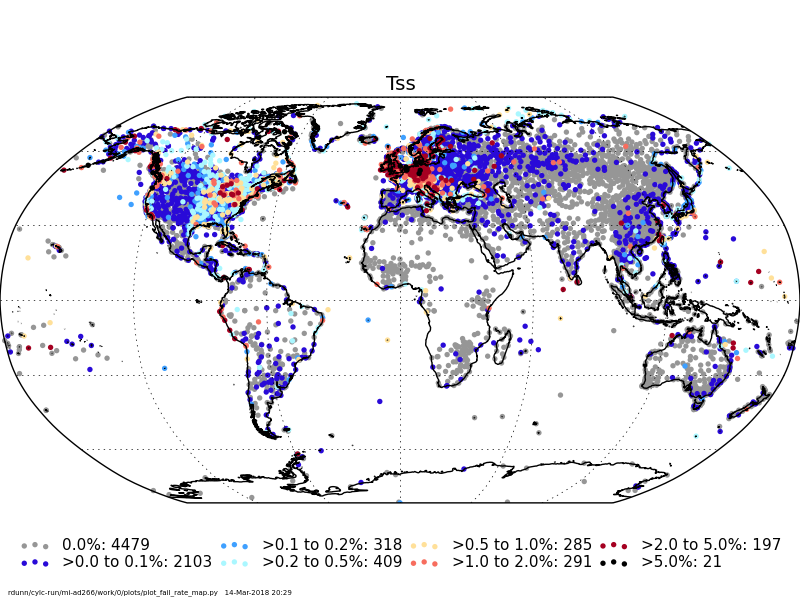
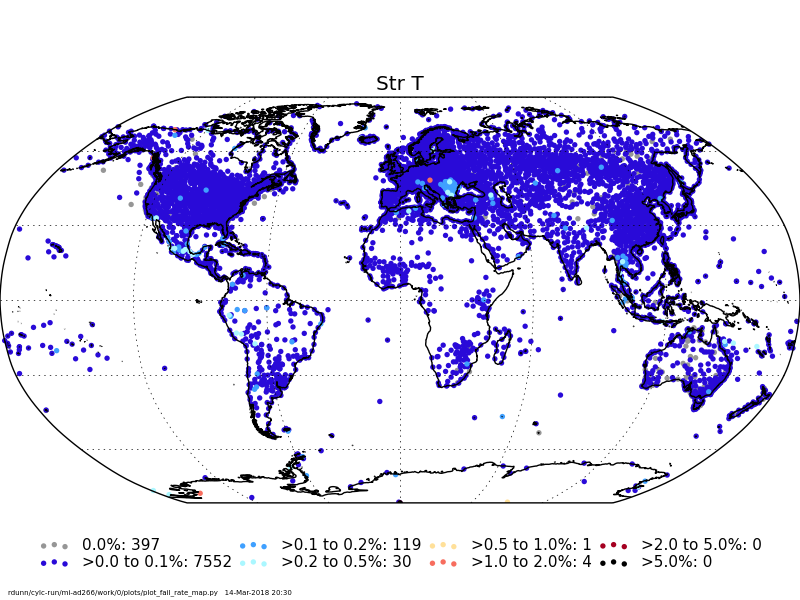
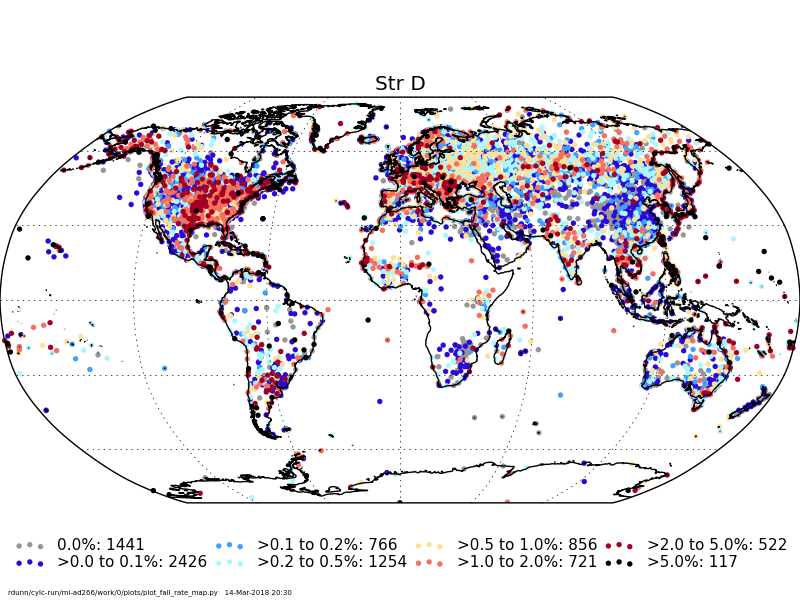
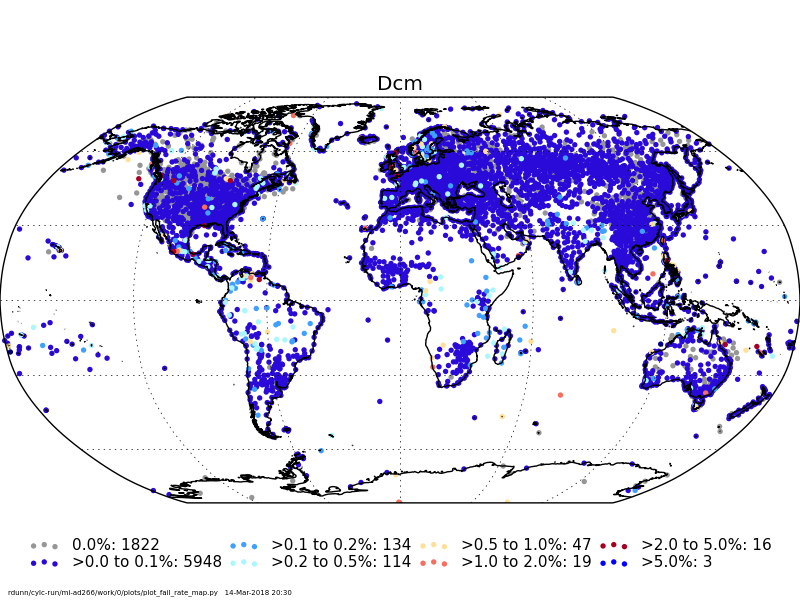
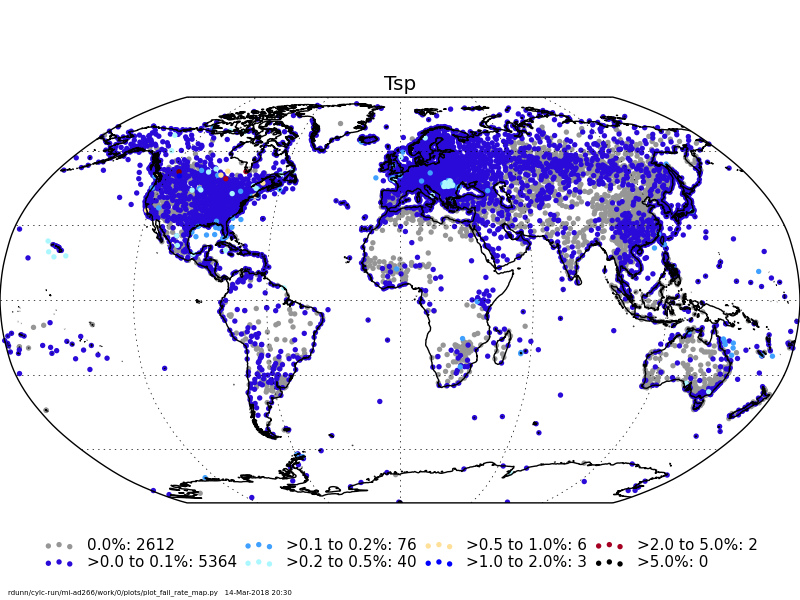
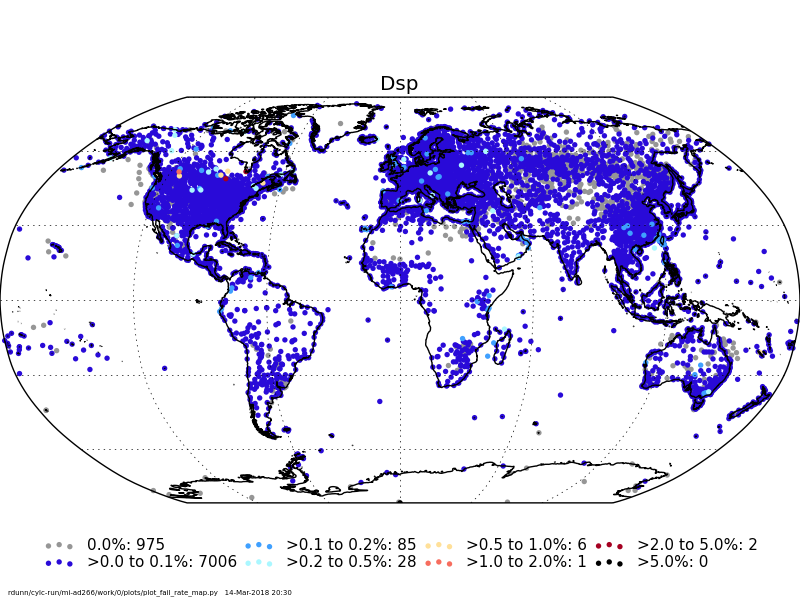
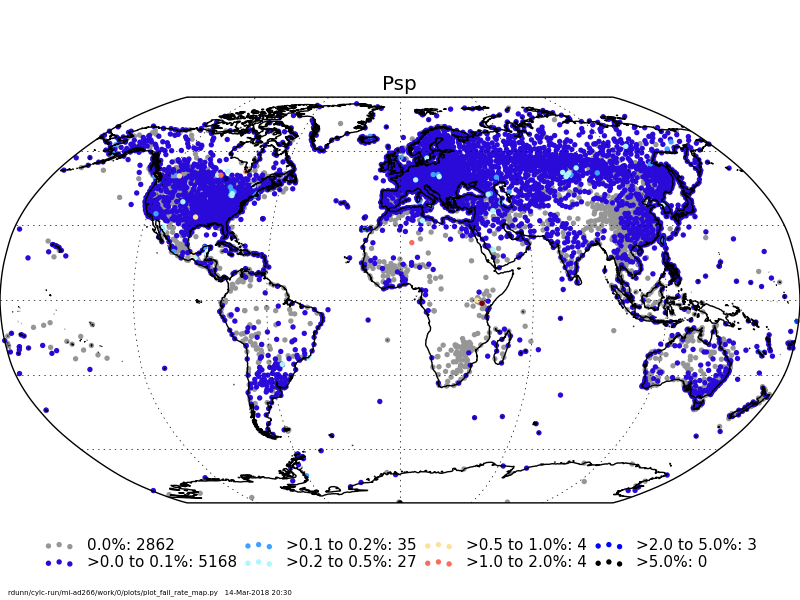
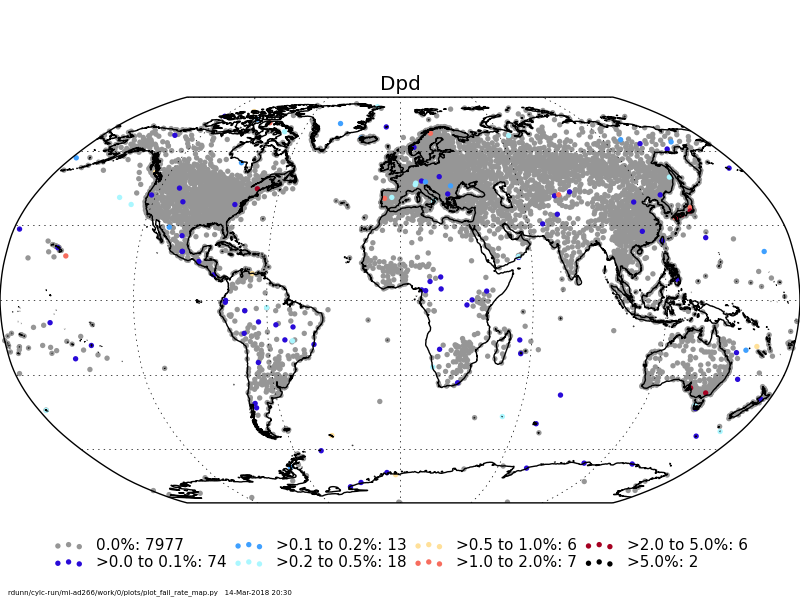
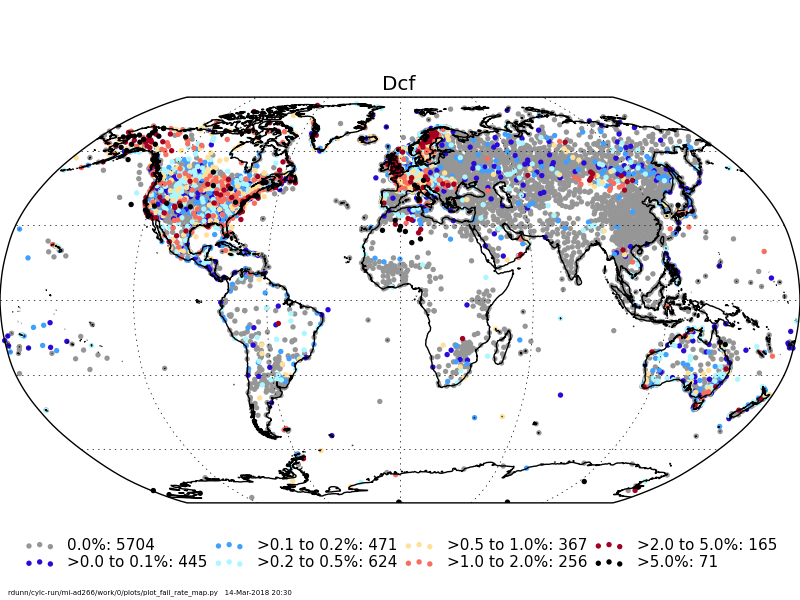
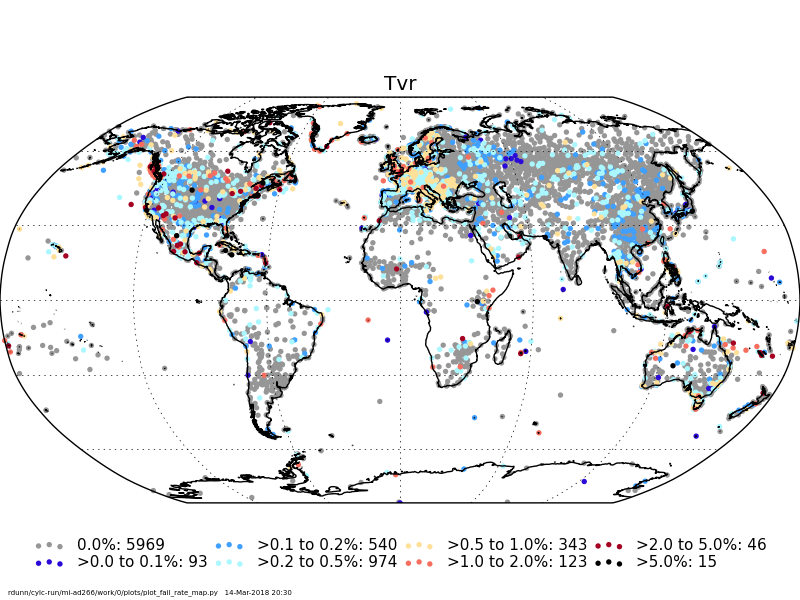
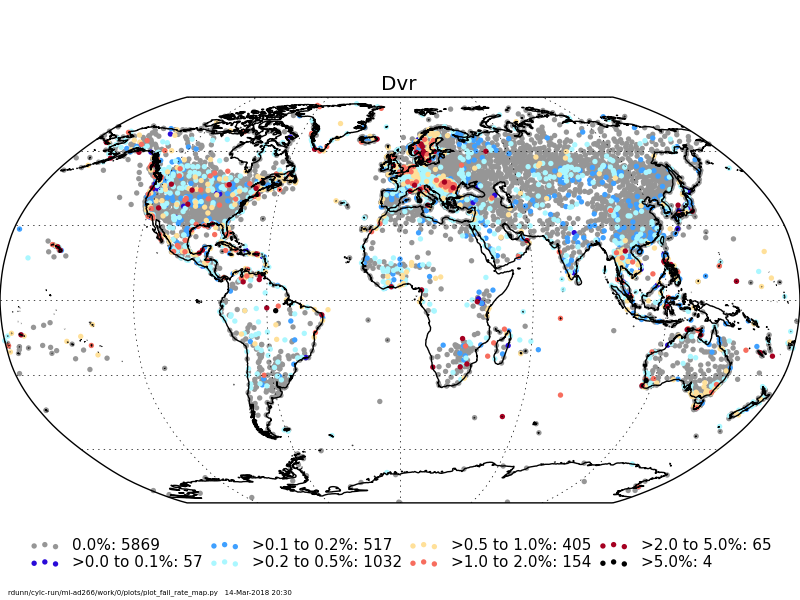
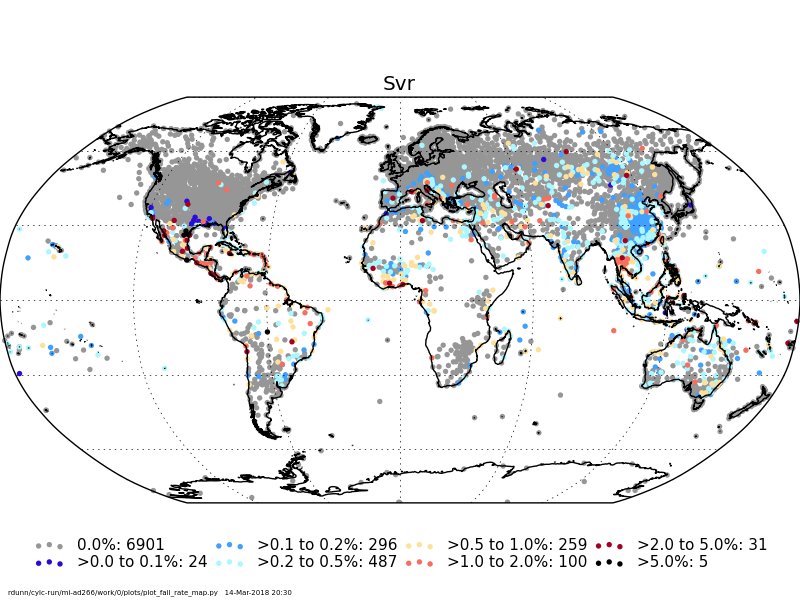
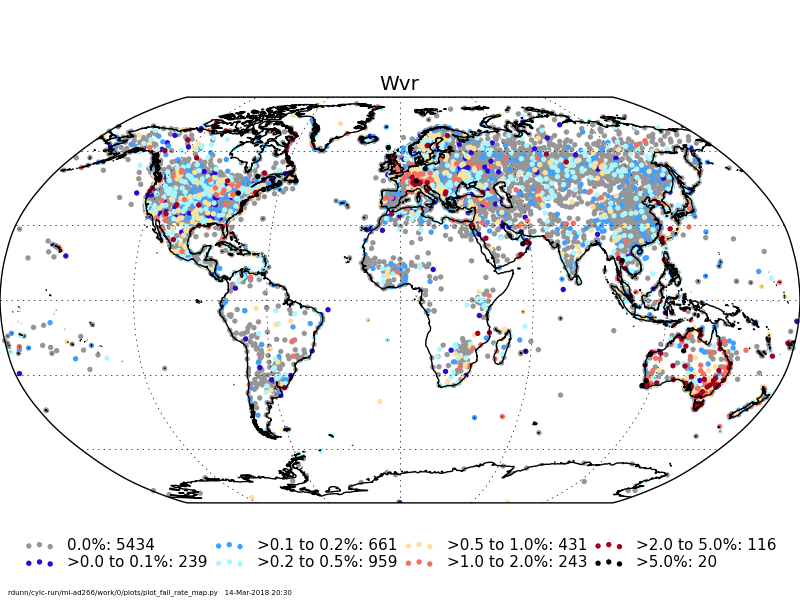
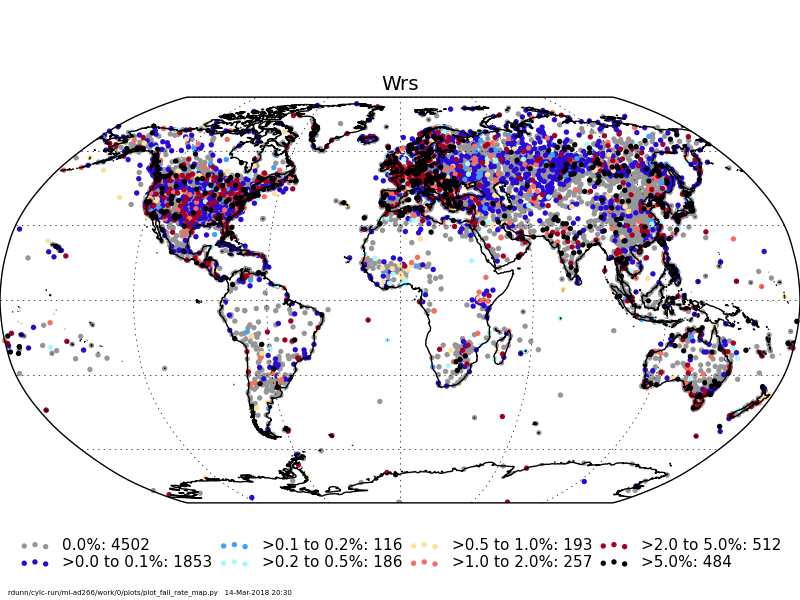
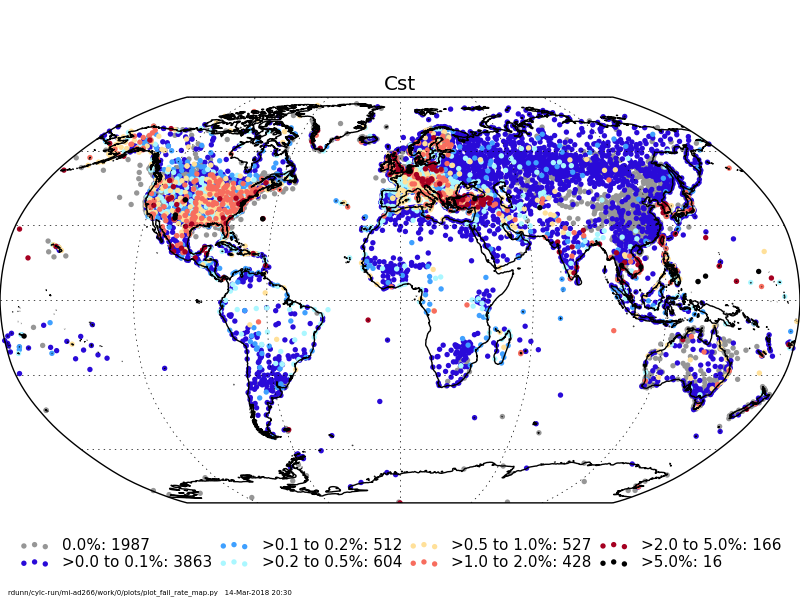
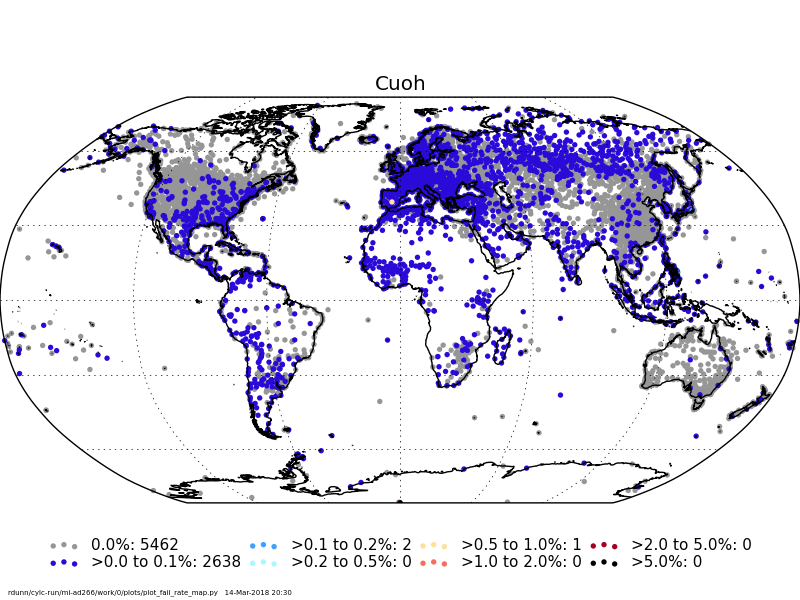
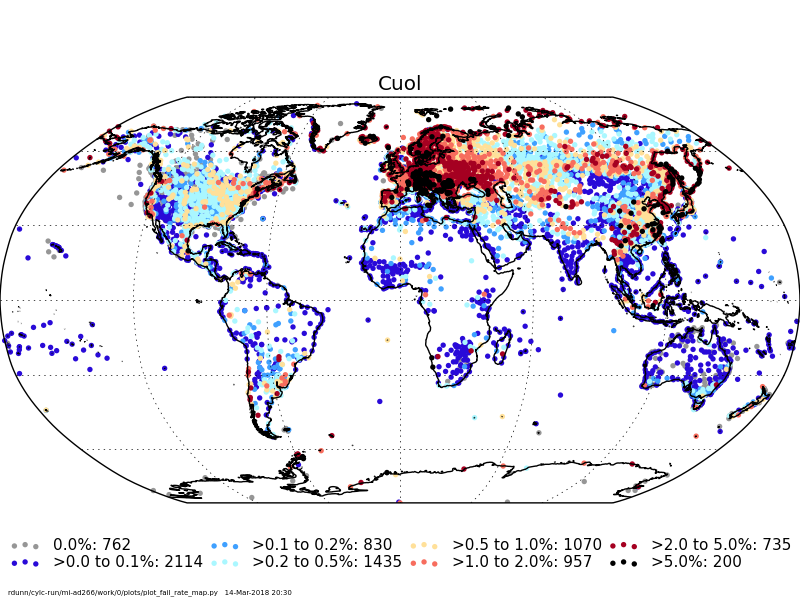
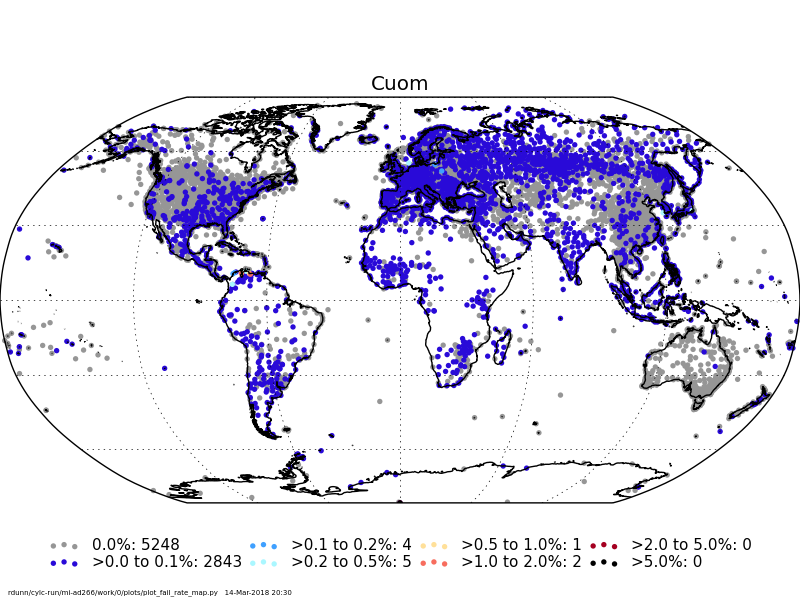
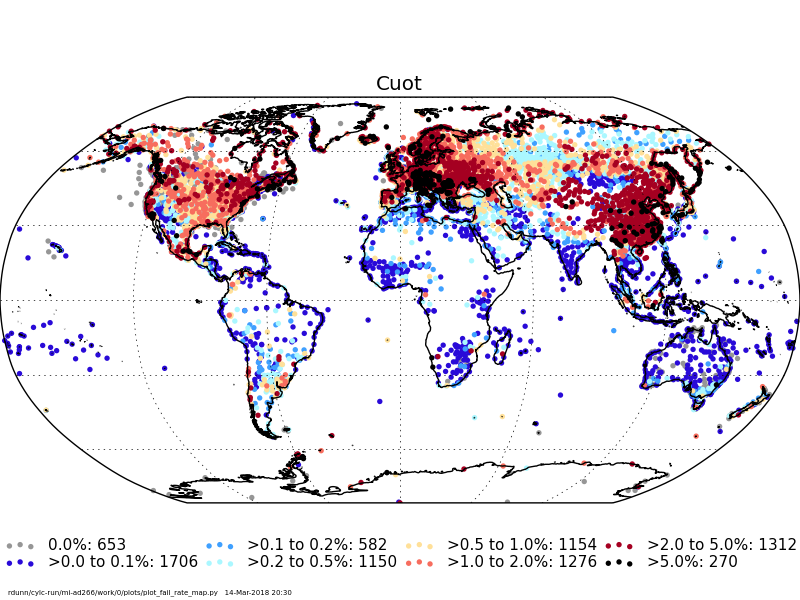
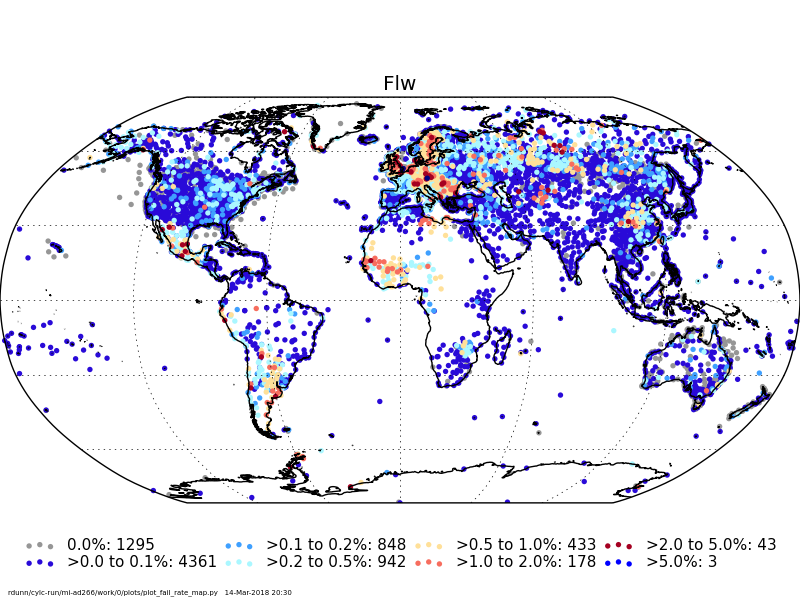
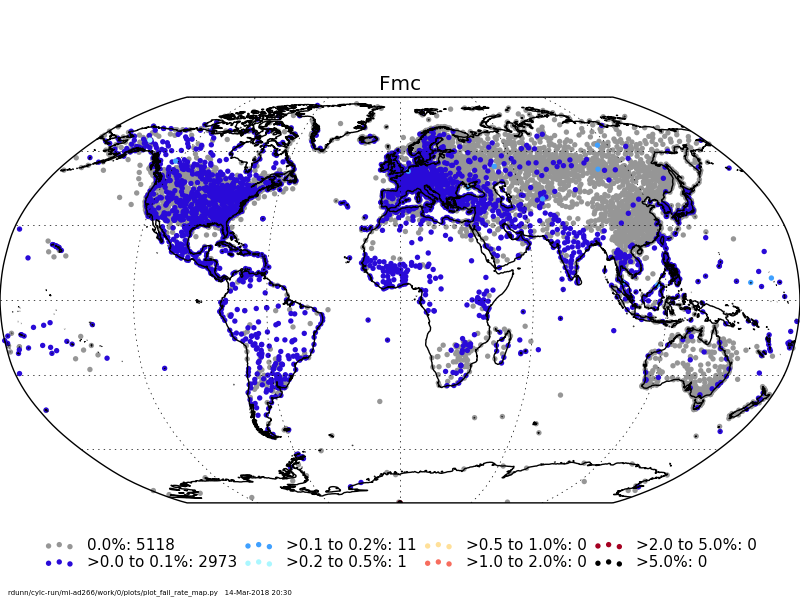
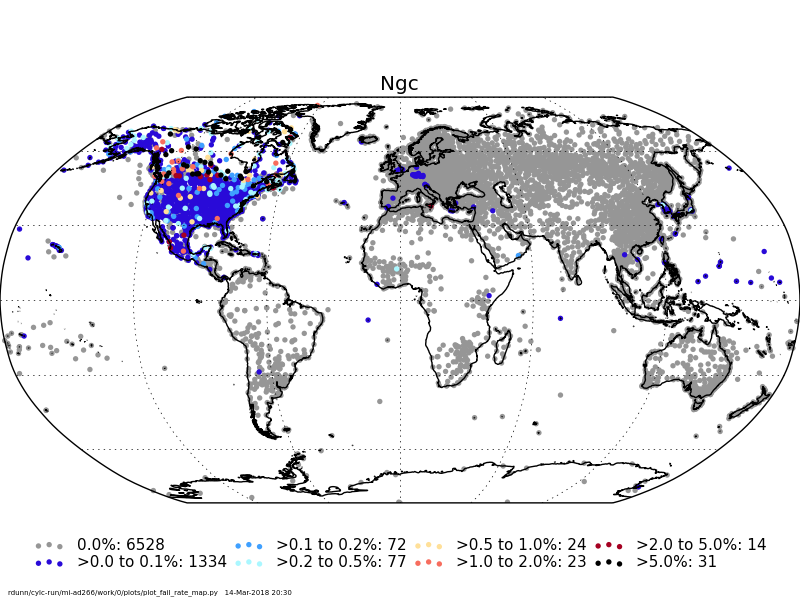
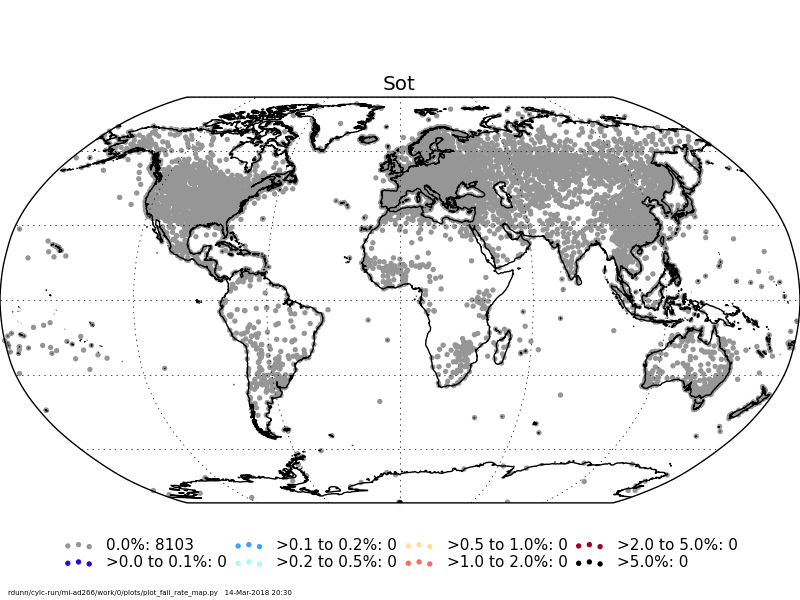
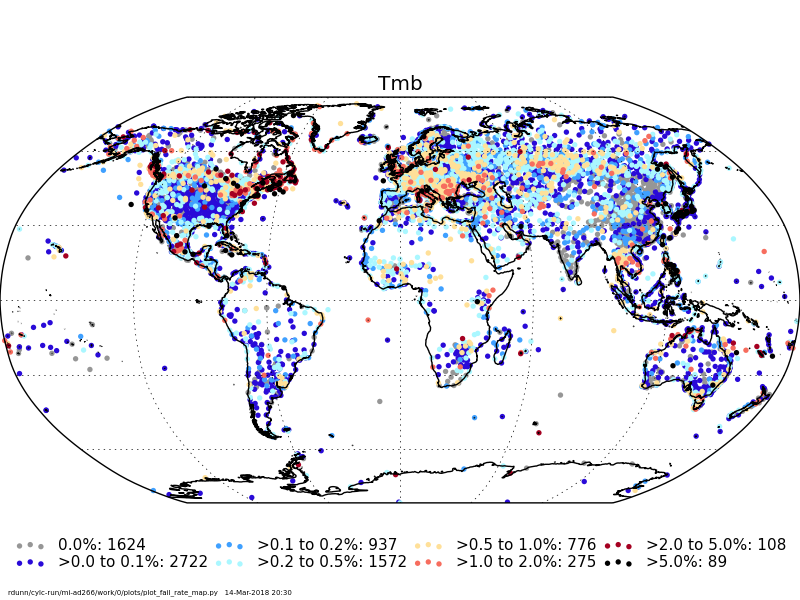
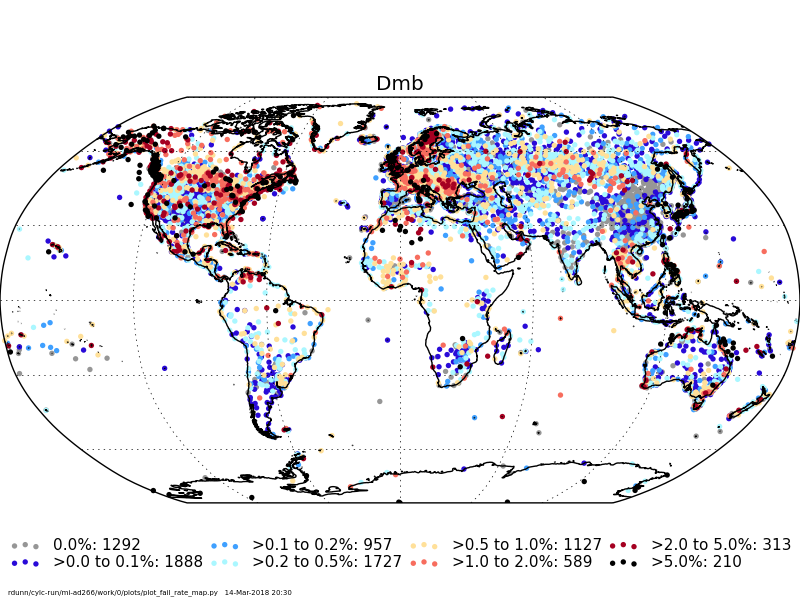
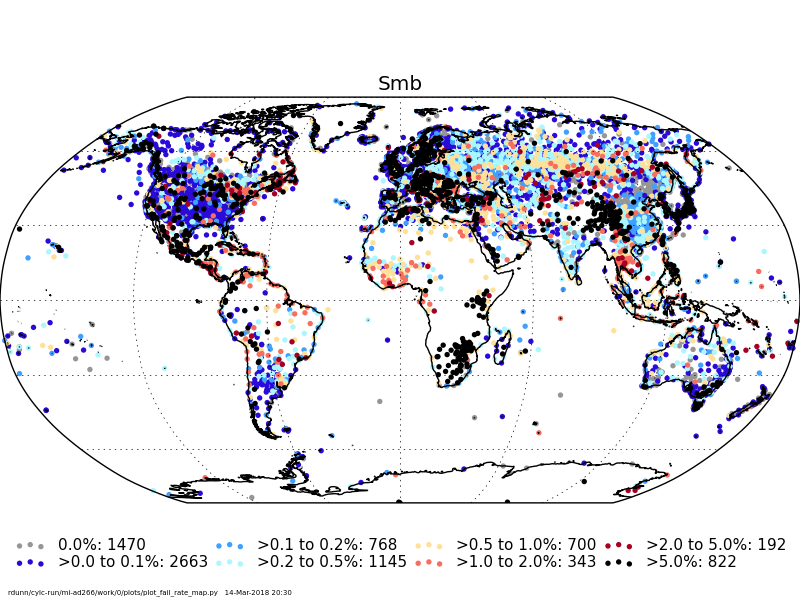
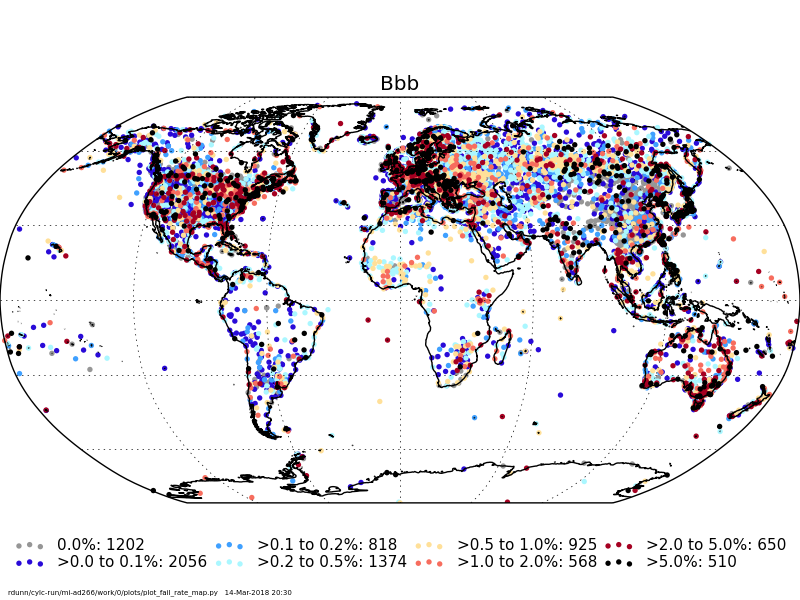
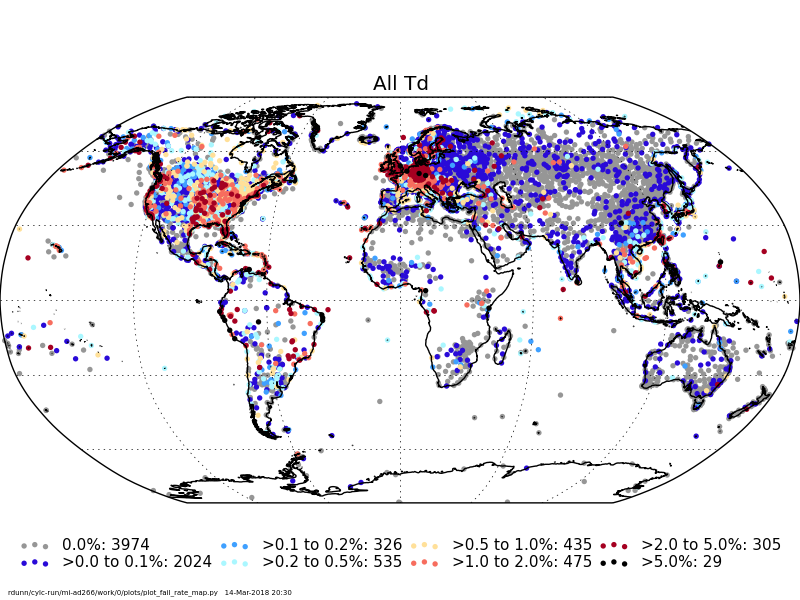
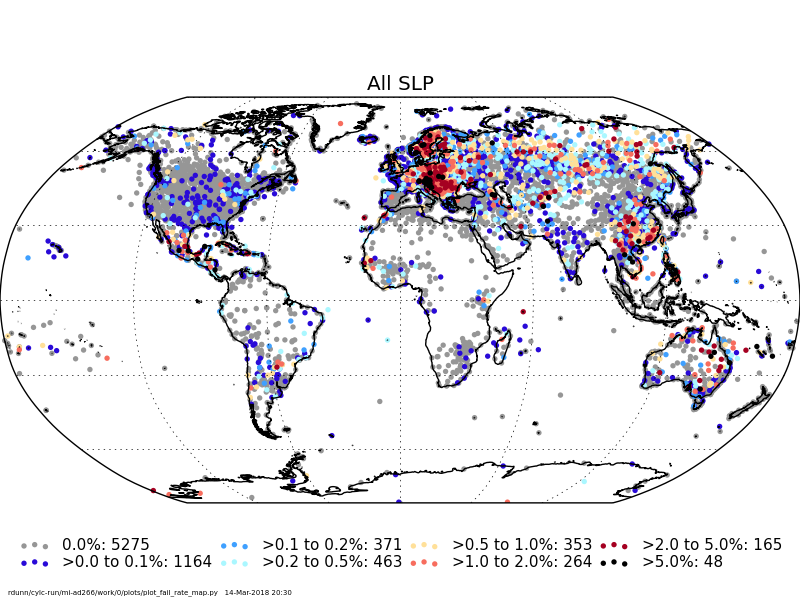
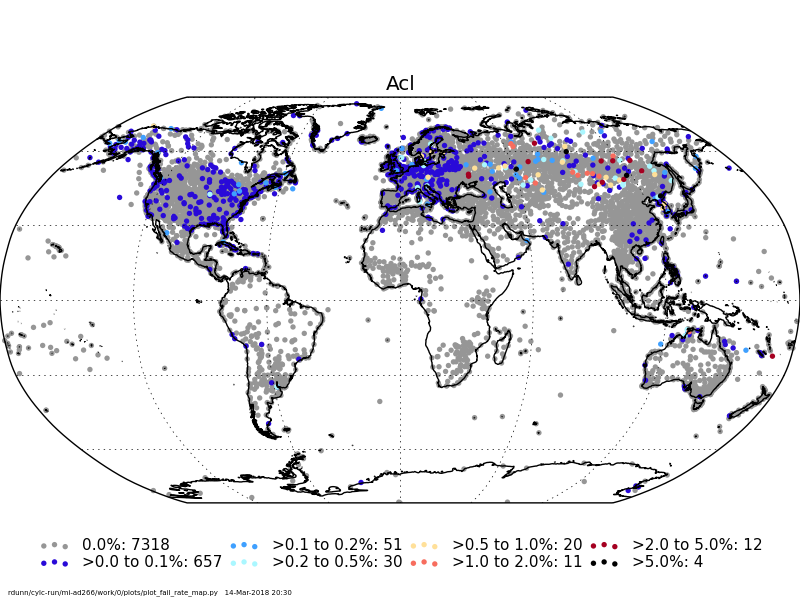
| Number of stations with a failures from a certain test in percentage bins | all_fails_summary_20180314.dat | 3 | |
| Test 3-letter code descriptor | tests_codes.txt | ||
| Test | Variable | PostScript | PNG |
|---|---|---|---|
| Duplicate months | All | eps | png |
| Odd Cluster | Temperatures | eps | png |
| Odd Cluster | Dew Points | eps | png |
| Odd Cluster | SLP | eps | png |
| Odd Cluster | Wind Speed | eps | png |
| Frequent Value Check | Temperature | eps | png |
| Frequent Values | Dew point | eps | png |
| Frequent Values | SLP | eps | png |
| Diurnal Cycle Check | All | eps | png |
| Gap Check | Temperature | eps | png |
| Gap Check | Dew point | eps | png |
| Gap Check | SLP | eps | png |
| Record Check | Temperature | eps | png |
| Record Check | Dew point | eps | png |
| Record Check | SLP | eps | png |
| Record Check | Wind speed | eps | png |
| Day Strings | Temperature | eps | png |
| Day Strings | Dew point | eps | png |
| Day Strings | SLP | eps | png |
| Day Strings | Wind speed | eps | png |
| Straight Strings | Temperature | eps | png |
| Straight Strings | Dew point | eps | png |
| Straight Strings | SLP | eps | png |
| Straight Strings | Wind speed | eps | png |
| Hour Strings | Temperature | eps | png |
| Hour Strings | Dew point | eps | png |
| Hour Strings | SLP | eps | png |
| Hour Strings | Wind speed | eps | png |
| All temperature strings | Temperature | eps | png |
| All dewpoint strings | Dew point | eps | png |
| All SLP strings | SLP | eps | png |
| All wind strings | Wind speed | eps | png |
| Climatological Check | Temperature | eps | png |
| Climatological Check | Dew point | eps | png |
| Climatological Check | SLP | eps | png |
| Spike Check | Temperature | eps | png |
| Spike Check | Dew point | eps | png |
| Spike Check | SLP | eps | png |
| Spike Check | Wind speed | eps | png |
| Supersaturation | Dew point | eps | png |
| Dew point depression | Dew point | eps | png |
| Dew point Cut Off | Dew point | eps | png |
| Variance Check | Temperature | eps | png |
| Variance Check | Dew point | eps | png |
| Variance Checks | SLP | eps | png |
| Variance Checks | Wind speed | eps | png |
| Logical Check | Wind speed | eps | png |
| Wind Rose | Wind speed | eps | png |
| Cloud Total | Low,Mid,High,Total | eps | png |
| Unobservable | High Cloud | eps | png |
| Unobservable | Low Cloud | eps | png |
| Unobservable | Mid Cloud | eps | png |
| Unobservable | Total Cloud | eps | png |
| Full Low cloud check | Mid & High Cloud | eps | png |
| Full Mid cloud check | High Cloud | eps | png |
| Negative cloud value | All Cloud | eps | png |
| Neighbour Outlier | Temperature | eps | png |
| Neighbour Outlier | Dew point | eps | png |
| Neighbour Outlier | SLP | eps | png |
| Month cleared | Temperature | eps | png |
| Month cleared | Dew point | eps | png |
| Month cleared | SLP | eps | png |
| Month Cleared | Wind Speed | eps | png |
| Month cleared | Wind Direction | eps | png |
| Month cleared | Total cloud | eps | png |
| Month cleared | High Cloud | eps | png |
| Month cleared | Mid Cloud | eps | png |
| Month cleared | Low Cloud | eps | png |
| Month cleared | Cloud Base | eps | png |
| All | Temperature | eps | png |
| All | Dew point | eps | png |
| All | SLP | eps | png |
| All | Cloud | eps | png |
|
Maintained by: Robert Dunn |
© Crown Copyright |