MSG Maximum and Minimum Surface Temperatures Data: download version 1.0.1
Version History (current version shown in bold)
What is the difference between the current and previous versions?
v1.0.0 - First version released (March 2014)
v1.0.1 - Land cover map changed from GlobCover to ESA Land Cover CCI (March 2015)
You are strongly advised to read this paper before using the data. Data are provided in NetCDF files and contain the following variables for each pixel on each day (click on links for further information about each variable):
Pixel latitudes and longitudes are not included in the NetCDF files in order to conserve space, as the geolocation grid is constant from one day to the next. The file msg_geo_euro.nc.gz (1.2 MB) contains latitude and longitude information for each SEVIRI pixel in the files below.
Data have been processed for the years 2009 to 2015 (up to 23/02/2015), inclusive. However, we have found some problems with the data between 2009 to 2011 so these data are not included here. If you would like to use these data, please email elizabeth.good@metoffice.gov.uk.
This is the minimum cloud-free LST corresponding to the date of the file. This is obtained from the operational LSA SAF LST product by analysing all available slots between the local time period 23:00 - 08:00 (23:00 is the calendar day before the time stamp for the file). Units are in K, with a scaling factor of 10 (i.e. divide by 10 to get correct numbers).
This is the maximum cloud-free LST corresponding to the date of the file. This is obtained from the operational LSA SAF LST product by analysing all available slots between the local time period 11:00 - 16:00. Units are in K, with a scaling factor of 10 (i.e. divide by 10 to get correct numbers).
This is the estimated minimum air temperature for the day. This is calculated from a regression-based analysis using the minimum LST and other variables as predictors. Units are in K, with a scaling factor of 10 (i.e. divide by 10 to get correct numbers).
This is the estimated maximum air temperature for the day. This is calculated from a regression-based analysis using the maximum LST and other variables as predictors. Units are in K, with a scaling factor of 10 (i.e. divide by 10 to get correct numbers).
This is the error provided by the LSA SAF LST product used for the minimum LST. Units are in K, with a scaling factor of 10 (i.e. divide by 10 to get correct numbers).
This is the error provided by the LSA SAF LST product used for the maximum LST. Units are in K, with a scaling factor of 10 (i.e. divide by 10 to get correct numbers).
This is the % of the maximum number of possible observations that are cloud-free and valid during the analysis window used for the minimum LST extraction. (Maximum possible number of available slots between 23:00 and 08:00 is 37.) Units are in %, with a scaling factor of 10 (i.e. divide by 10 to get correct numbers).
This is the % of the maximum number of possible observations that are cloud-free and valid during the analysis window used for the maximum LST extraction. (Maximum possible number of available slots between 23:00 and 08:00 is 21.) Units are in %, with a scaling factor of 10 (i.e. divide by 10 to get correct numbers).
This is the standard error on the calculated Tmin value (i.e. the square-root of the quadrature sum of the error on each predictor variable for each pixel multipled by it's regression coefficient + the uncertainty on that regression coefficient). These errors should be treated with care as they are unlikely to account all aspects on the uncertainty for Tmin. Units are in K, with a scaling factor of 10 (i.e. divide by 10 to get correct numbers).
This is the standard error on the calculated Tmax value (i.e. the square-root of the quadrature sum of the error on each predictor variable for each pixel multipled by it's regression coefficient + the uncertainty on that regression coefficient). These errors should be treated with care as they are unlikely to account all aspects on the uncertainty for Tmax. Units are in K, with a scaling factor of 10 (i.e. divide by 10 to get correct numbers).
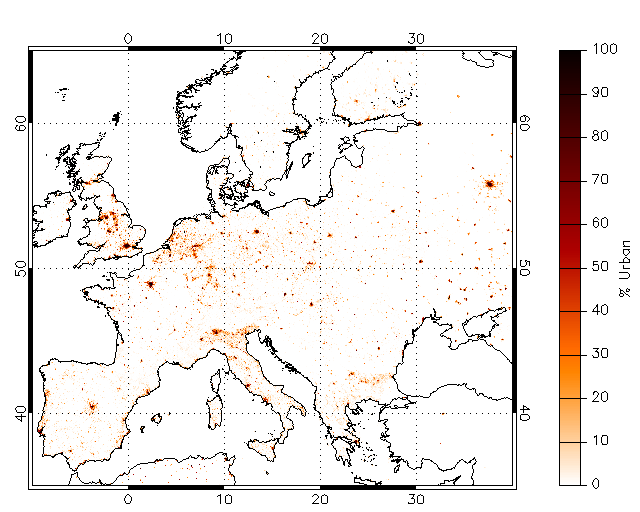
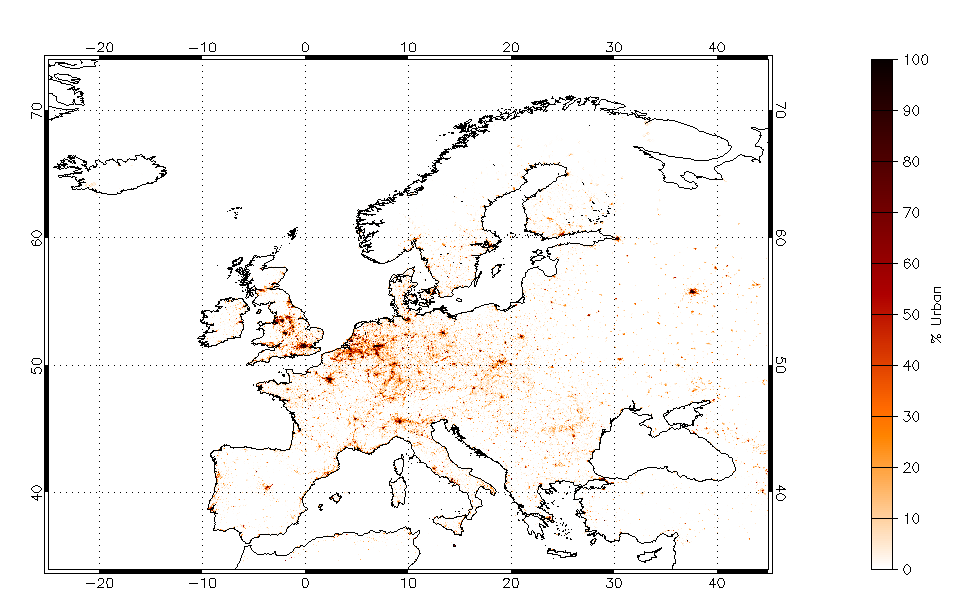
The only change implemented between version 1.0.0 (March 2014) and version 1.0.1 is in the land cover map, which is used to estimate 1) urban fraction and 2) water fraction for each SEVIRI pixel. Urban fraction is one of the predictors in the regression analysis, whilst water fraction is used to exclude some SEVIRI-station matchups used to train the regression model, where the fraction of water is high. Version 1.0.0 used the GlobCover land use map, whilst version 1.0.1 uses the ESA Land Cover CCI data set (most recent epoch). The impact of this change is small on the overall data set (<0.1 deg median change, <0.25 deg RMS for Tmax, <0.1 deg RMS for Tmin), but a small number pixels in v1.0.1 may be up to 2 degrees warmer than in v1.0.0, which is attributed to where pixels are newly classifed as urban/more urban in Land Cover CCI compared with GlobCover (see figures below).

SEVIRI pixel Urban Fraction based on GlobCover

SEVIRI pixel Urban Fraction based on ESA CCI Land Use (most recent epoch).
|
Commercial and media enquiries
You can access the Met Office Customer Centre, any time of the day or night by phone, fax or e-mail. Trained staff will help you find the information or products that are right for you.
Contact the Met Office Customer Centre
|


