Met Office Hadley Centre Central England Temperature
Home >HadCET >HadCET Diagnostics >

Maximum Central England Temperature, 2013

Month CET Anomaly notes
January 5.8 -0.6
February 6.0 -0.6
March 5.8 -3.3
April 11.9 0.1
May 14.8 -0.8
June 18.0 -0.6
July 24.0 3.7
August 21.3 1.2
September 17.5 0.0
October 15.3 1.4
November 9.2 -0.1
December 9.4 2.2


Average for 2013: 13.31, anomaly: 0.22C

Daily CET graph
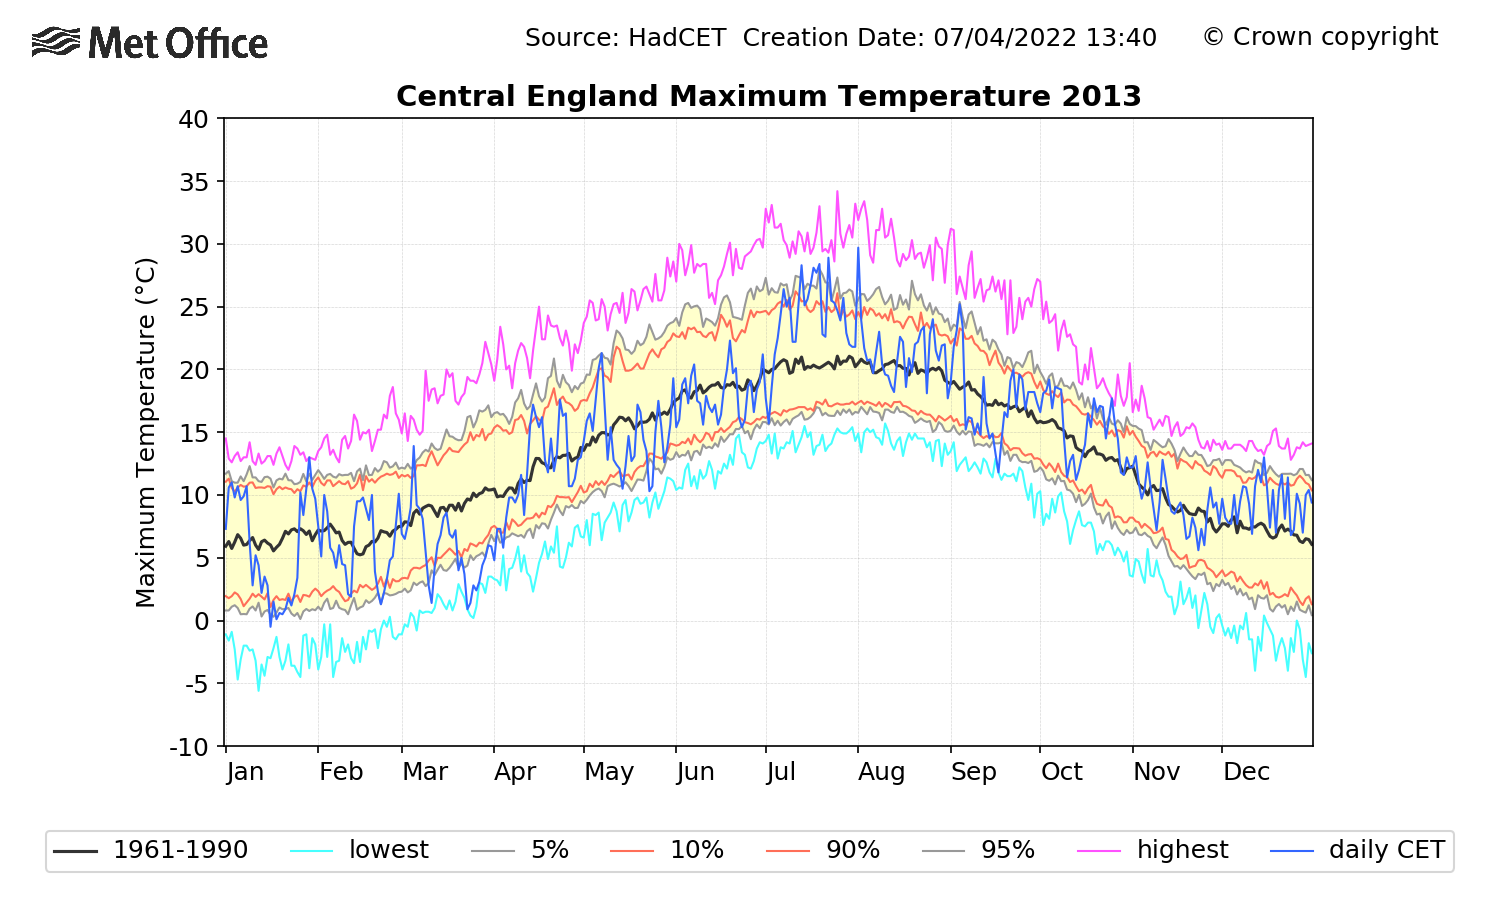
Daily CET for this year
Figure: Daily temperature values for the year against 1961-1990 climatology

Note: These actual and anomaly values were calculated using the version of the HadCET series that was available at the time the pages were produced.
They will remain static and will not be updated when new versions of the dataset are produced.
For the equivalent values in the latest version of HadCET, please reference the monthly/annual values available from the Data Download page.

© Crown Copyright