
Weather warnings guide
A guide to the National Severe Weather Warning Service
As the UK's official weather service, the Met Office is responsible for issuing weather warnings, which warn of impacts caused by severe weather. Our warnings are designed to let people, businesses, emergency responders and governments know what weather is in store and what the impacts of that weather may be. The Met Office operates 24 hours a day, 365 days a year so warnings can be issued at any time, day or night.
We provide warnings up to seven days ahead for rain, thunderstorms, wind, snow, lightning, ice, extreme heat and fog.
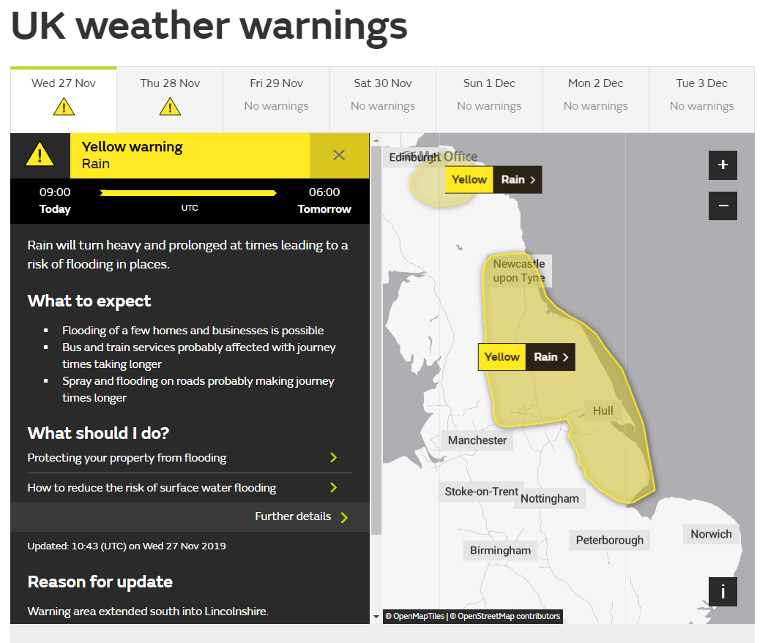
Each warning will contain the following sections:
- Headline – a short weather headline, which states what weather type, is forecast
- What to expect – details on the types of impact forecast and an indication of how likely those impacts are
- What should I do – this section links to advice and guidance from our partners on how to stay safe in severe weather
- Further details – additional information on the forecast weather.
When applicable, warnings will include information on why a warning has been updated.
What do the colours mean?
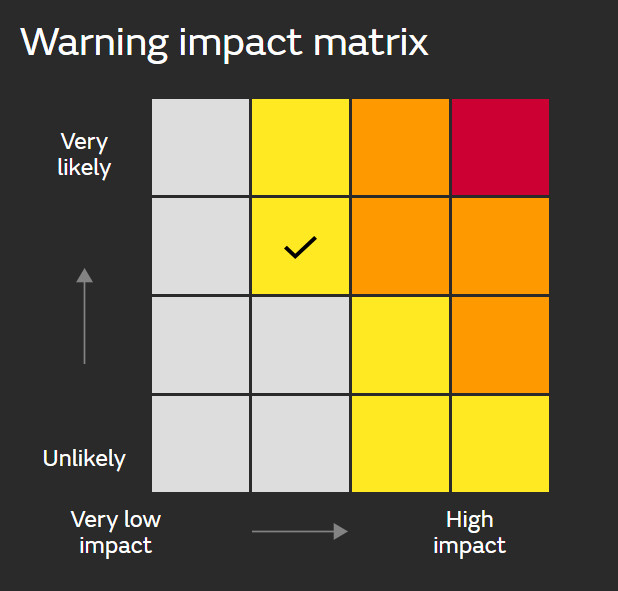
The Met Office issues weather warnings, through the National Severe Weather Warning Service, when severe weather has the potential to bring impacts to the UK. These warnings are given a colour (yellow, amber or red) depending on a combination of both the impact the weather may have and the likelihood of those impacts occurring.
Yellow and Amber warnings represent a range of impact levels and likelihoods. This means it is important to read each warning to know what level of impact you can expect for your chosen warning area – and how likely those impacts are to occur.
These impacts can include damage to property, travel delays and cancellations, loss of water supplies, power cuts and, in the most severe cases, bring a danger to life.
We show this combination of impact and likelihood in a matrix, which can be seen in the Further Details section of our warnings. To understand how likely we think the forecast impacts are, always check the matrix to see which box has been ticked.
Yellow Warning: Yellow warnings can be issued for a range of weather situations. Many are issued when it is likely that the weather will cause some low level impacts, including some disruption to travel in a few places. Many people may be able to continue with their daily routine, but there will be some that will be directly impacted and so it is important to assess if you could be affected. Other yellow warnings are issued when the weather could bring much more severe impacts to the majority of people but the certainty of those impacts occurring is much lower. It is important to read the content of yellow warnings to determine which weather situation is being covered by the yellow warning.
Amber Warning: There is an increased likelihood of impacts from severe weather, which could potentially disrupt your plans. This means there is the possibility of travel delays, road and rail closures, power cuts and the potential risk to life and property. You should think about changing your plans and taking action to protect yourself and your property. You may want to consider the impact of the weather on your family and your community and whether there is anything you need to do ahead of the severe weather to minimise the impact.
Red Warning: Dangerous weather is expected and, if you haven’t already done so, you should take action now to keep yourself and others safe from the impact of the severe weather. It is very likely that there will be a risk to life, with substantial disruption to travel, energy supplies and possibly widespread damage to property and infrastructure. You should avoid travelling, where possible, and follow the advice of the emergency services and local authorities.
Always keep up to date with the latest forecast from the Met Office.
Additional advice and information from the Met Office
- What impacts should I expect in severe weather?
- Severe weather information and advice from the Met Office and our partners
How can I access Met Office weather warnings?
Met Office weather warnings are available in a number of ways, which make it easy to get the very latest information wherever you are. These include the:
- Met Office app and website
- social media
- email alerts
- TV and radio
- RSS
- NSWWS API (business use only)
Severe weather warning information is displayed across our website, keeping you up to date with the latest details, including:
Homepage
When a warning is in force, it will be highlighted in the warnings banner on the homepage. This will provide information on the colour of the warnings in force.

If you click on the warnings banner you will be taken to the weather warnings page.
Weather Warnings page
The warnings home page shows a UK map with any warnings for that day displayed on the map. The tabs at the top of the page allow you to navigate through the next seven days, with warning triangles highlighting any weather warnings affecting the UK on each day.
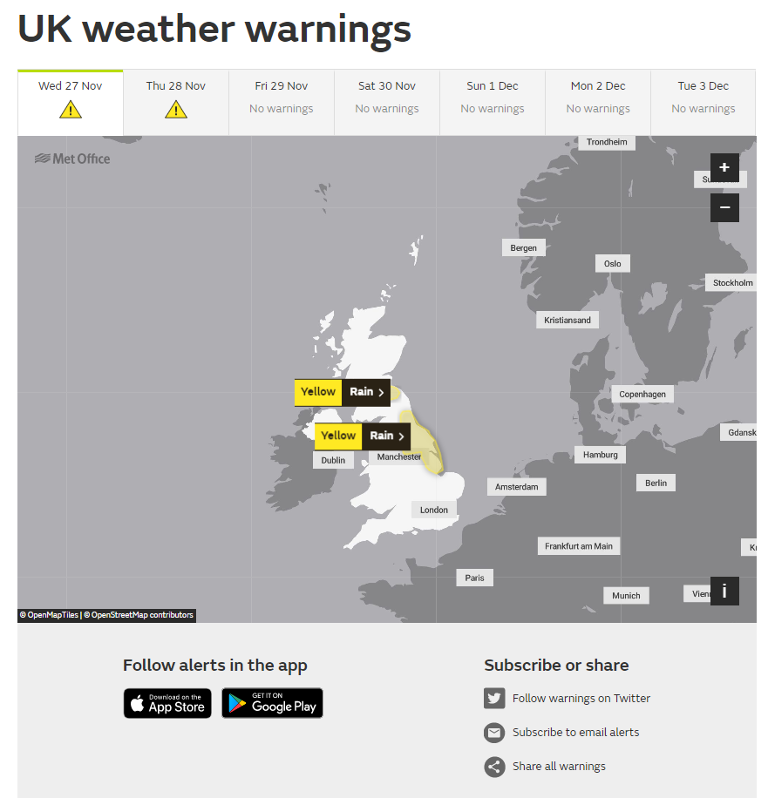
You can use the links at the bottom of the map to share the warnings with your family and friends through social media or by copying and sharing the link/URL. You will also find additional links to stay up to date with the warnings through our mobile apps, social media or email alerts.
To see the full details for each warning, click on the chosen warning label on the map.
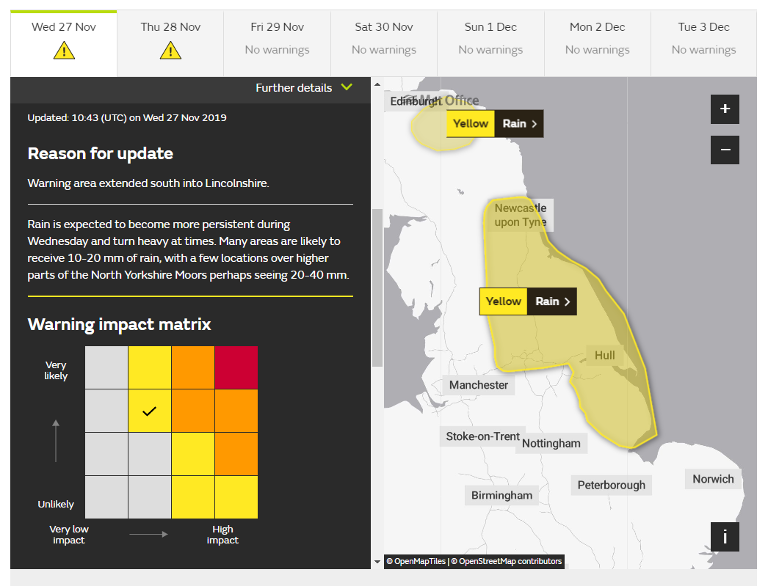
By clicking on 'Further details' within each warning, you will be shown additional information including:
- additional information about the forecast weather
- the list of areas and local authorities affected
- the impact matrix – showing the combination of the level of impact forecast and the likelihood of those impacts occurring.
Location specific warnings
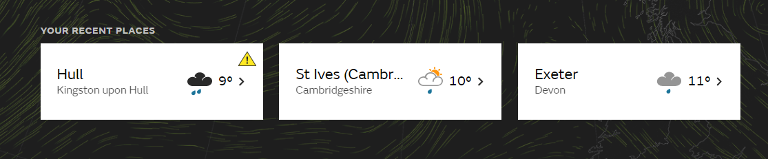
If a warning is in force for your location a warning triangle will appear on your recent places card on the home page.
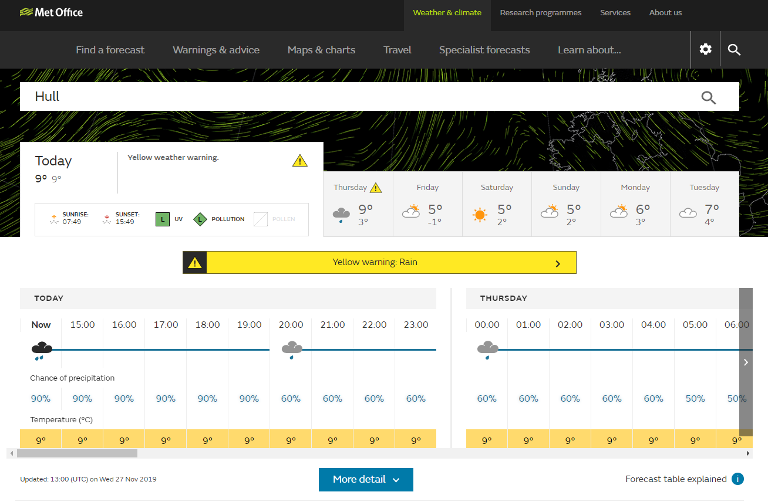
If you click through to your location, the table will show a warnings bar across the times that the warning is in force. This bar will show the colour of the warning and the weather type. Clicking on the warnings bar will take you to the main warnings page where you will find further details about the warning.
Dual warnings
Some weather situations will bring impacts from more than one type of weather. This could include a storm when impacts from both wind and rain may bring disruption. When this happens, a dual warning will be issued.
A dual warning is one warning but covering two different types of weather. The combined effect of the two weather types is used to assess the level of impact forecast. Each dual warning has a single assessment of impact and the likelihood of impacts occurring and therefore a single colour.
Any of the eight weather types can form a dual warning in a number of combinations. The eight weather types are:
- rain
- thunderstorms
- wind
- snow
- lightning
- ice
- extreme heat
- fog
This means Wind and rain or snow and ice could be issued as a dual warning. In practice, there are certain weather types that are more likely to form a dual warning, with perhaps the most likely being rain and wind.
What is the difference between the Extreme Heat Warning, Heat Health Alert, and a heatwave?
- Extreme Heat Warning – an impact-based warning designed to highlight the potential impacts of extreme heat to protect lives and property, helping people make better decisions to stay safe and thrive.
- Public Health England Heat Health Alert - An England only service considering the impact of prolonged extreme heat on public health, especially those with long-term health conditions.
- Heatwave definition - a threshold-based meteorological definition designed to provide the media and public with consistent and reliable messaging.