UK forecast guide
We provide a wide range of forecasts to help you make informed decisions about your day to day activities.
All basic UK forecast information is gathered together on the UK forecast page. Forecasts are provided for regions e.g. South West England, around 7000 specific locations e.g. Exeter or as UK maps.
Met Office homepage
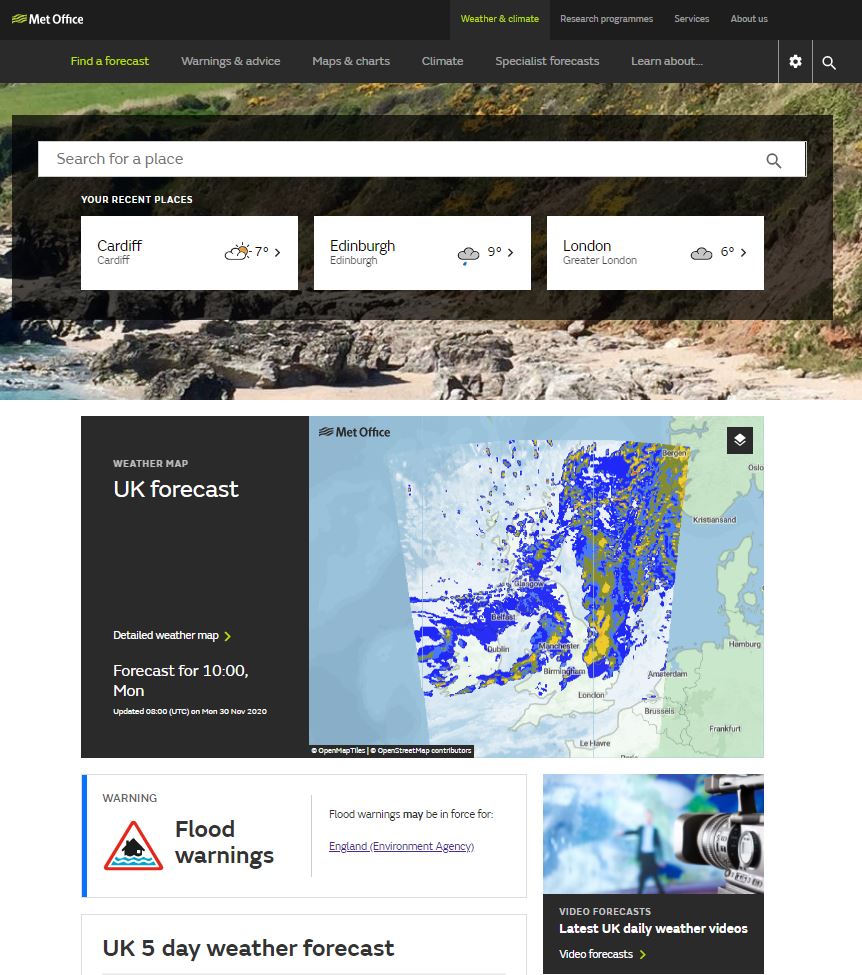
The Met Office homepage gives an overview of the weather for the days ahead at your chosen location at the top of the page. The information shown will give you the weather conditions, maximum and minimum temperatures and show you whether any warnings are in force for your chosen location over the next 7 days. Below this you will find the UK weather map, the 5 day and long range weather forecasts.
For further information about the weather for your chosen location you can click through to the seven-day table.
Seven day table
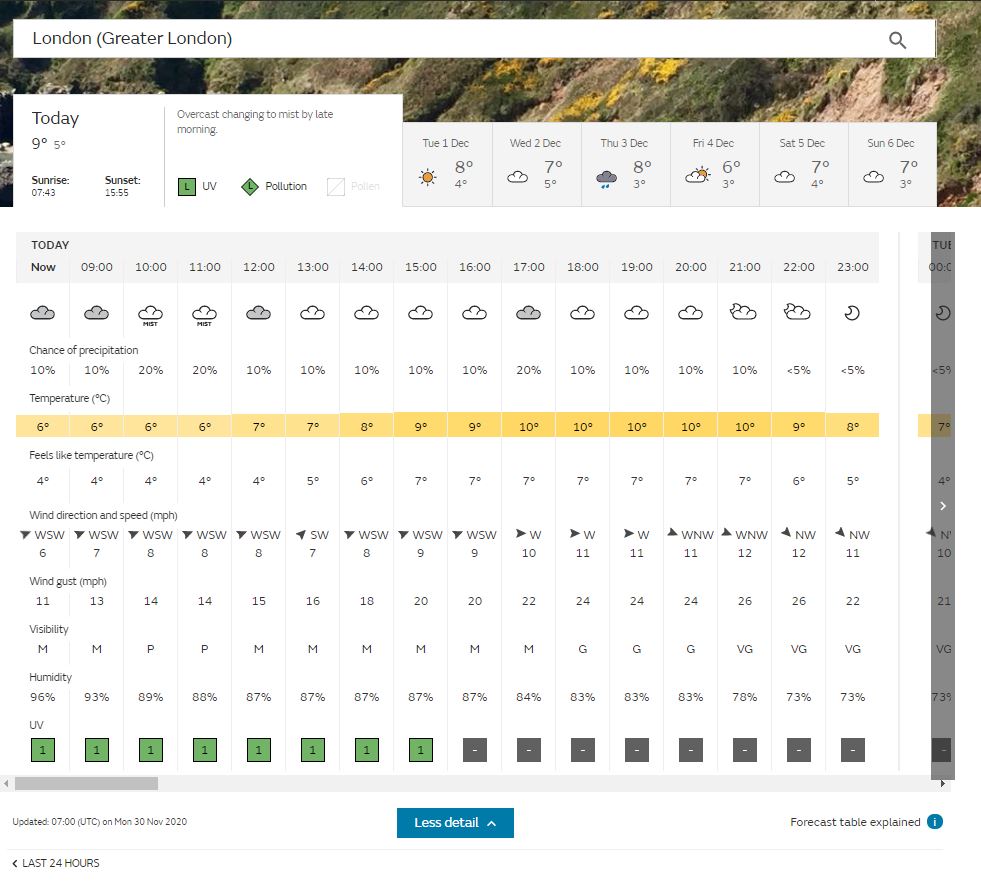
The seven-day forecast table provides a detailed view of the weather for the days ahead at your chosen location. There are around 7000 sites to choose from and forecasts are provided in hourly time steps for the first two days and then in three hourly time steps for days three to seven. Forecasts include weather, temperature, wind speed and direction, UV and feels like temperature.
Use the tabs above the table to display the forecast for that day. The tabs also give an overview summary of the weather for that day.
Take a look at the guide to changing your forecast location.
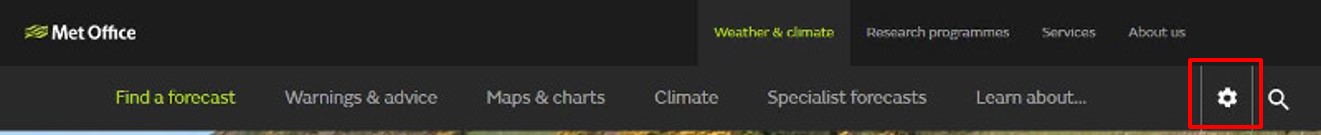
You can choose which units are used on your forecast display e.g. Celsius or Fahrenheit for temperature by clicking on the cog icon at the top of the page.
Additionally, you can see more information by clicking on the 'More Detail' box which will open all forecast element rows at once.
For more information on the symbols used in the seven-day forecast please see our more Key to symbols and terms.

The warnings in force for your location are now shown as a bar instead of individual triangles. A warning triangle will appear in the tab for each day that warnings are in effect.
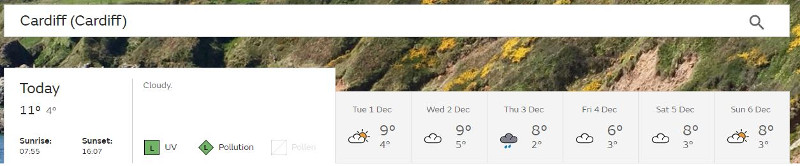
Maximum and Minimum temperatures
The 'Maximum daytime temperature' is the first figure shown underneath the day at the top of the forecast table. This figure is the maximum temperature between sunrise and sunset on the date shown.
The 'Minimum nighttime temperature' is the second figure shown underneath the date at the top of the forecast table. This figure is the minimum temperature recorded between sunset on the date shown and sunrise the following morning. In the above example the minimum temperature of 40C would be recorded between sunset today and sunrise tomorrow.
Beach forecasts
If you choose to display a forecast for a beach location you will be presented with the usual seven-day forecast table.

At the bottom of the table you will find further information about the tide times for your beach location.

If you click through to the 'Full beach forecast' you will be presented with another table. This will include an indication of whether the wind will be on-shore or off-shore, offshore sea state and tide times for the nearest available port.
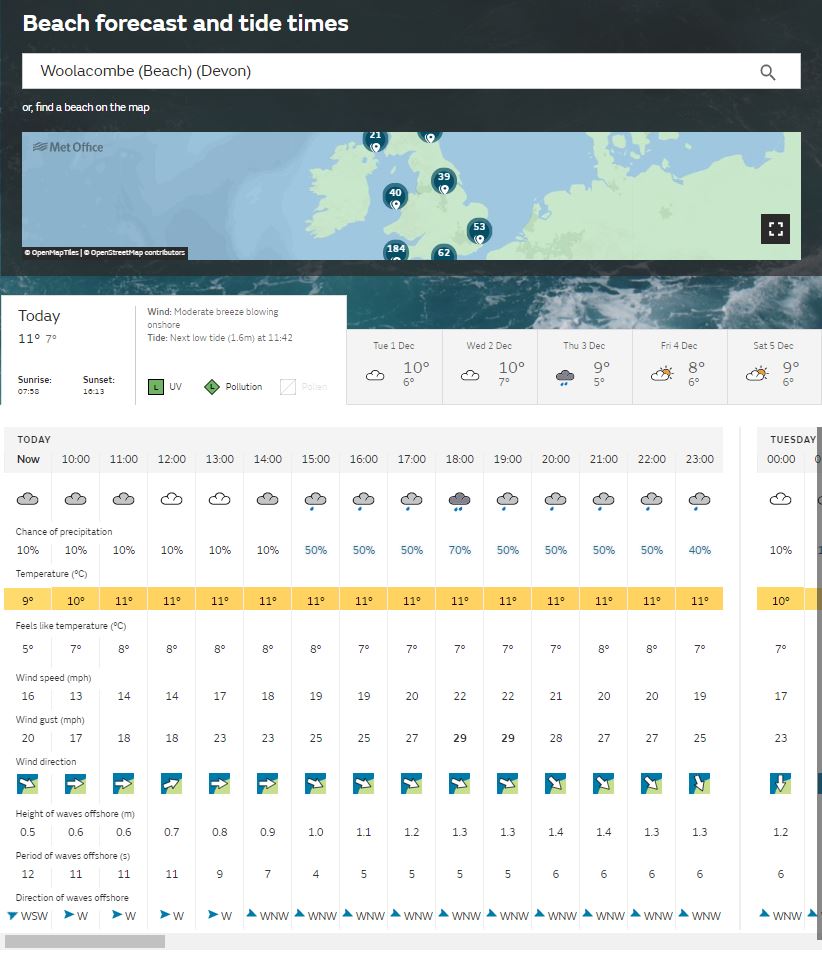
Please note that the beach information is still under development and is intended to give an indication only, it should not be used for safety-critical decisions.
Weather map
The weather map can be found in two locations, on the homepage next to the video forecast or below the forecast table on your specific forecast location page. You can click on the 'Detailed weather map' link to open the UK forecast map page centred on your already chosen forecast site, or you can pick a different forecast site directly from the map.
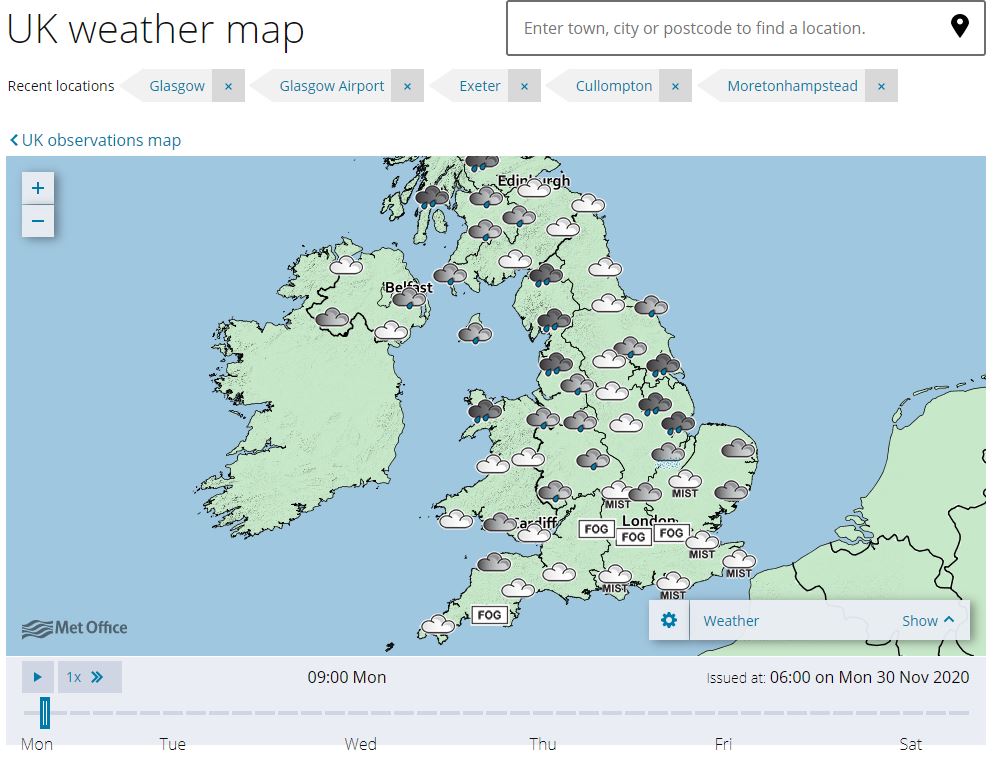
The map view allows you to view both location-specific and mapped forecasts for the UK. Forecasts include weather, temperature, wind speed and direction, UV and feels like temperature as well as rainfall and cloud cover.
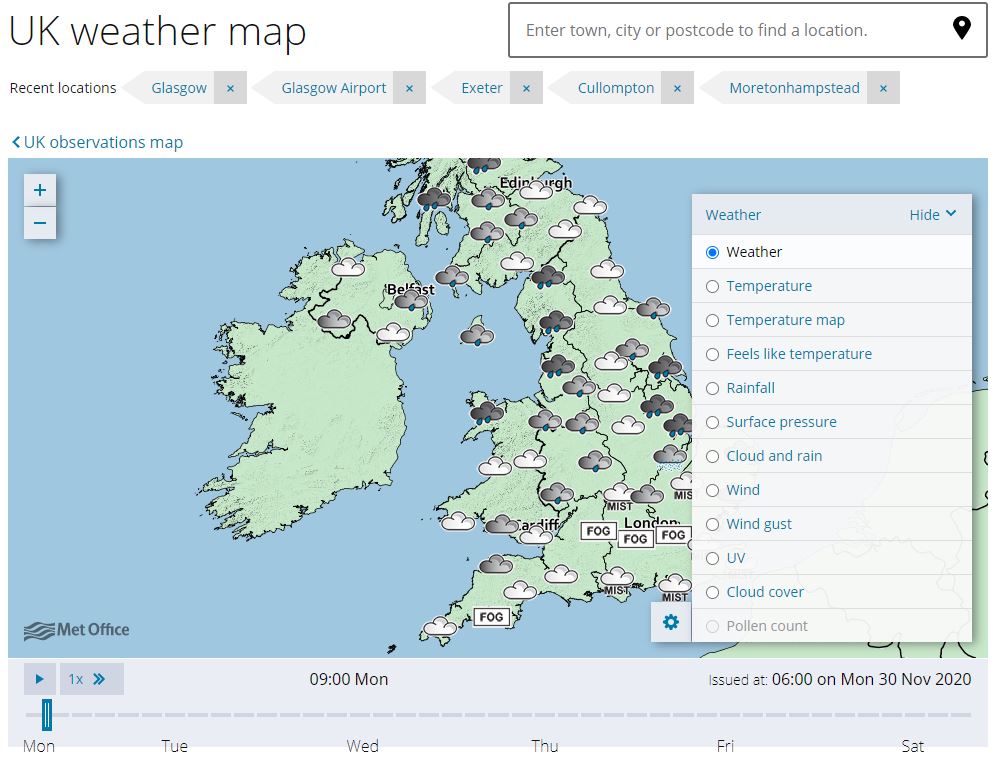
A key to the forecast layer is provided below the timeline if appropriate, you can also use our more Key to symbols and terms.
To display your chosen forecast, click on the 'Show' option in the bottom right corner of the weather map you are given a choice of 12 layers including rainfall radar, cloud cover, wind and UV. Clicking on hide layers you are then able to see the complete map. You can pan and zoom around the map using the controls in the top left of the map or by using your mouse to click and drag the map and the mouse wheel to zoom in and out. Zooming in on a location will display additional location forecasts in that area.
To view the forecast for a particular time, click on the appropriate section of the time bar below the map. You can also animate your forecast using the play button. The timeline will vary depending on what forecast information is available for your chosen weather element. The time for which the forecast is valid is shown at the bottom right of the map below the map menu.
Forecast summary
Text forecasts are provided for the UK along with six regional forecasts within Scotland, eight regional forecasts within England and a forecast for both Wales and Northern Ireland.
Beneath the forecast timeline you will find the text forecast summary showing a detailed 'Regional forecast' for the area local to your chosen forecast site for the first two days, along with a UK forecast for the next 5 days and an outlook for the next 6-30 days. The outlook provides an indication of the main weather types and trends across the UK during the forecast period.
Click on one of the tabs to view the forecast for a particular time period.

If you want to view the forecast for another region, change your location.
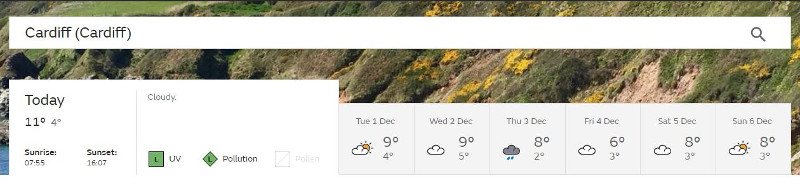
Changing location
To select a new location, enter a location (this could be a village, town or city) into the search box and click on your chosen location. You can also search for world forecast locations in the same way. Select your choice of forecast location from the list provided.
At the top of the forecast page you will see that the page has remembered your 'Recent locations' and will show them in a drop-down list. The Met Office website will automatically remember the three forecast sites you have most recently visited both here and on the homepage with the most recent at the top of the list. Once you have visited more than three locations the first you have visited will drop off the list.
If you want to look at yesterday's weather for any forecast site you simply click the blue link for the 'last 24 hours' and you are taken straight to the latest observations.
'Use my current location'
For web browsers that have geolocation capabilities, you can also use the 'use my current location' button to automatically determine your location.
More information on how your web browser can use geolocation:
- Does Firefox share my location with websites?
- Using location sharing in Google Chrome
- What is geolocation and why is it useful in Opera 10.6
- Location services in Internet Explorer 9.0
- About location services in Safari