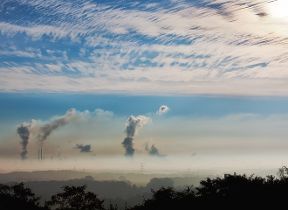
Mauna Loa carbon dioxide forecast for 2021
Forecast of the annual rise in atmospheric carbon dioxide concentration measured at the Mauna Loa, Hawaii for 2021
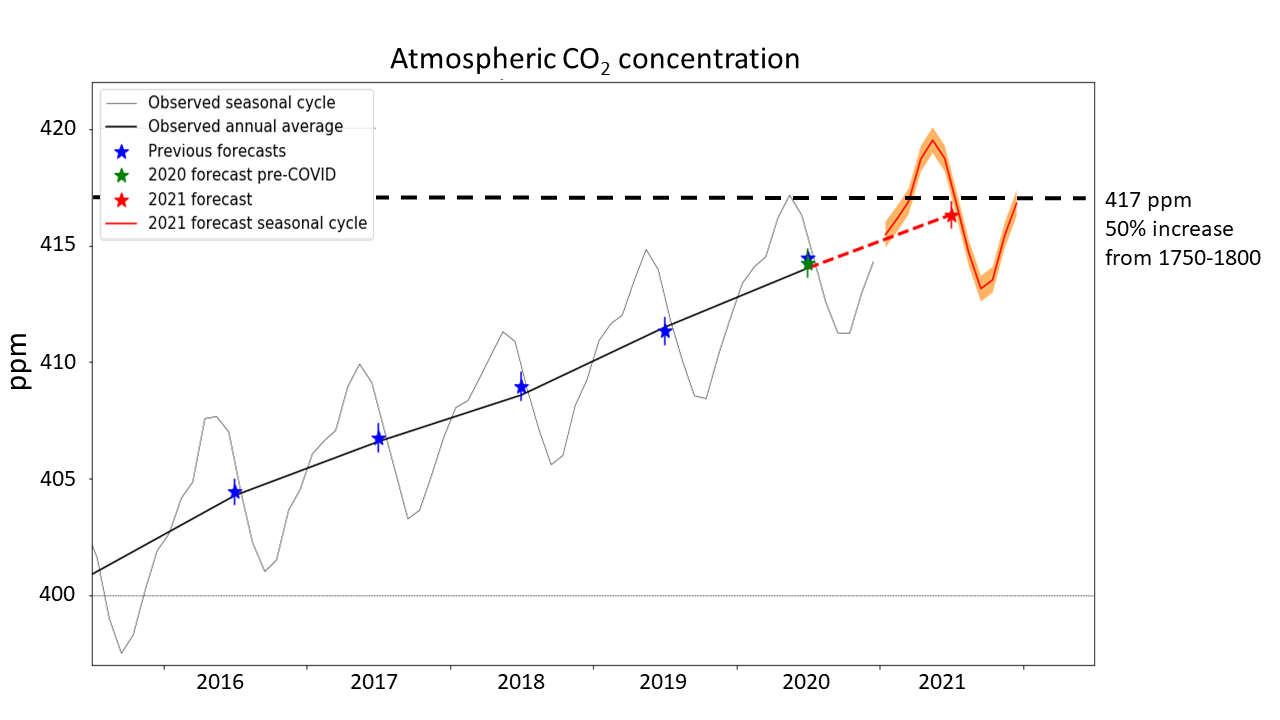

Table 1. Forecast monthly average CO2 concentrations at Mauna Loa in 2021. The 2 standard deviations uncertainty is ± 0.6 ppm
| Month | Forecast CO2 concentration (ppm) |
|---|---|
| January | 415.5 |
| February | 416.2 |
| March | 416.9 |
| April | 418.7 |
| May | 419.5 |
| June | 418.7 |
| July | 416.8 |
| August | 414.7 |
| September | 413.2 |
| October | 413.5 |
| November | 415.5 |
| December | 416.8 |
Despite the smaller rise expected in 2021, CO2 concentrations are still increasing and will once again reach the highest values on record. This year atmospheric CO2 will spend several weeks at levels more than 50% higher than when humanity began large-scale burning of fossil fuels in the industrial revolution in the late 18th Century. Ice core records show that the average CO2 concentration for 1750 -1800 was 278 ppm. A 50% increase on this (417 ppm) is predicted to be exceeded by the monthly average values in April, May and June, and possibly by daily values in March. Daily concentrations above this level were measured at Mauna Loa during May 2020, but 2021 will be the first year with these levels exceeded consecutively for longer than a few days.
This 50% increase above pre-industrial is of symbolic importance because it represents half-way towards "doubled CO2", a standard level of climate forcing used for quantifying the response of global temperatures to human-caused increases in greenhouse gases. Although "halfway to doubled CO2" not of any physical significance, it can nevertheless be considered a milestone that highlights how much humans have already altered the composition of the global atmosphere and increased the amount of a gas that warms the global climate.
Despite being a La Niña year with a relatively small CO2 increase compared to recent years, the central estimate of the forecast CO2 rise of 2.29 ppm for 2021 would be the tenth largest annual increment in the Mauna Loa record of 64 years (Figure 3). Considering the uncertainty range of ± 0.55 ppm, it would be between the 4th and 28th largest annual increments. The relatively high ranking in the series is because annual increments have generally been increasing over time as a result of rising anthropogenic emissions.

Figure 3. The central estimate of the CO2 rise forecast for 2020-2021 in the context of the frequency distribution of the observed annual rise for each year in the Mauna Loa record. The horizontal red bar shows the forecast uncertainty range of ± 0.55 ppm.
Verification of previous CO2 forecasts
The technique used to make this forecast was also used to make forecasts ahead of time for 2016, 2017, 2018, 2019 and 2020. We also issued an updated forecast for 2020 once it became clear that the response to the pandemic would cause global CO2 emissions to be much smaller than expected.
Our usual methodology uses a statistical relationship between the annual CO2 rise, human-caused emissions and changes in sea surface temperature (SST) in the equatorial Pacific Ocean as a measure of the strength of the dominant pattern of natural climate variability that is known to affect the strength of carbon sinks. We use an average of SSTs from ocean observations in recent months and seasonal forecasts for the coming months.
From 2016 to 2019, our forecasts included the assumption that the emissions in the coming year would be the same as the previous year, as normally the year-by-year changes in emissions are not large enough to affect the forecast substantially. Our original forecast for 2020 also made this assumption, while our revised 2020 forecast included an adjustment based on projected emissions profiles across the year applied to an atmospheric transport model.
Table 2 compares the original and updated 2020 forecasts of annual average CO2 rise, and annual, May and September concentrations with measurements at Mauna Loa, along with forecasts and observations from previous years. Figure 4 and Table 3 compare the original and updated 2020 forecasts with observations for each month.
Table 2. Summary of forecast and observed CO2 concentrations and rises for 2016, 2017, 2018, 2019 and 2020, and the forecast for 2021. For 2020, both the original forecast and the revised forecast accounting for the Covid-related emissions reductions are shown. Where observations were within the error estimates of the forecast, this is underlined. Where observations are outside the error estimates, this is shown in italics.
|
Annual mean CO2 concentration (ppm) |
Increase from previous year (ppm) |
May concentration (ppm) |
September concentration (ppm) |
|||||
|---|---|---|---|---|---|---|---|---|
|
Year |
forecast |
observed |
forecast |
observed |
forecast |
observed |
forecast |
observed |
| 2021 | 416.3 ± 0.6 | 2.29±0.55 | 419.5 ± 0.6 | 413.2 ± 0.6 | ||||
| 2020 (updated with Covid emissions reductions) | 414.0 ± 0.6 | 414.01 | 2.48±0.57 | 2.52 | 417.1±0.6 | 417.16 | 410.6±0.6 | 411.25 |
|
2020 (original) |
414.2 ± 0.6 |
414.01 |
2.74±0.57 |
2.52 |
417.4±0.6 |
417.16 |
411.0±0.6 |
411.25 |
|
2019 |
411.3±0.6 |
411.49 |
2.74±0.58 |
2.90 |
414.7±0.6 |
414.83 |
408.1±0.6 |
408.55 |
|
2018 |
408.9±0.6 |
408.59 |
2.29±0.59 |
2.00 |
412.2±0.6 |
411.31 |
405.8±0.6 |
405.59 |
|
2017 |
406.8±0.6 |
406.59 |
2.46±0.61 |
2.31 |
409.9±0.6 |
409.91 |
403.7±0.6 |
403.27 |
|
2016 |
404.5±0.5 |
404.28 |
3.15±0.53 |
3.39 |
407.6±0.5 |
407.65 |
401.5±0.5 |
401.01 |
Both the original and updated 2020 forecasts agree with the observed annual mean within the uncertainty of 0.6 ppm, but the central estimate of the updated forecast was closer to the observed value. The updated forecast was also more accurate for monthly values from March to June and October to December. In August and September, the original forecast was more accurate, with the observed value falling outside the published uncertainty range for the updated forecast but within the range for the original.
Unusually, the observed minimum monthly CO2 concentration in 2020 occurred in October rather than September. This may have been a result of the large wildfires in California and shifts in the wind direction. In August and early September, air arriving at Mauna Loa is typically dominated by the easterly trade winds, so the winds would have been carrying air from western North America which could have been anomalously high in CO2. This would have contributed to higher CO2 concentrations at Mauna Loa than would normally have been expected in the typical seasonal cycle. Although the California wildfires continued through October and November, Mauna Loa is dominated by westerly winds by then, so would not be immediately affected by wildfire emissions in North America.
In our forecast we had assigned the same uncertainty to monthly and annual values, but this ignores the role of within-year impacts such as periods of fire activity in areas not typically affected by ENSO, or anomalous wind directions. Quantification of these additional sources of uncertainty at monthly levels are a topic of ongoing research.

Figure 4. Comparison of original (dashed red line) and updated (solid red line) forecasts of monthly CO2 concentrations at Mauna Loa with measurements from the Scripps Institution for Oceanography (black line).
Table 3. Forecast monthly average CO2 concentrations at Mauna Loa over 2020. The uncertainty in the forecast values was ±0.6 ppm
| Month | Original forecast (ppm) | Updated forecast (ppm) | Observations (ppm) |
|---|---|---|---|
| January | 413.4 | 413.4 | 413.4 |
| February | 414.0 | 414.0 | 414.1 |
| March | 414.9 | 414.8 | 414.5 |
| April | 416.8 | 416.6 | 416.2 |
| May | 417.4 | 417.1 | 417.2 |
| June | 416.7 | 416.3 | 416.3 |
| July | 414.7 | 414.3 | 414.5 |
| August | 412.6 | 412.2 | 412.6 |
| September | 411.0 | 410.6 | 411.3 |
| October | 411.5 | 411.1 | 411.2 |
| November | 413.3 | 413.0 | 413.0 |
| December | 414.7 | 414.3 | 414.0 |
Contributions of anthropogenic emissions and varying natural carbon sinks to the CO2 rise
Long-term increases in observed CO2 are entirely the result of human-caused emissions of carbon dioxide into the atmosphere – more than enough CO2 has been emitted by fossil fuel burning, cement production and deforestation to account for the increase measured in the atmosphere. Although CO2 concentrations have now increased by about 50% since the industrial revolution, this increase would have been almost twice as large if some CO2 had not been removed from the atmosphere through being absorbed by plants and the oceans.
These natural sinks of carbon vary in strength from year to year as a result of short-term fluctuations in climate, principally through El Niño Southern Oscillation (ENSO) cycles in the Tropical Pacific Ocean. The Met Office CO2 forecast therefore takes account of both anthropogenic emissions and the impacts of climate variability on natural carbon sinks. So far, including the effect of ENSO variability has in all years brought the central value of the CO2 rise forecast closer to the observations than when considering anthropogenic emissions alone (Figure 5).

Figure 5. Observed (black) and forecast (dark blue) annual average CO2 concentrations for 2016, 2017, 2018, 2019 and 2020, and re-forecast values based on emissions alone, without the effects of ENSO (light blue). Thin black lines show the forecast uncertainty range (2 standard deviations).
Consideration of the large El Niño event that developed in 2015 allowed the record rise in atmospheric CO2 from 2015 to 2016 to be successfully forecast. El Niño conditions were linked with hotter, drier conditions in many parts of the tropics. These temporarily weakened tropical land carbon sinks, causing less CO2 to be removed from the atmosphere by natural processes and temporarily accelerating the build-up in the atmosphere. The 2016 rise would have been underestimated without including this. The annual rise in other years was also more accurately predicted when taking into account the effects of ENSO (Figure 5).
Similarly, the 2020 CO2 rise would have been underestimated in the updated forecast if the effects of the mild El Niño conditions had been neglected. This appears to have largely counteracted the effect of the emissions reductions that occurred in the first part of 2020 as a result of the pandemic.
We can estimate the potential contribution of La Niña conditions to the forecast CO2 rise by repeating our forecast calculation without the sea surface temperature change, ie: with "neutral" conditions. This suggests that without a La Niña response in the atmosphere and tropical land ecosystems, the forecast annual mean CO2 rise from 2020 to 2021 would be 2.49 ppm (Table 4).
We can also estimate what the CO2 rise would be if affected by emissions at 2020 levels. Using the 2020 total of 10.6 GtC and including the impact of La Niña, the forecast CO2 rise for 2019-2020 would be 2.10 ppm, 0.19 ppm smaller than the actual forecast (Table 4). From this it is clear that the year-to-year variability in the rate of rise of CO2 in the atmosphere is affected as much by the strength of carbon sinks as by the unexpectedly large reduction in anthropogenic emissions that occurred in 2020.
Nevertheless, the anthropogenic emissions are still the overall driver of the long-term rise in concentrations.
Table 4. CO2 rise (ppm) for 2020-2021 calculated with different combinations of El Niño-like sea surface temperature (SST) and emissions influences
| Annual emissions (GtC) |
CO2 rise (ppm) with La Niña SSTs |
CO2 rise (ppm) with Neutral SSTs |
|---|---|---|
|
11.5 (as 2019) |
2.29 |
2.49 |
|
10.6 (as 2020) |
2.10 |
Definitions of annual CO2 rise, increment and growth rate
We define the annual CO2 rise or annual increment for a particular year as the difference in annual average concentration for that calendar year and that of the previous calendar year. This is different to the definition of annual 'growth rate' as published by NOAA which is the average change across an individual calendar year.
Note added 4th April 2021: The Scripps Institution measurements quoted here are those reported prior to the move to a revised CO2 scale on 21st February 2010. As a result, the numbers quoted here differ from those now reported on the Scripps Institution Primary Mauna Loa CO2 Record by approximately 0.08 ppm.