Mauna Loa carbon dioxide forecast for 2018
Forecast of the annual rise in atmospheric carbon dioxide concentration measured at the Mauna Loa, Hawaii for 2018
The mean atmospheric carbon dioxide concentration will continue to rise in 2018 due to fossil fuel emissions. Although emissions were at record levels in 2017, the build-up in the atmospheric is likely to be smaller than in the last two years due to the moderating effect of La Niña conditions.
The average carbon dioxide concentration at Mauna Loa is forecast to be 2.29 ± 0.59 parts per million (ppm) higher in 2018 than in 2017. This will continue the rising trend seen in the long-term record of measurements from the Mauna Loa observatory in Hawaii that date back to 1958 and are a good guide to global CO2 levels. As a result, the 2018 annual average carbon dioxide concentration at Mauna Loa is forecast to be 408.9 ± 0.6 ppm.
Increases in observed CO2 (about 30% over the Mauna Loa record) are the result of emissions of man-made carbon dioxide into the atmosphere. Not all the emitted CO2 remains in the air, however, as some is absorbed by plants and the oceans. These natural sinks vary in strength from year to year as a result of short-term fluctuations in climate, principally through El Niño-La Niña cycles in the Tropical Pacific Ocean. As a result, the Met Office forecast takes account of both anthropogenic emissions and the variability of the climate in predicting CO2.
The rise from 2017 to 2018 is expected to be smaller than in the previous three years (Figure 1), because La Niña conditions over recent months are expected to have temporarily increased the removal of carbon dioxide from the atmosphere. This occurs because La Niña cools the ocean temperature and modifies tropical weather patterns, making many land regions wetter and allowing plants to grow better and absorb more CO2. 2016 saw a record rise due to a near-record El Niño event in addition to high emissions. Despite record emissions, La Niña conditions mean that the rise in 2018 is expected to be comparable to increases seen in the past 15 years.
If a large volcanic eruption were to inject aerosol particles into the stratosphere, this could lead to a temporary cooling of global temperatures and hence reduce the CO2 rise even further. With Mount Agung being one of several volcanos active in recent months, Figure 1 also illustrates the potential impact of a large eruption similar to that of 1963 if this were to take place again. Figure 1 also shows the impact of a hypothetical even larger eruption comparable to that of Mount Pinatubo in 1991. Note that these are not forecasts, but illustrations of potential effects if such eruptions were to take place.
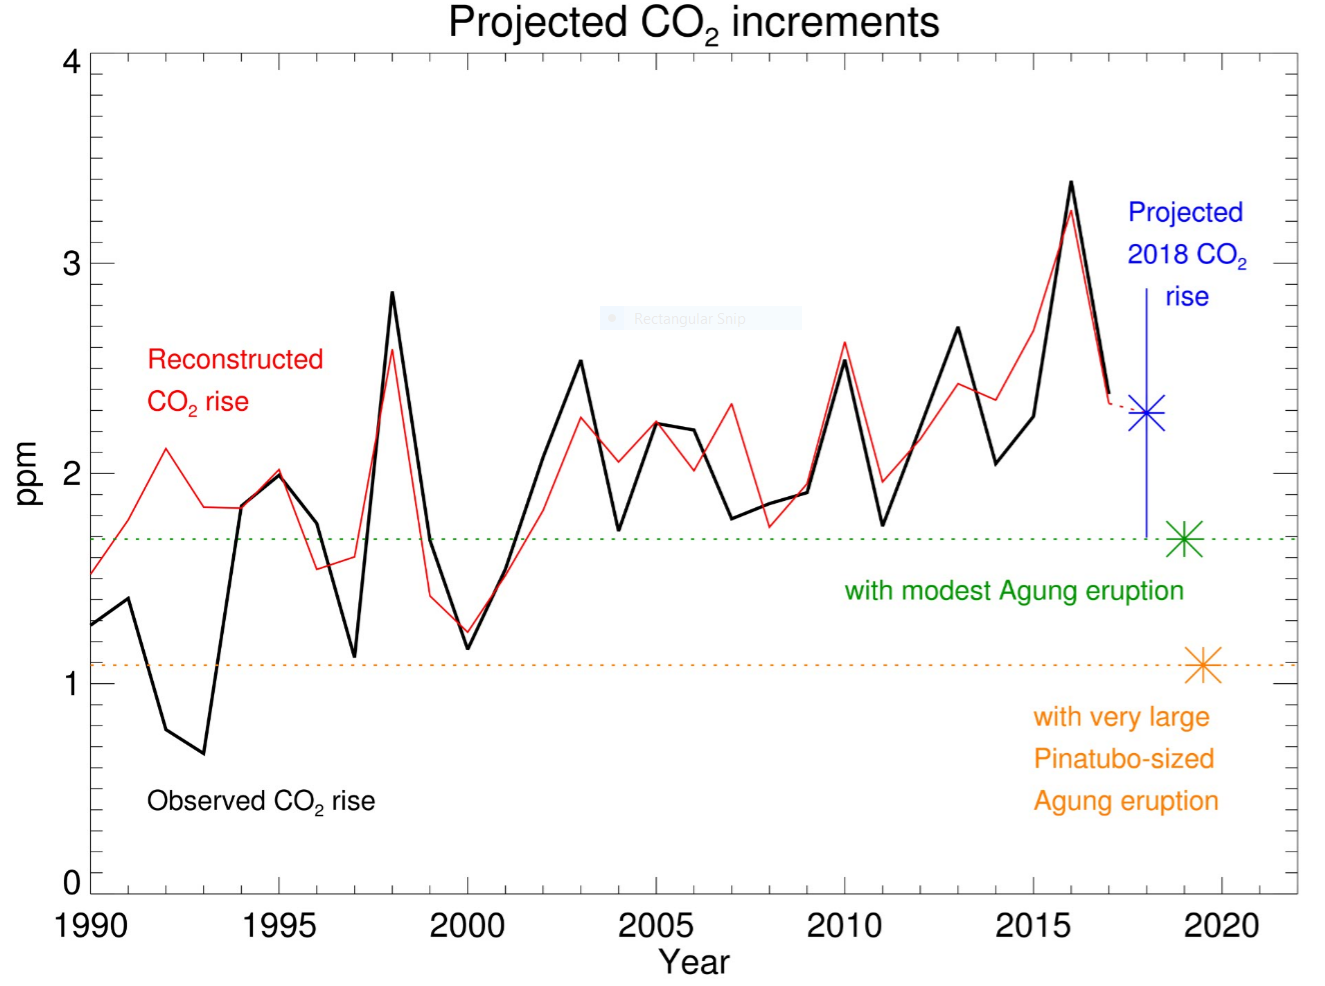 Figure 1. Forecast rise in CO2 concentration at the Mauna Loa observatory from 2017 to 2018 (blue), compared to past observations (black) and our statistical reconstruction (red). The forecast uncertainty range is ± 2 standard deviations. Also shown are scenarios of the CO2 rise that could be possible if Mount Agung erupts with similar impacts to its previous eruption in 1963 (green) and similar impacts to the 1991 Mount Pinatubo eruption (orange).
The carbon dioxide concentration also varies during the year due to uptake by ecosystems in the northern hemisphere spring and summer growing season and a release as vegetation dies back in autumn and winter. This seasonal cycle is forecast to peak at 412.2 ± 0.6 ppm in May and reach a minimum of 405.8 ± 0.6 ppm in September. (Figure 2, Table 1).
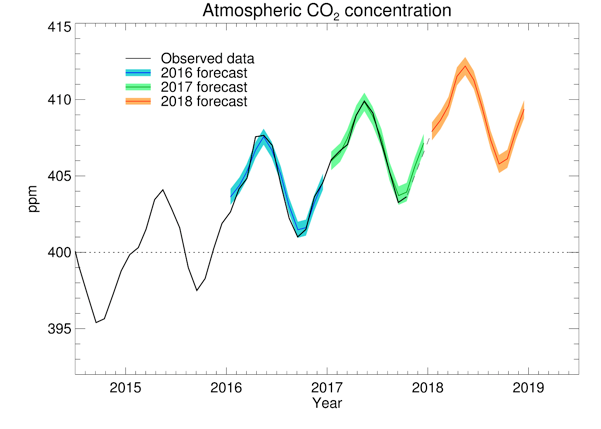 Figure 2. Forecast CO2 concentrations at Mauna Loa over 2018 (orange), along with previous forecast concentrations for 2016 (blue) and 2017 (green) and Scripps Institute measurements (black).
Table 1. Forecast monthly average CO2 concentrations at Mauna Loa over 2018
| Month | Forecast CO2 concentration (ppm) |
|---|---|
| January | 407.9 |
| February | 408.7 |
| March | 409.6 |
| April | 411.5 |
| May | 412.2 |
| June | 411.3 |
| July | 409.5 |
| August | 407.4 |
| September | 405.8 |
| October | 406.1 |
| November | 408.0 |
| December | 409.4 |
Verification of previous CO2 forecasts
The technique used to make this forecast was also used to make forecasts ahead of time for 2016 and 2017. The methodology combines ocean observations and seasonal forecasts with a statistical prediction of their impact on carbon sinks. When applied to latest estimates of fossil fuel burning, it gives us a predicted growth rate for the coming year. Figures 2 and 3 and Tables 2 and 3 provide a summary verification of our previous forecasts. The CO2 rise in 2016 was successfully forecast to be the largest on record (Table 3), due to the amplifying effects of the 2015/2016 El Niño event, and the rise in 2017 was also successfully forecast to be more moderate than the previous year. The observed annual mean rise in 2017 was smaller than the central estimate of the forecast, with most of the discrepancy being from September onwards (Figure 3). This may be due to the onset of La Niña conditions from September onwards – the experimental forecast method uses a statistical relationship with sea surface temperatures from the previous April to March, so did not include the period of the La Niña at the end of 2017. This may reveal a shortcoming in the method, which could be improved upon – further research is required.
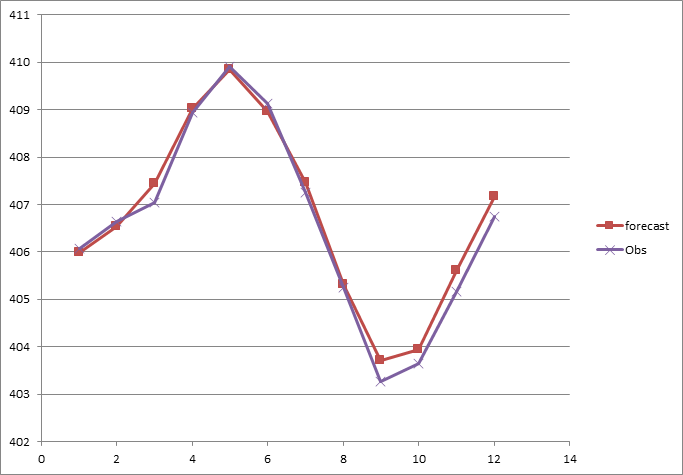
Figure 3. Monthly CO2 concentrations at Mauna Loa in 2017 from forecast (red) and observations (purple).
Table 2. Forecast and observed monthly average CO2 concentrations at Mauna Loa over 2017
| Year | Month | Forecast CO2 concentration (ppm) | Observed CO2 concentration (ppm) |
|---|---|---|---|
| 2017 | 1 | 406.0 | 406.1 |
| 2017 | 2 | 406.5 | 406.6 |
| 2017 | 3 | 407.4 | 407.1 |
| 2017 | 4 | 409.0 | 409.0 |
| 2017 | 5 | 409.9 | 409.9 |
| 2017 | 6 | 409.0 | 409.1 |
| 2017 | 7 | 407.5 | 407.3 |
| 2017 | 8 | 405.3 | 405.2 |
| 2017 | 9 | 403.7 | 403.3 |
| 2017 | 10 | 403.9 | 403.6 |
| 2017 | 11 | 405.6 | 405.2 |
| 2017 | 12 | 407.2 | 406.8 |
| 2017 | Average | 406.8 | 406.6 |
Table 3. Summary of forecast and observed CO2 concentrations and rises for 2016, 2017 and 2018
|
|
Annual mean CO2 concentration (ppm) |
Increase from previous year (ppm) |
May maximum (ppm) |
September minimum (ppm) |
||||
|
Year |
forecast |
observed |
forecast |
observed |
forecast |
observed |
forecast |
observed |
|
2018 |
408.94±0.59 |
|
2.29±0.59 |
|
412.20±0.59 |
|
405.79±0.59 |
|
|
2017 |
406.75±0.61 |
406.59 |
2.46±0.61 |
2.31 |
409.86±0.61 |
409.91 |
403.72±0.61 |
403.27 |
|
2016 |
404.45±0.53 |
404.28 |
3.15±0.53 |
3.39 |
407.57±0.53 |
407.65 |
401.48±0.53 |
401.01 |
Definitions of annual CO2 rise and growth rate
We define the annual CO2 rise for a particular year as the difference in annual average concentration for that calendar year and that of the previous calendar year. This is different to the definition of annual 'growth rate' as published by NOAA which is the average change across an individual calendar year.