Mauna Loa carbon dioxide forecast for 2019
Forecast of the annual rise in atmospheric carbon dioxide concentration measured at the Mauna Loa, Hawaii for 2019
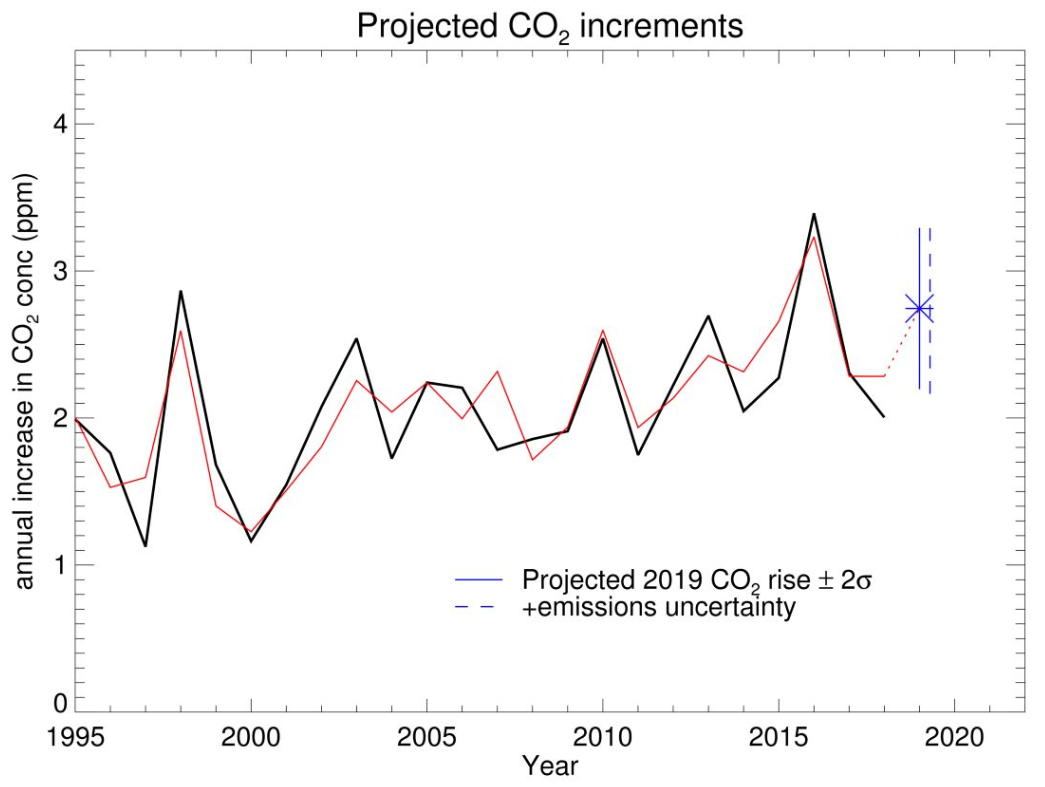
Figure 1. Forecast rise in CO2 concentration at the Mauna Loa observatory from 2018 to 2019 (blue), compared to the measured annual rise in previous years (black) and our statistical reconstruction of the past annual rises (red). The forecast uncertainty range based on the SST forecast is ± 2 standard deviations.
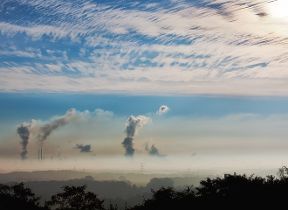
The size of the annual CO2 rise depends on anthropogenic emissions and the strength of natural carbon sinks which are affected by climate variability. Our method uses a statistical relationship between the annual CO2 rise, anthropogenic CO2 emissions and sea surface temperatures (SSTs) in the Niño3.4 region of the equatorial Pacific Ocean. We predict the rise between 2018 and 2019 will be larger than in the previous two years (Figure 1) because of relatively warm temperatures in the Niño3.4 region. Such "El Niño-like" conditions are generally associated with modified tropical weather patterns that make many land regions drier and reduce the ability of plants to grow and absorb CO2, temporarily reducing the removal of CO2 from the atmosphere. However, at the time of preparing this forecast, the atmospheric changes normally associated with higher Niño3.4 SSTs are not emerging clearly, so the impacts on the tropical land carbon sink may not be as large as would normally be expected. This is reflected in our uncertainty estimates.
Estimates from the Global Carbon Budget suggest that although fossil fuel emissions increased in 2018 compared to 2017, emissions from land use change declined by approximately the same amount. Therefore the total anthropogenic CO2 emissions did not change from 2017 to 2018, so have no impact on our forecast of a faster rise in concentrations in 2019 compared to last year. Nevertheless, the total emissions in 2017 and 2018 (11.3 GtC yr-1) were higher than the average over the previous decade (10.9 GtC yr-1), so this will have made a small contribution to a faster CO2 concentration rise compared to the decadal average.
The CO2 concentration at Mauna Loa also varies during the year due to uptake of CO2 by ecosystems in the northern hemisphere spring and summer growing season and a release of CO2 as vegetation dies back in autumn and winter. In 2019, assuming the usual atmospheric and land ecosystem response to the mild warming in the Pacific, we forecast this seasonal cycle is to peak at 414.7 ± 0.6 ppm in May and return to a minimum of 408.1 ± 0.6 ppm in September before rising again. (Figure 2, Table 1).
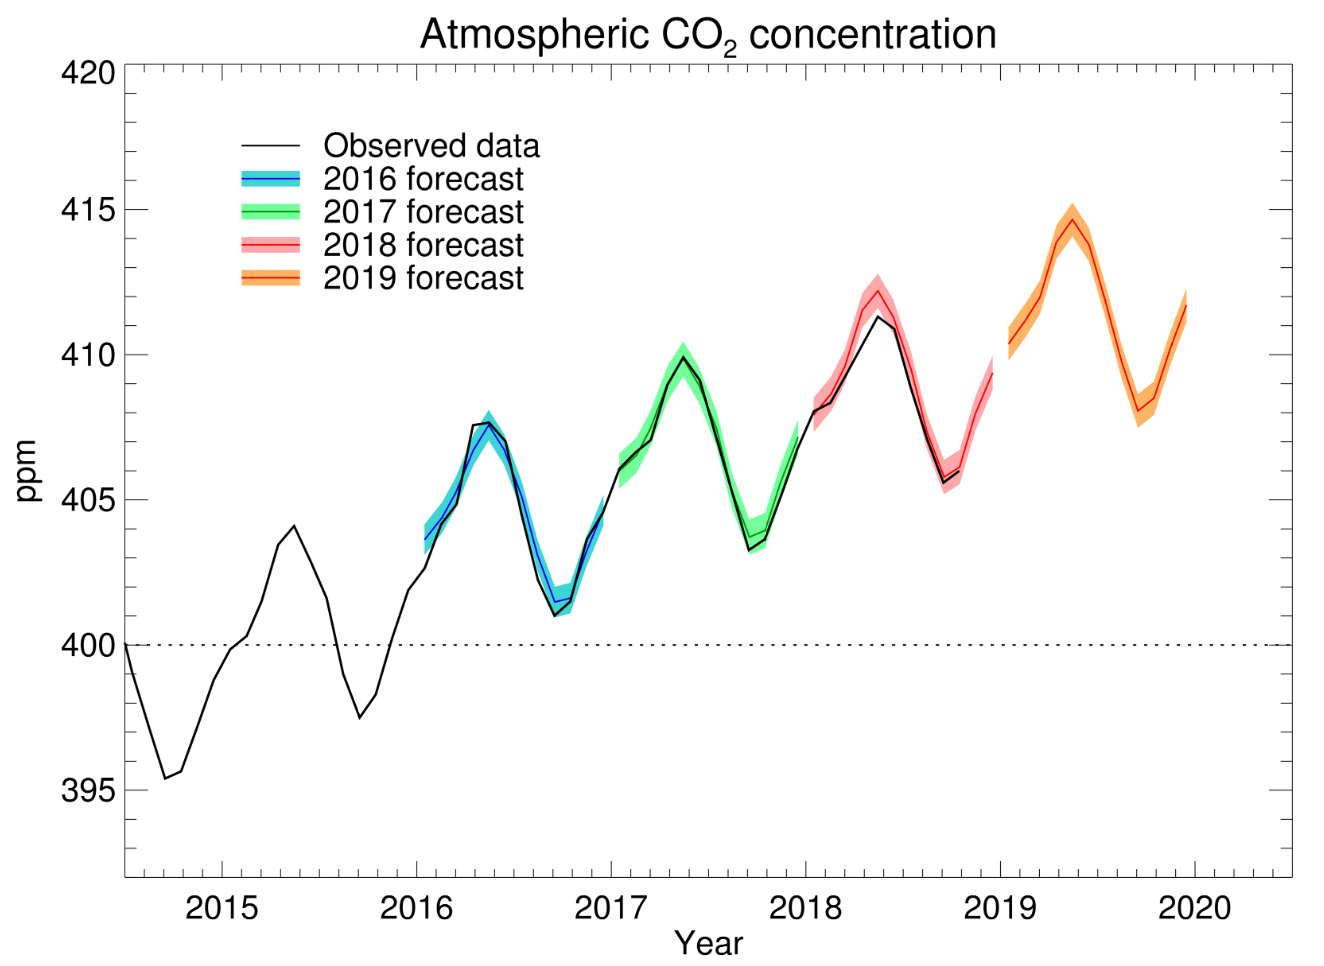 Figure 2. Forecast CO2 concentrations at Mauna Loa over 2018 (orange), along with previous forecast concentrations for 2016 (blue) and 2017 (green) and Scripps Institute measurements (black).
Table 1. Forecast monthly average CO2 concentrations at Mauna Loa over 2019
| Month | Forecast CO2 concentration (ppm) |
|---|---|
| January | 410.4 |
| February | 411.2 |
| March | 412.0 |
| April | 413.9 |
| May | 414.7 |
| June | 413.8 |
| July | 411.9 |
| August | 409.8 |
| September | 408.1 |
| October | 408.5 |
| November | 410.2 |
| December | 411.7 |
Contributions of anthropogenic emissions and varying natural carbon sinks to the CO2 rise
Long-term increases in observed CO2 are entirely the result of human-caused emissions of carbon dioxide into the atmosphere – more than enough CO2 has been emitted by fossil fuel burning, cement production and deforestation to account for the increase measured in the atmosphere. CO2 concentrations have increased by about 30% since measurements began at Mauna Loa, but this increase would have been larger if some CO2 had not been removed from the atmosphere by absorbed by plants and the oceans.
These natural sinks vary in strength from year to year as a result of short-term fluctuations in climate, principally through El Niño-La Niña cycles in the Tropical Pacific Ocean. As a result, the Met Office CO2 forecast takes account of both anthropogenic emissions and the impacts of climate variability on natural carbon sinks. Our forecast for the 2018-2019 CO2 rise uses the annual total emissions from 2018 and sea surface temperatures observed from April to October 2018 and forecast from November 2018 to March 2019.
We can estimate the potential contribution of El Niño-like conditions to the forecast CO2 rise by repeating our forecast calculation without the sea surface temperature change, ie: with "neutral" conditions. This suggests that without an El Niño-like response in the atmosphere and tropical land ecosystems, the annual mean CO2 rise would be 2.45 ppm (Table 2). We can also estimate the contribution of the higher emissions in 2018 compared to the average of the previous decade. If 2018 emissions had been at the average for 2008-2017, our forecast CO2 rise for 2018-2019 would be 0.1 ppm smaller (Table 2). From this it is clear that the year-to-year variability in the CO2 concentration rise is affected more by the strength of carbon sinks than year-to-year changes in anthropogenic emissions. (Nevertheless, the anthropogenic emissions are still the overall driver of the increase in concentrations.)
Table 2. CO2 rise (ppm) for 2018-2019 calculated with different combinations of El Niño-like sea surface temperature (SST) and emissions influences
| El Niño-like SSTs |
Neutral SSTs |
|
|---|---|---|
|
2018 emissions |
2.75 | 2.45 |
|
Average 2008-2017 emissions |
2.65 | 2.35 |
Verification of previous CO2 forecasts
The technique used to make this forecast was also used to make forecasts ahead of time for 2016, 2017 and 2018. The methodology combines ocean observations and seasonal forecasts with a statistical prediction of their impact on carbon sinks. When applied to latest estimates of fossil fuel burning, it gives us a predicted growth rate for the coming year. Figures 2 and 3 and Tables 3 and 4 provide a summary verification of our previous forecasts. The CO2 rise in 2016 was successfully forecast to be the largest on record (Table 3), due to the amplifying effects of the large 2015/2016 El Niño event, and the rises in 2017 and 2018 were also successfully forecast to be more moderate.
Table 3. Summary of forecast and observed CO2 concentrations and rises for 2016, 2017 and 2018, and the forecast for 2019. Where observations were within the error estimates of the forecast, this is underlined. Where observations are outside the error estimates, this is shown in italics.
|
Annual mean CO2 concentration (ppm) |
Increase from previous year (ppm) |
May maximum (ppm) |
September minimum (ppm) |
|||||
|
Year |
forecast |
observed |
forecast |
observed |
forecast |
observed |
forecast |
observed |
| 2019 | 411.3±0.58 | 2.74±0.58 | 414.7±0.58 | 408.1±0.58 | ||||
|
2018 |
408.94±0.59 |
408.59 |
2.29±0.59 |
2.00 |
412.20±0.59 |
411.31 |
405.79±0.59 |
405.59 |
|
2017 |
406.75±0.61 |
406.59 |
2.46±0.61 |
2.31 |
409.86±0.61 |
409.91 |
403.72±0.61 |
403.27 |
|
2016 |
404.45±0.53 |
404.28 |
3.15±0.53 |
3.39 |
407.57±0.53 |
407.65 |
401.48±0.53 |
401.01 |
The observed annual mean rise in 2018 was 0.29 ppm smaller than the central estimate of the forecast, within the uncertainty of 0.59 ppm. The largest discrepancy was in the first half of the year (Figure 3, Table 4). Further research on the reasons for this is required.
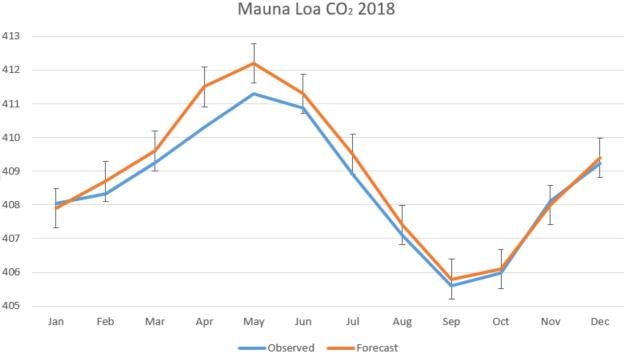
Figure 3. Monthly CO2 concentrations at Mauna Loa in 2018 from forecast (orange) and observations (blue)
Table 4. Forecast monthly average CO2 concentrations at Mauna Loa over 2018. The uncertainty in the forecast values was ±0.6 ppm
| ar | Month | Forecast CO2 concentration (ppm) |
Observed CO2 concentration (ppm) |
|---|---|---|---|
| 2018 | 1 | 407.9 | 408.1 |
| 2018 | 2 | 408.7 | 408.3 |
| 2018 | 3 | 409.6 | 409.3 |
| 2018 | 4 | 411.5 | 410.3 |
| 2018 | 5 | 412.2 | 411.3 |
| 2018 | 6 | 411.3 | 410.9 |
| 2018 | 7 | 409.5 | 408.9 |
| 2018 | 8 | 407.4 | 407.1 |
| 2018 | 9 | 405.8 | 405.6 |
| 2018 | 10 | 406.1 | 406 |
| 2018 | 11 | 407.9 | 408.1 |
| 2018 | 12 | 409.4 | 409.2 |
| 2018 | Average | 408.9 | 408.6 |
Definitions of annual CO2 rise and growth rate
We define the annual CO2 rise for a particular year as the difference in annual average concentration for that calendar year and that of the previous calendar year. This is different to the definition of annual 'growth rate' as published by NOAA which is the average change across an individual calendar year.