Temperature change in WMO RA I - Africa
The temperature anomaly for 2021 was between 0.55 and 1.04 °c above the 1981-2010 average depending on the data set considered. the mean of the 6 data sets is 0.71 °c. 2021 was between the 1st and 4th warmest year on record depending on the data set considered (of 6 datasets).
The temperature anomaly relative to 1961-1990 for 2021 was between 1.03 and 1.23 °c above the 1961-1990 average depending on the data set considered. the mean of the 5 data sets is 1.12 °c. . Note that the range and mean of anomalies relative to the two
different baselines are based on different sets of data as anomalies relative to 1961-1990 cannot be computed for ERA5 which starts in 1979.
This can lead to apparent inconsistencies.
In WMO RA-I, there is generally good agreement between the data sets, at a continental level, with the agreement
improving generally over time.
Note that all WMO RAs have warmed as fast as, or faster than the global average. This is consistent with the
IPCC SR on Climate Change and Land, which showed that land areas have consistently warmed faster than the global average.
Predominantly tropical areas have warmed more slowly than higher-latitudes regions such as Europe and Asia.
pdf version of time series.
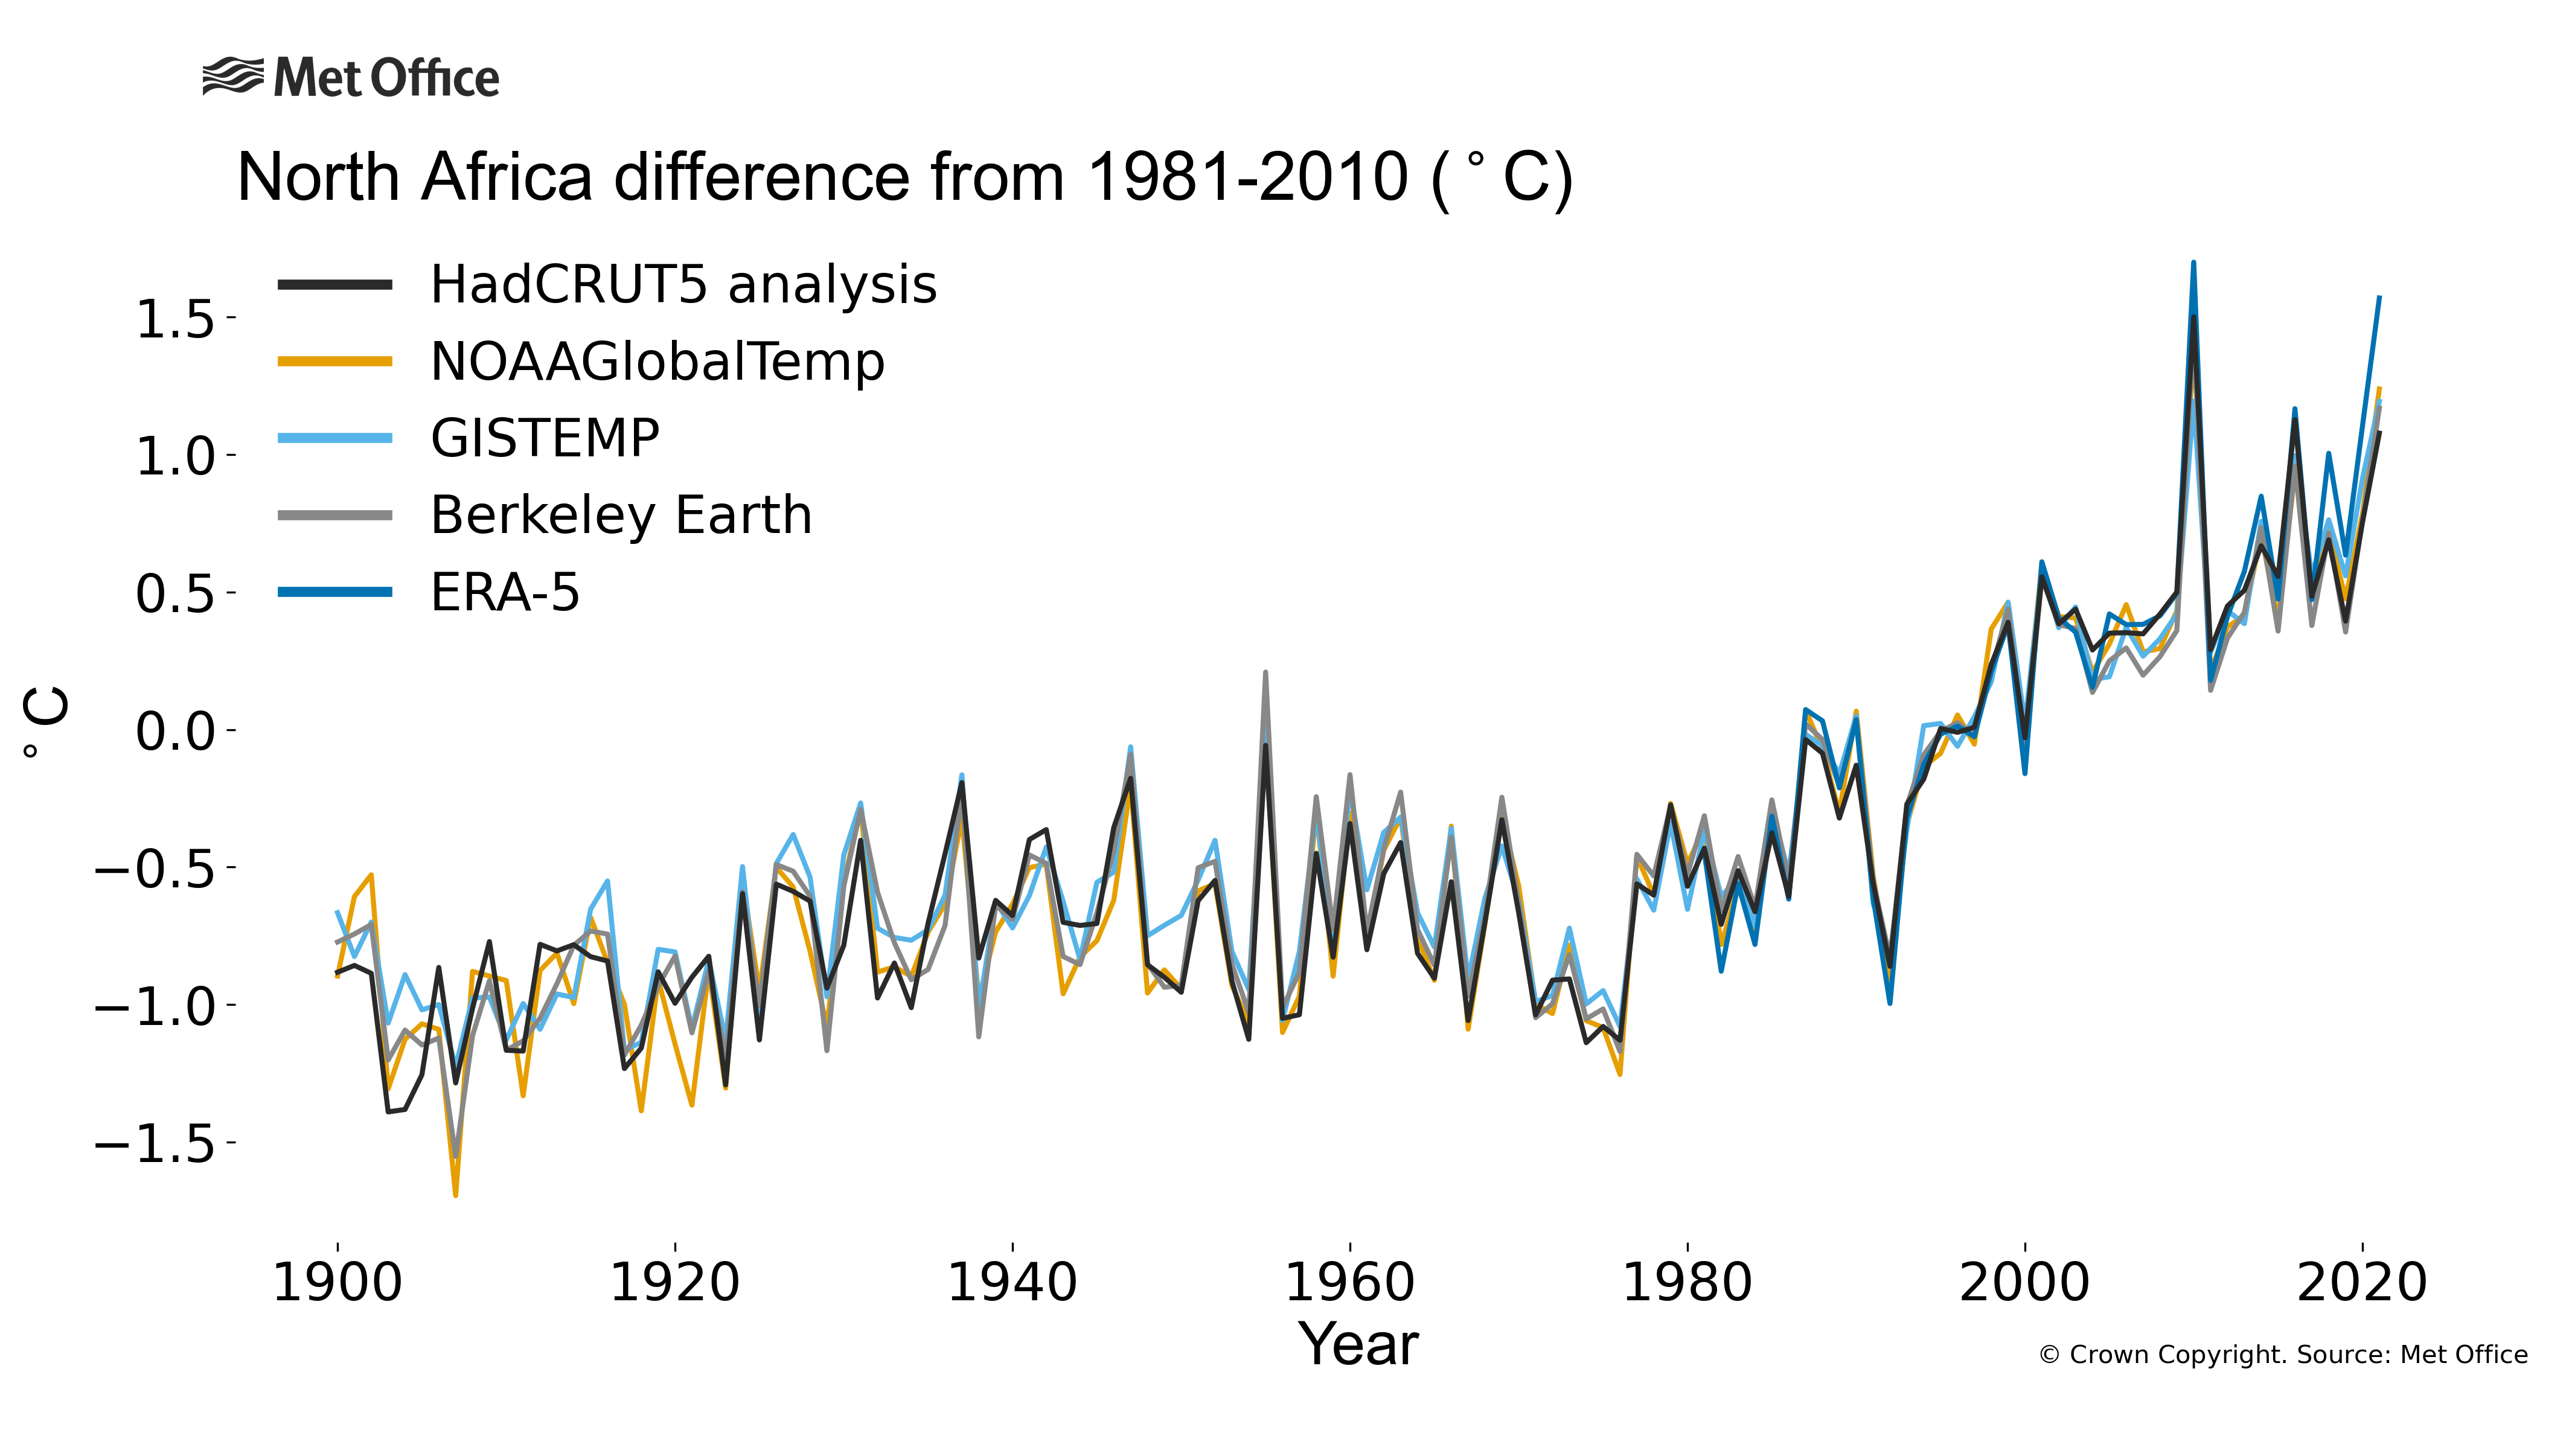
North Africa: The temperature anomaly for 2021 was between 1.08 and 1.57 °c above the 1981-2010 average depending on the data set considered. the mean of the 5 data sets is 1.25 °c. The temperature anomaly relative to 1961-1990 for 2021 was between 1.71 and 1.83 °c above the 1961-1990 average depending on the data set considered. the mean of the 4 data sets is 1.76 °c. Time series figure: png pdf
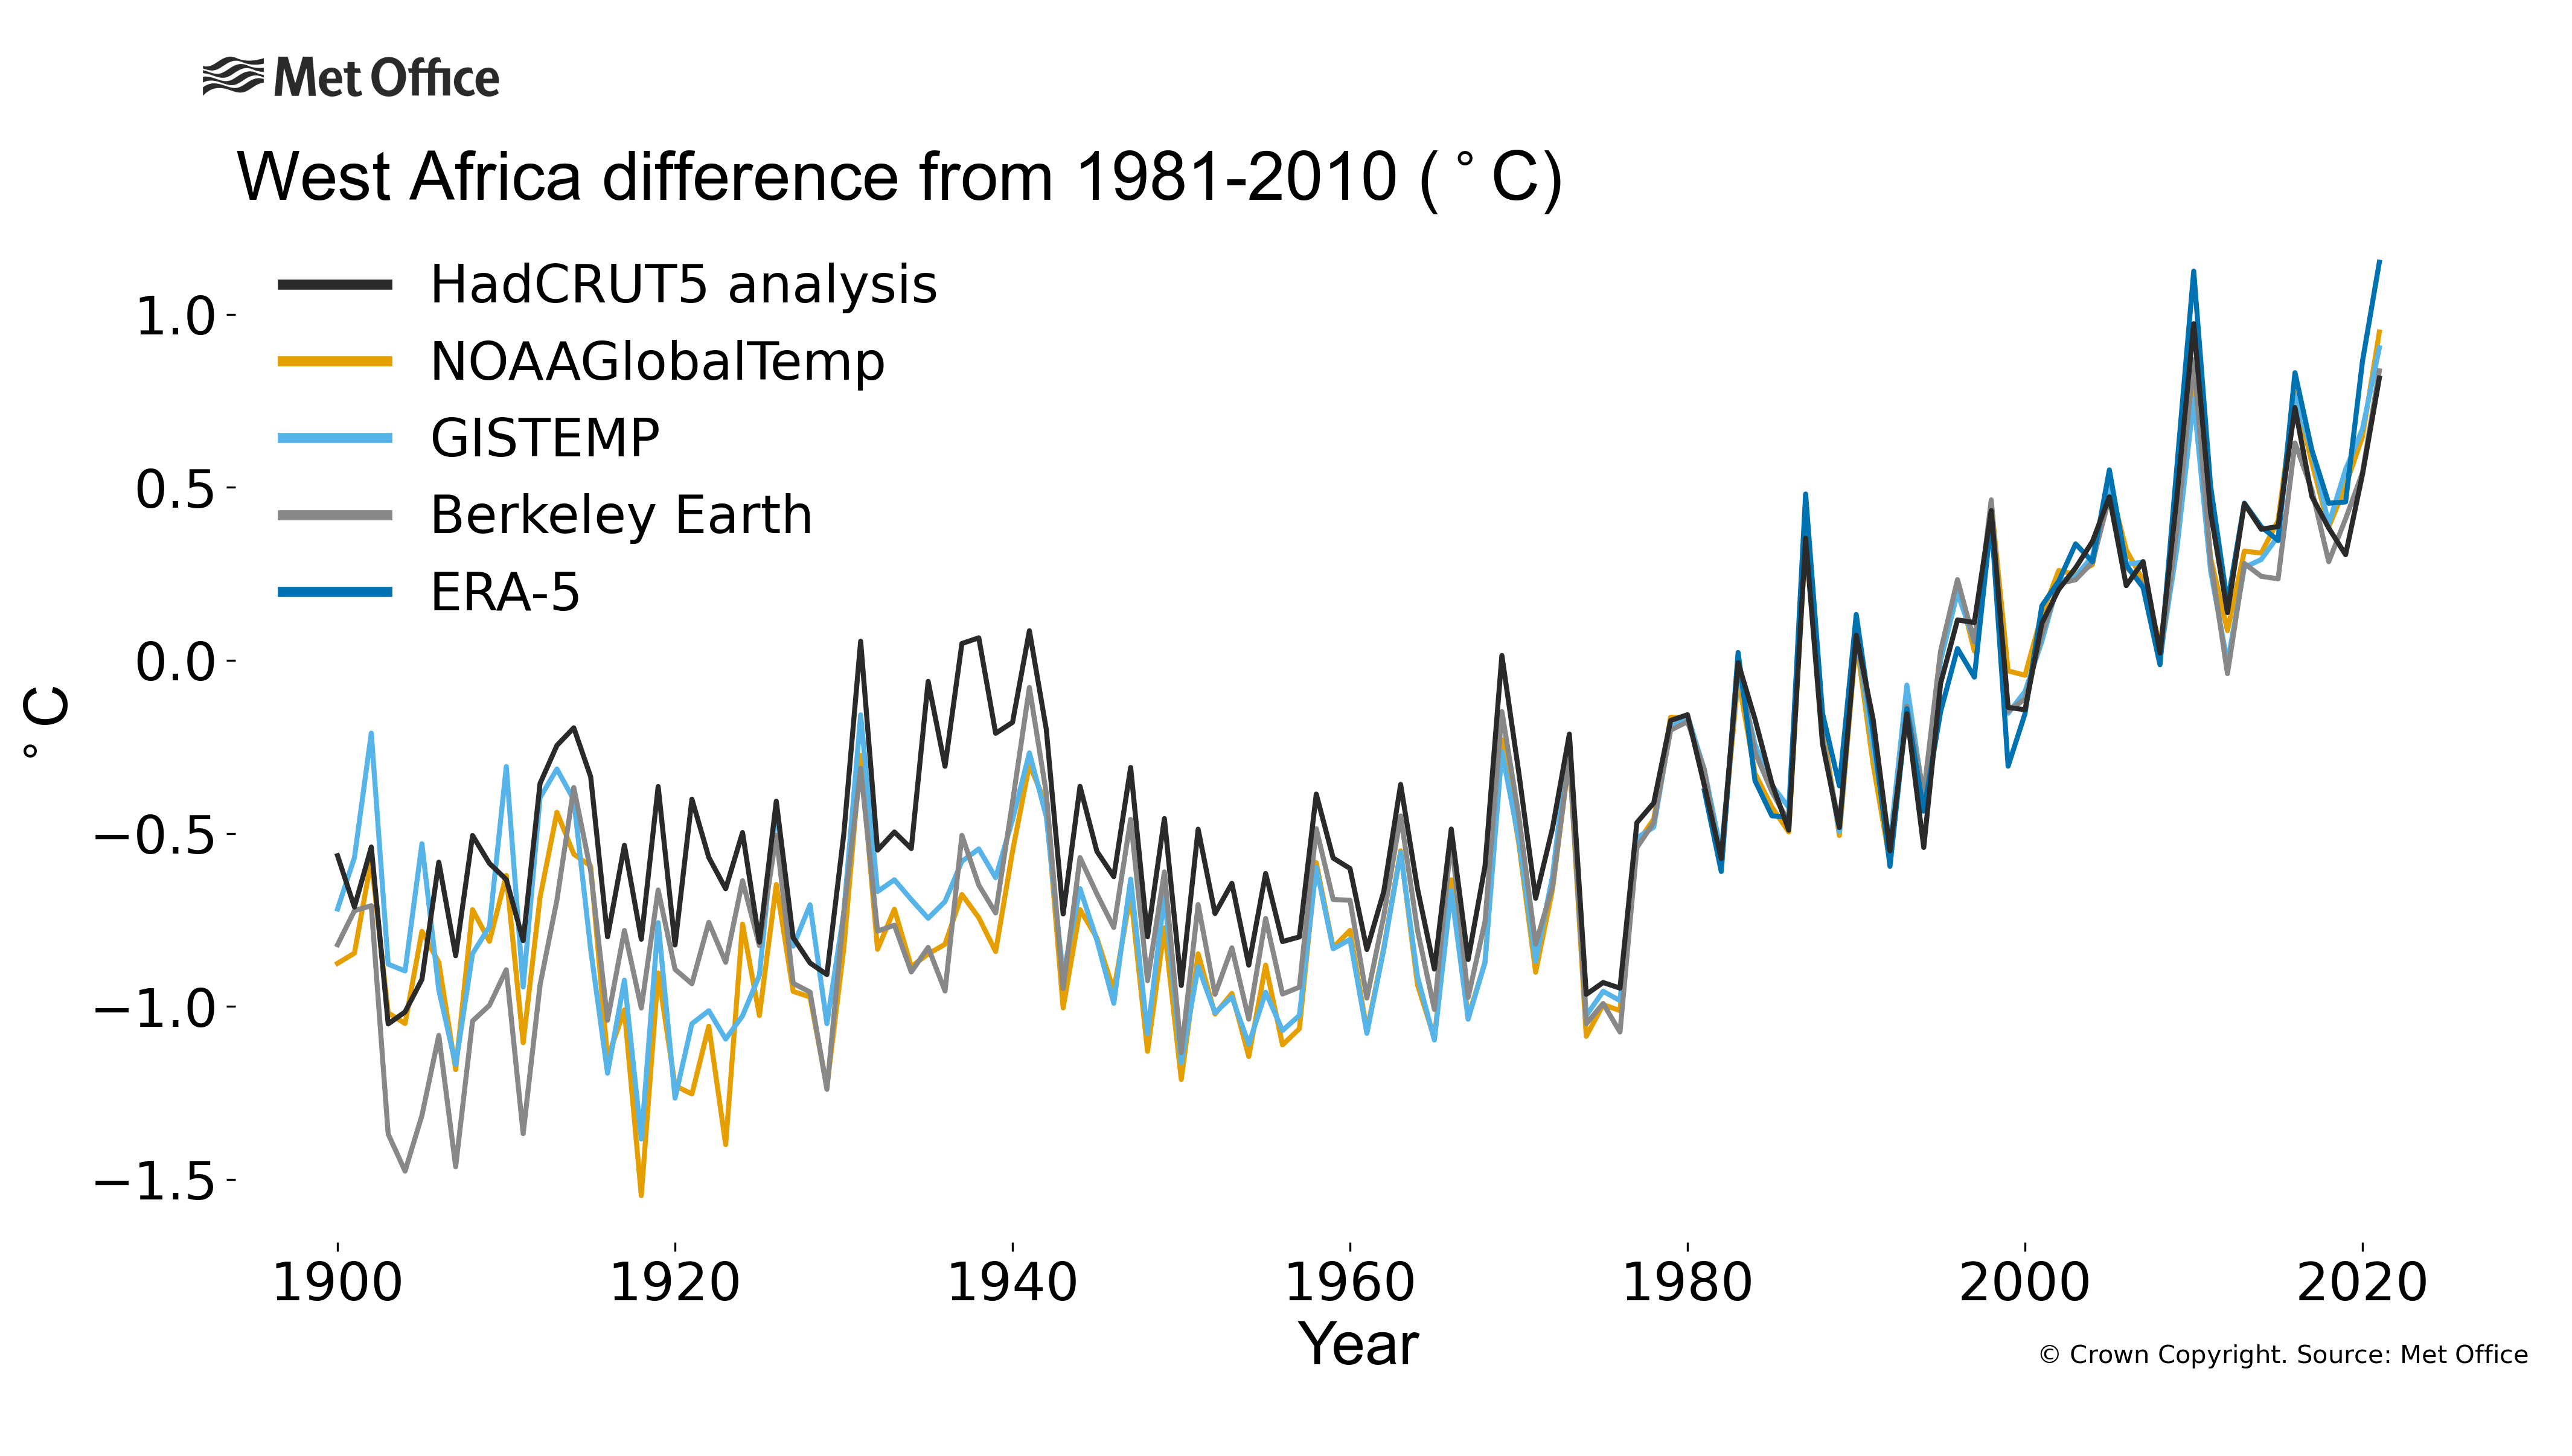
West Africa: The temperature anomaly for 2021 was between 0.82 and 1.15 °c above the 1981-2010 average depending on the data set considered. the mean of the 5 data sets is 0.93 °c. The temperature anomaly relative to 1961-1990 for 2021 was between 1.26 and 1.50 °c above the 1961-1990 average depending on the data set considered. the mean of the 4 data sets is 1.39 °c. Time series figure: png pdf
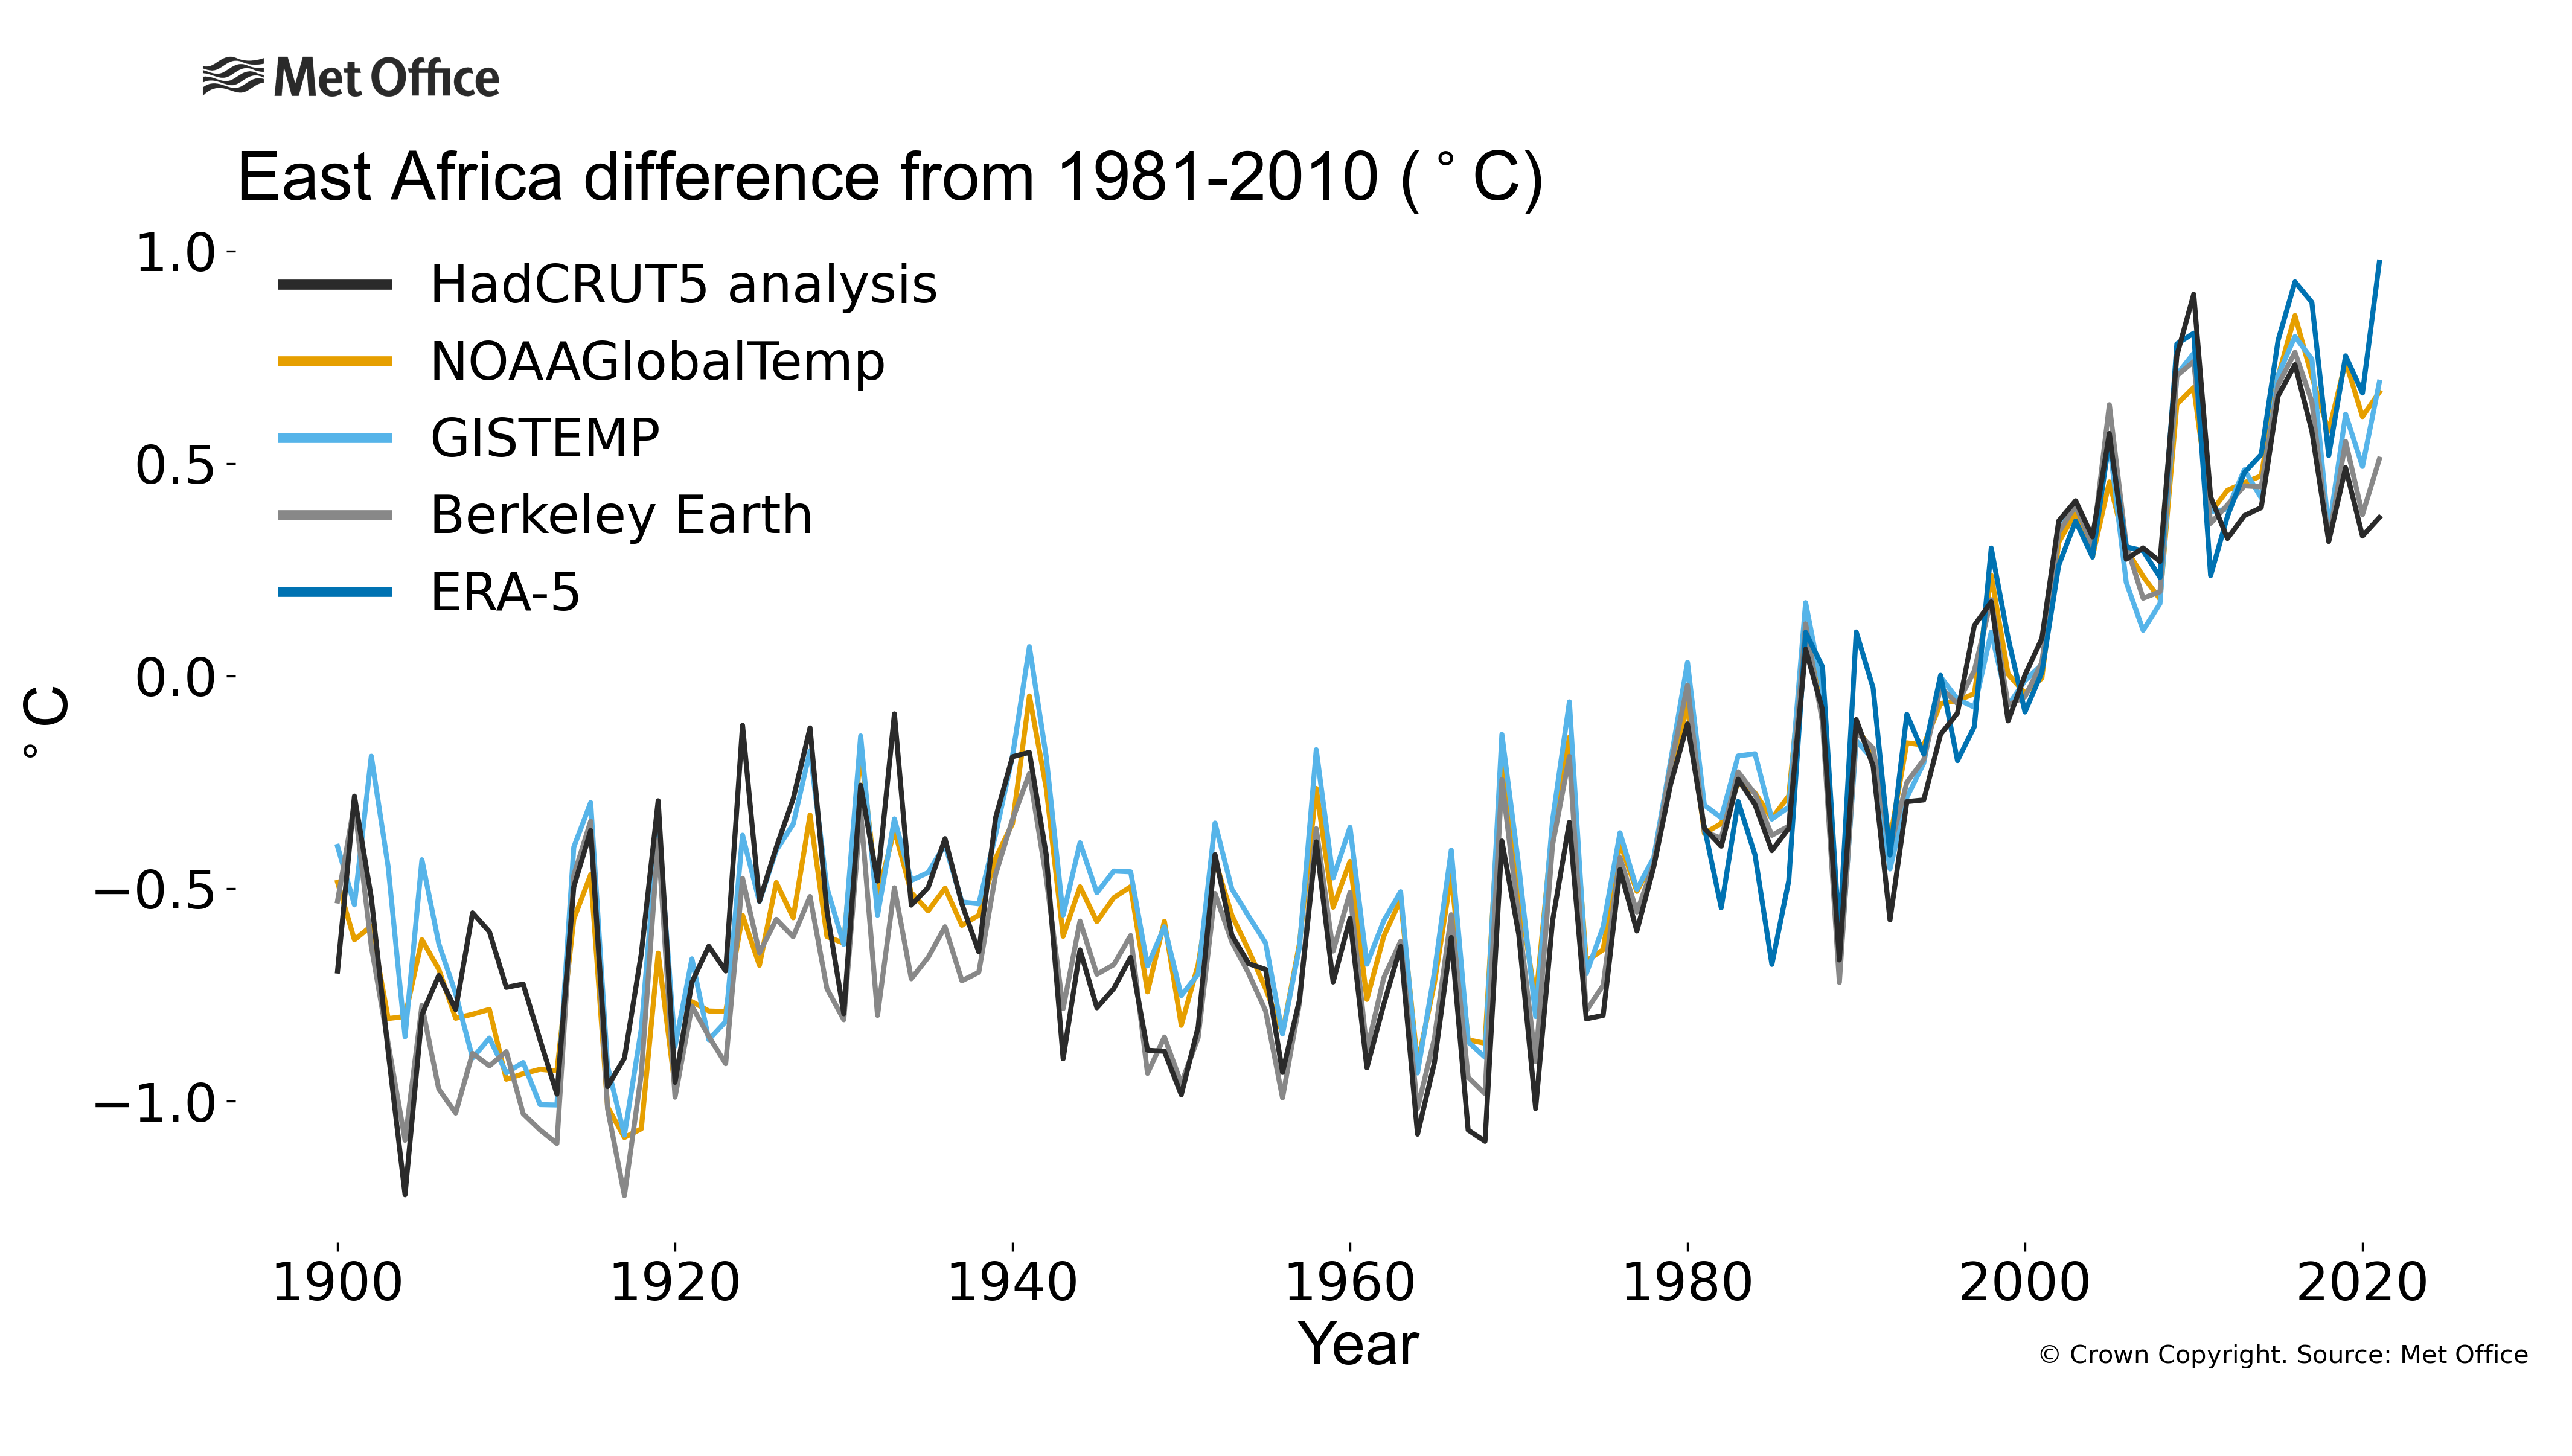
East Africa: The temperature anomaly for 2021 was between 0.37 and 0.97 °c above the 1981-2010 average depending on the data set considered. the mean of the 5 data sets is 0.64 °c. The temperature anomaly relative to 1961-1990 for 2021 was between 0.92 and 1.11 °c above the 1961-1990 average depending on the data set considered. the mean of the 4 data sets is 1.04 °c. Time series figure: png pdf
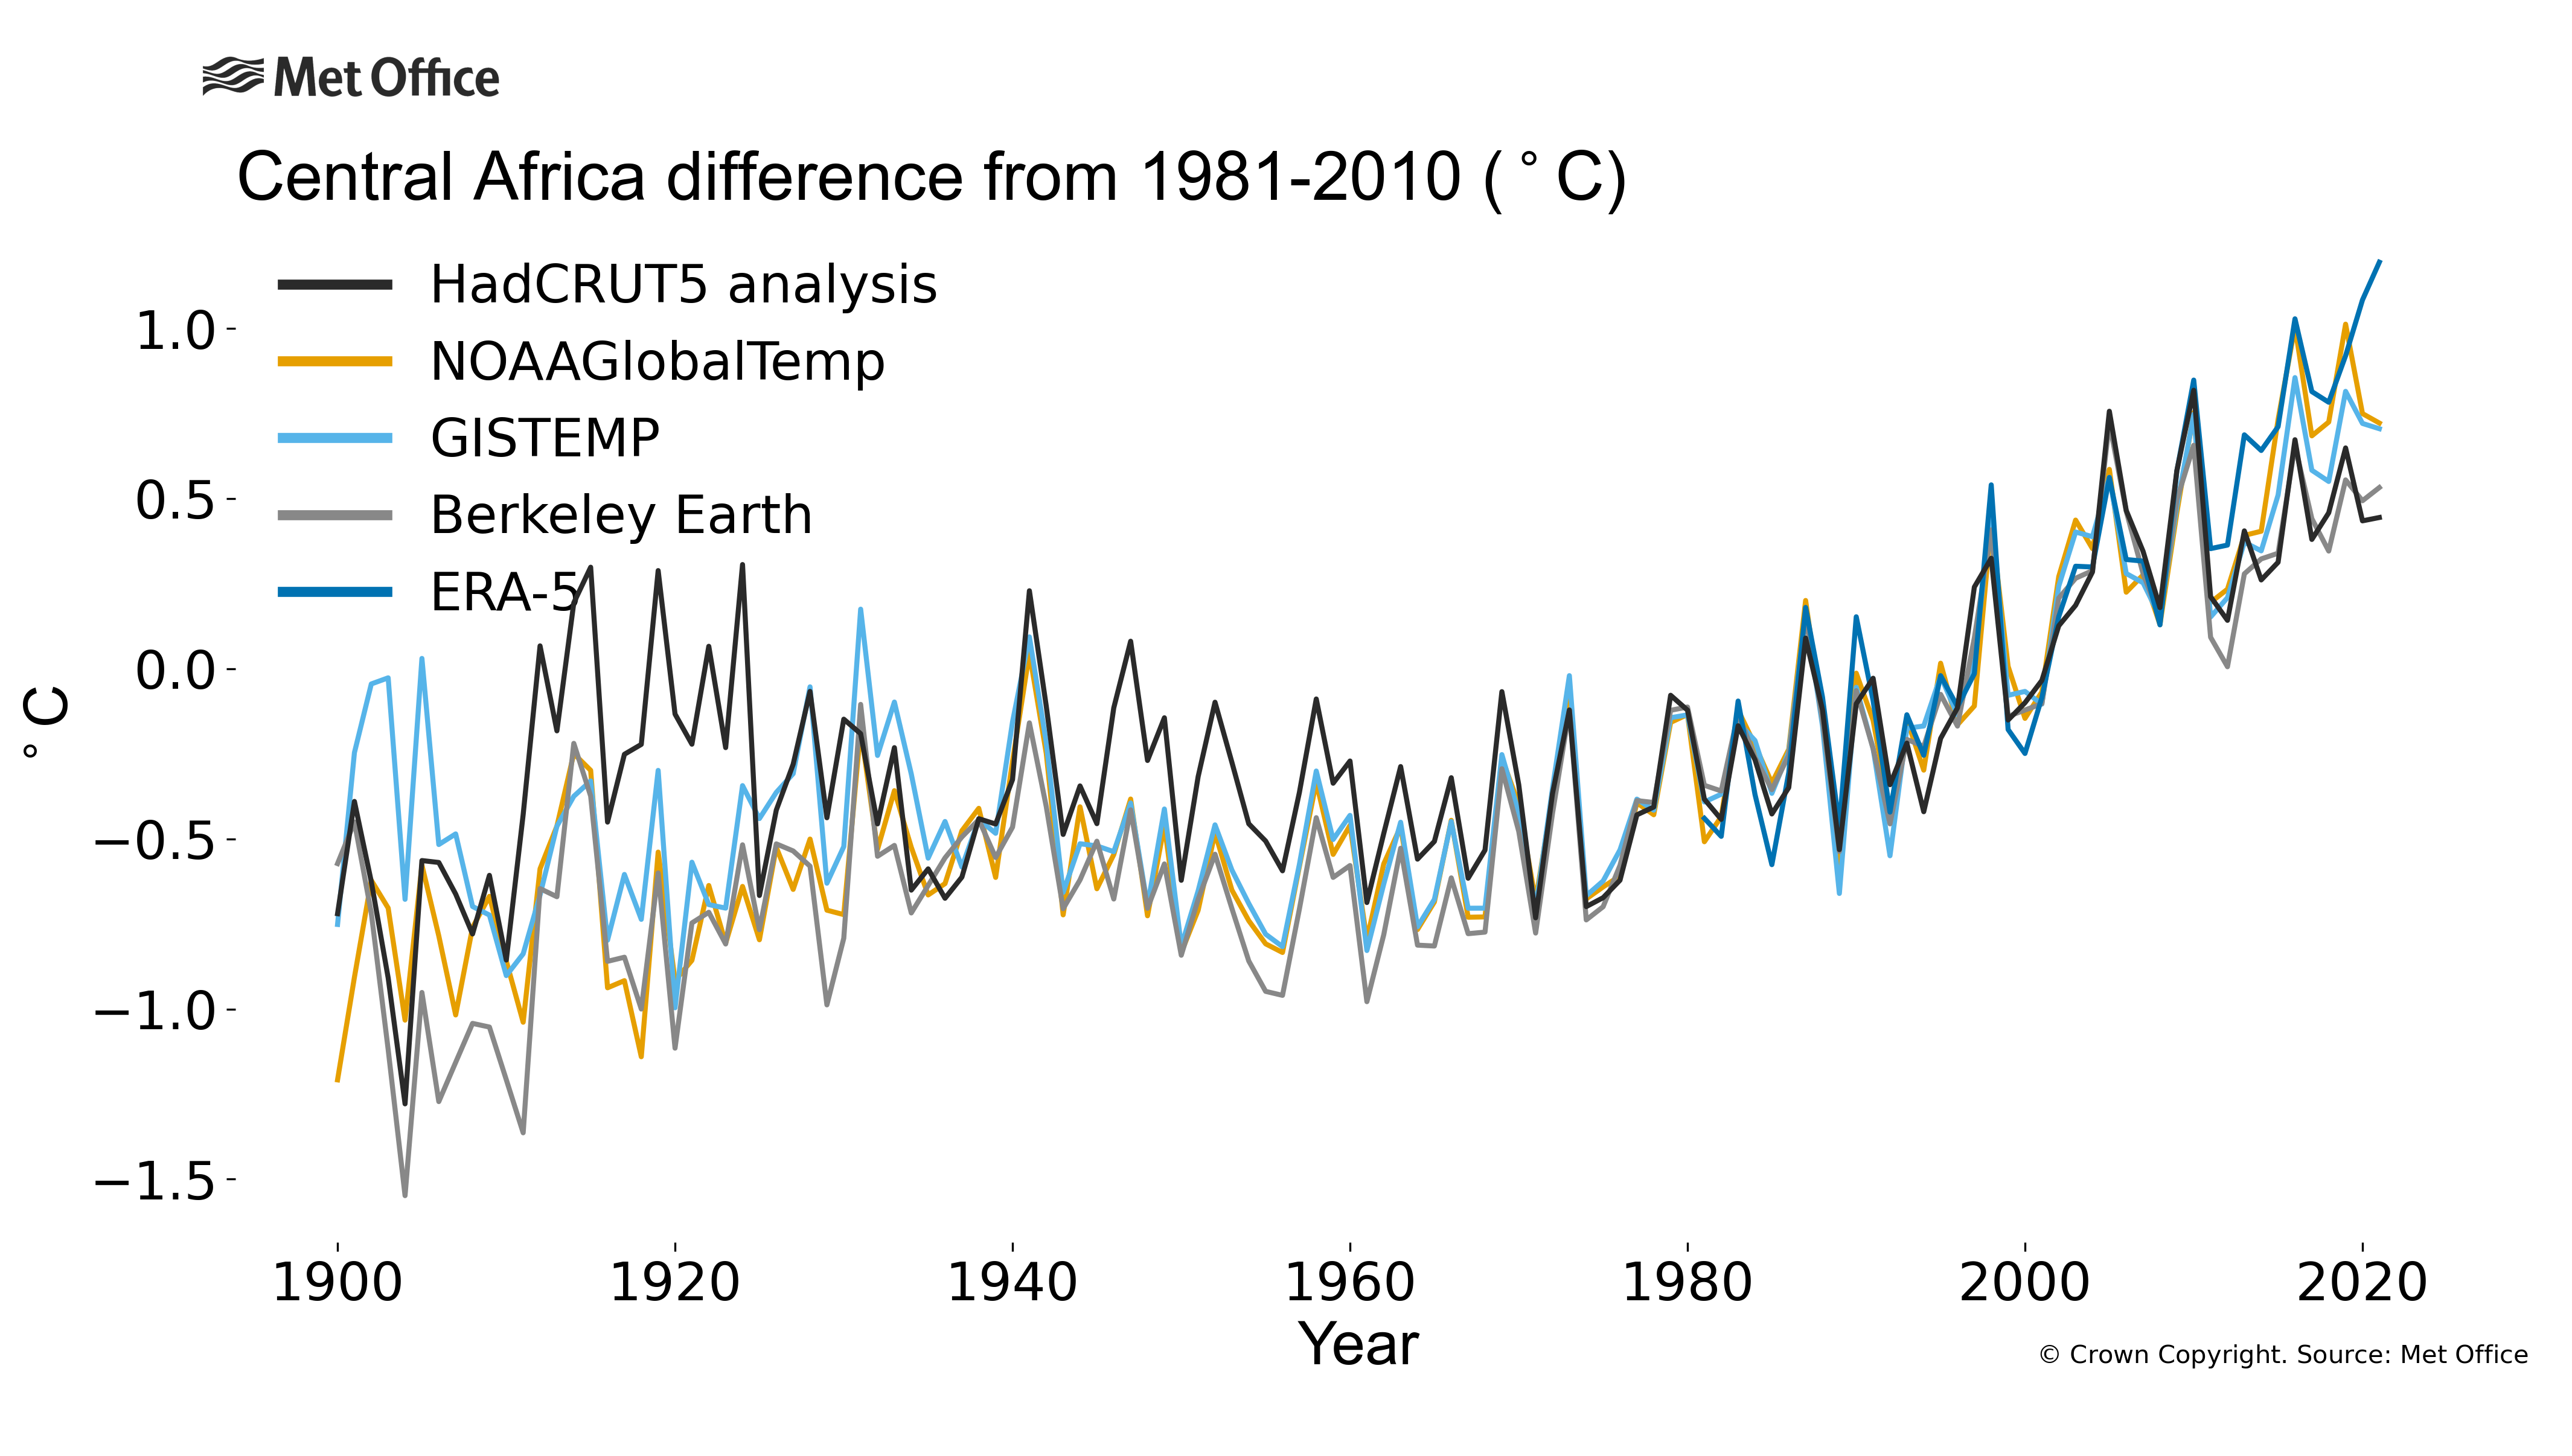
Central Africa: The temperature anomaly for 2021 was between 0.44 and 1.20 °c above the 1981-2010 average depending on the data set considered. the mean of the 5 data sets is 0.72 °c. The temperature anomaly relative to 1961-1990 for 2021 was between 0.82 and 1.14 °c above the 1961-1990 average depending on the data set considered. the mean of the 4 data sets is 1.01 °c. Time series figure: png pdf
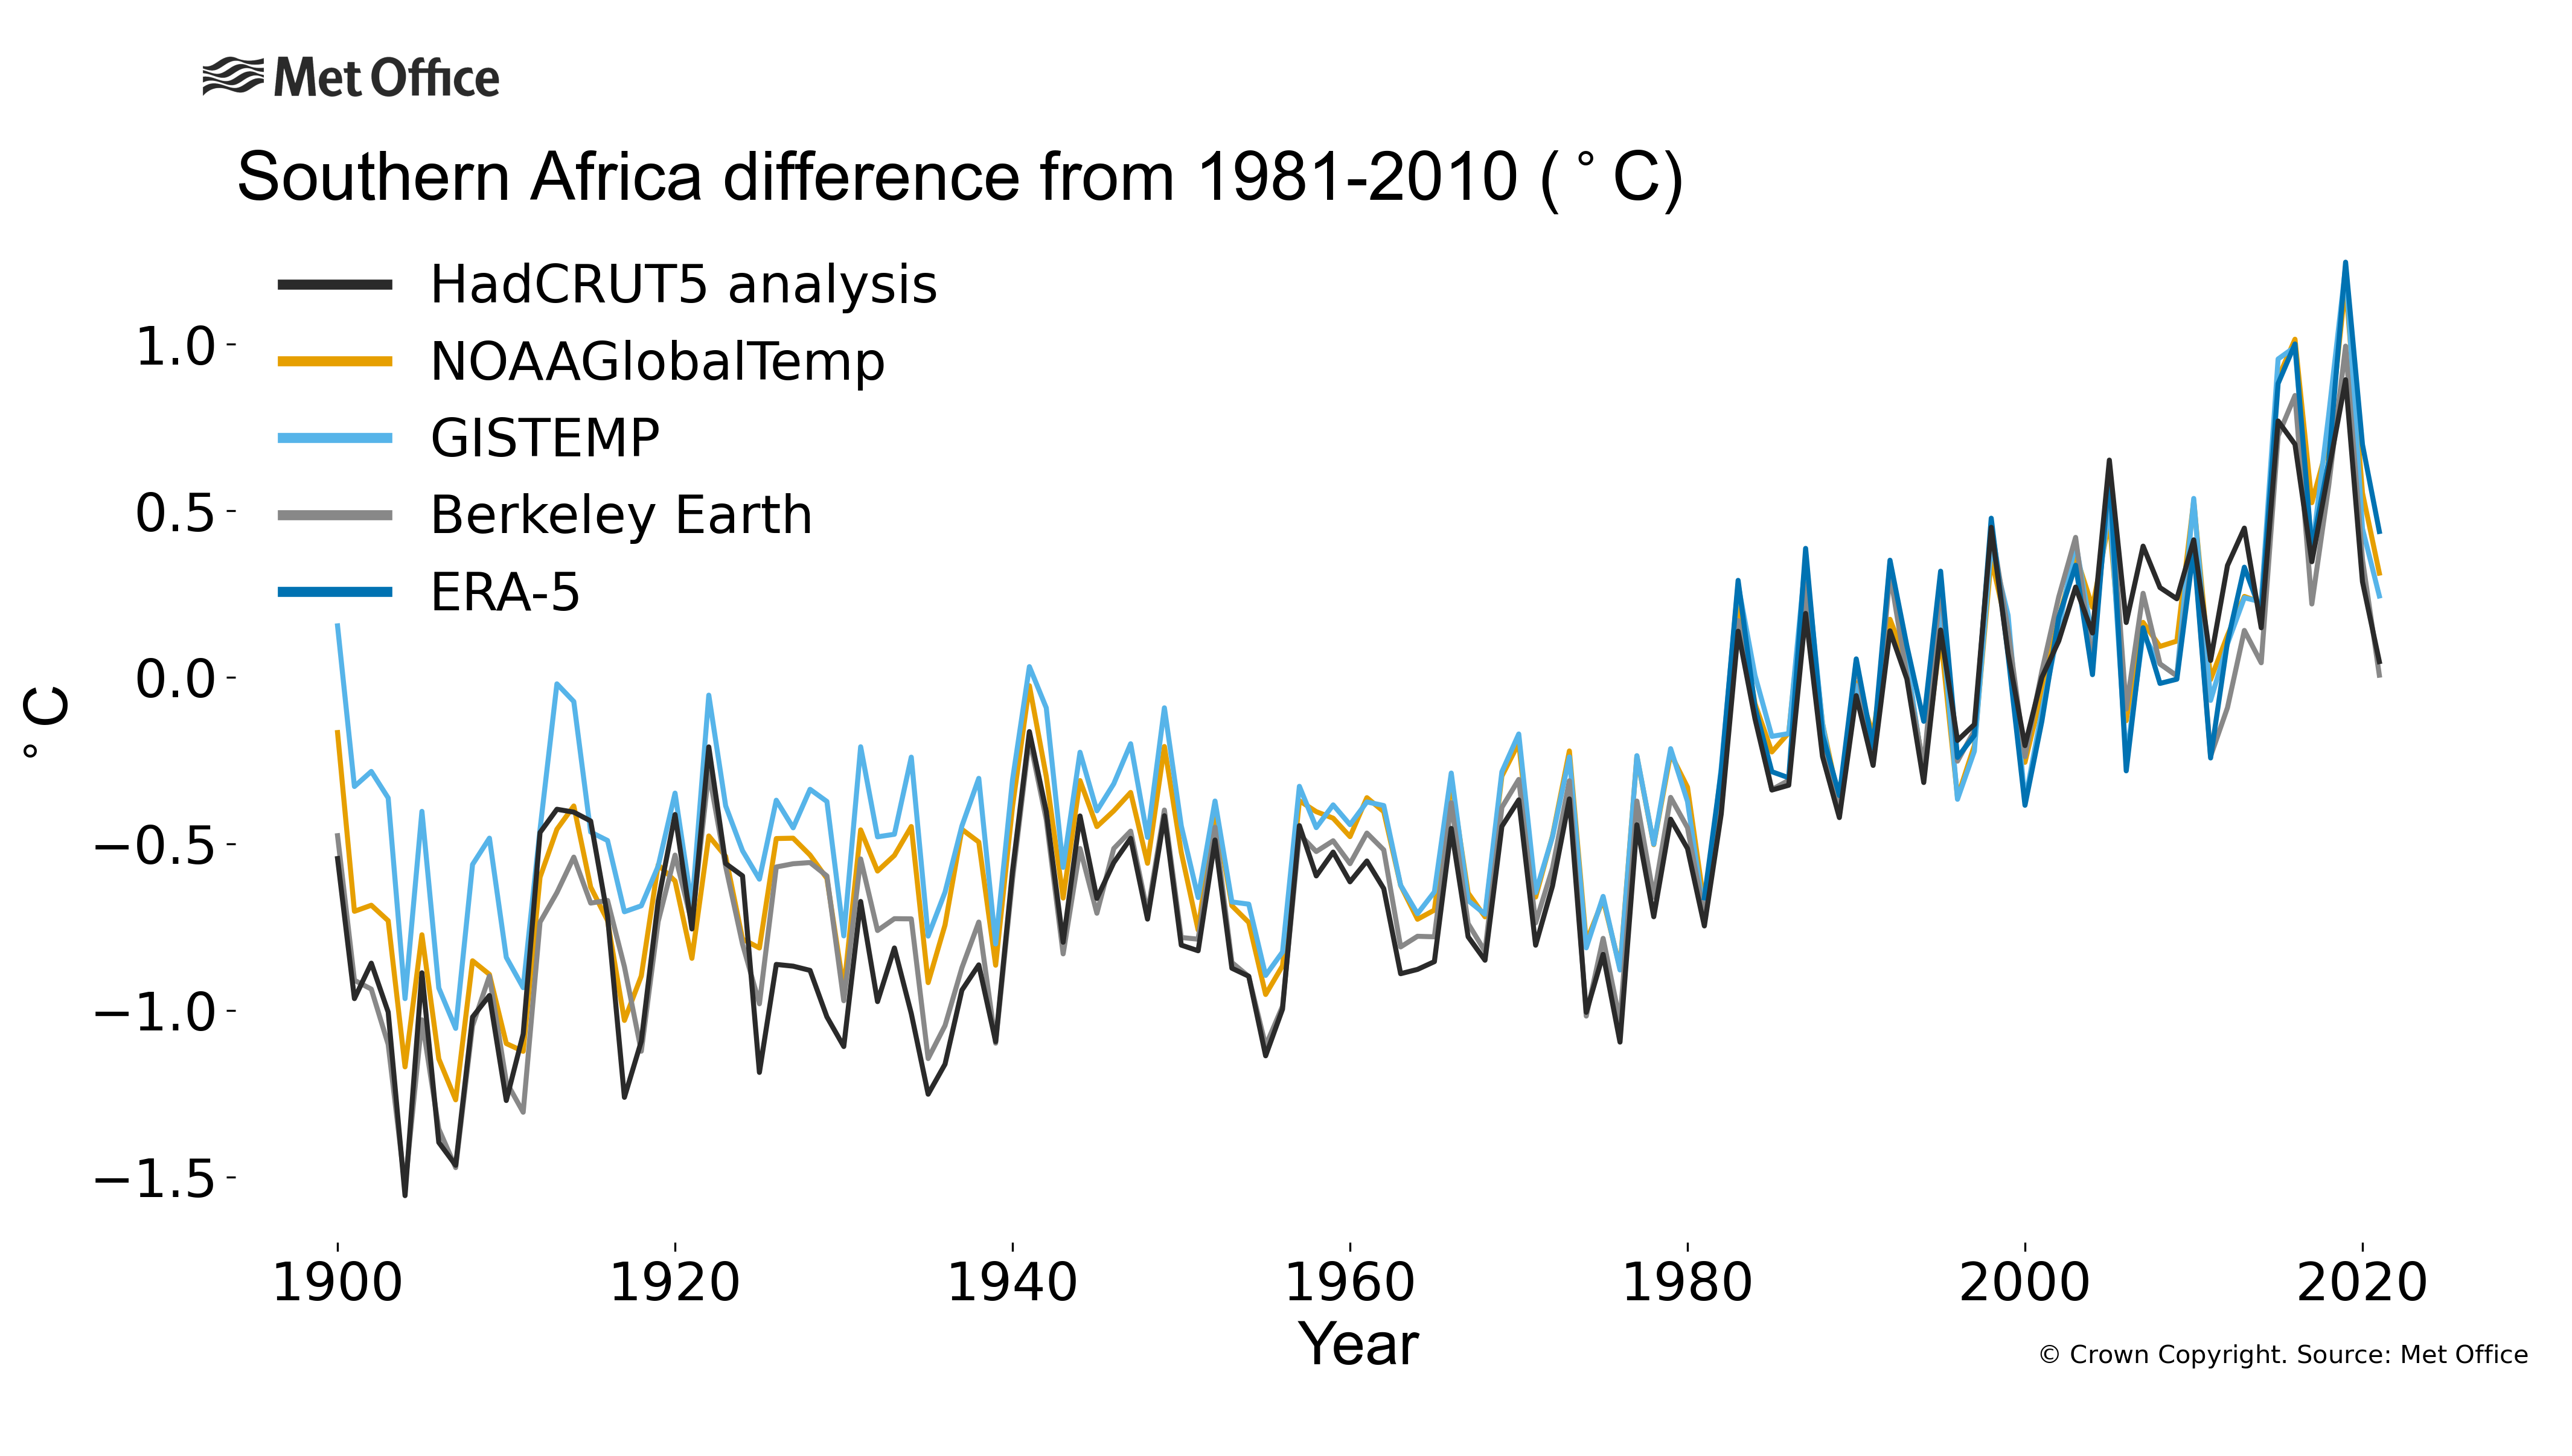
Southern Africa: The temperature anomaly for 2021 was between 0.01 and 0.44 °c above the 1981-2010 average depending on the data set considered. the mean of the 5 data sets is 0.21 °c. The temperature anomaly relative to 1961-1990 for 2021 was between 0.48 and 0.70 °c above the 1961-1990 average depending on the data set considered. the mean of the 4 data sets is 0.59 °c. Time series figure: png pdf
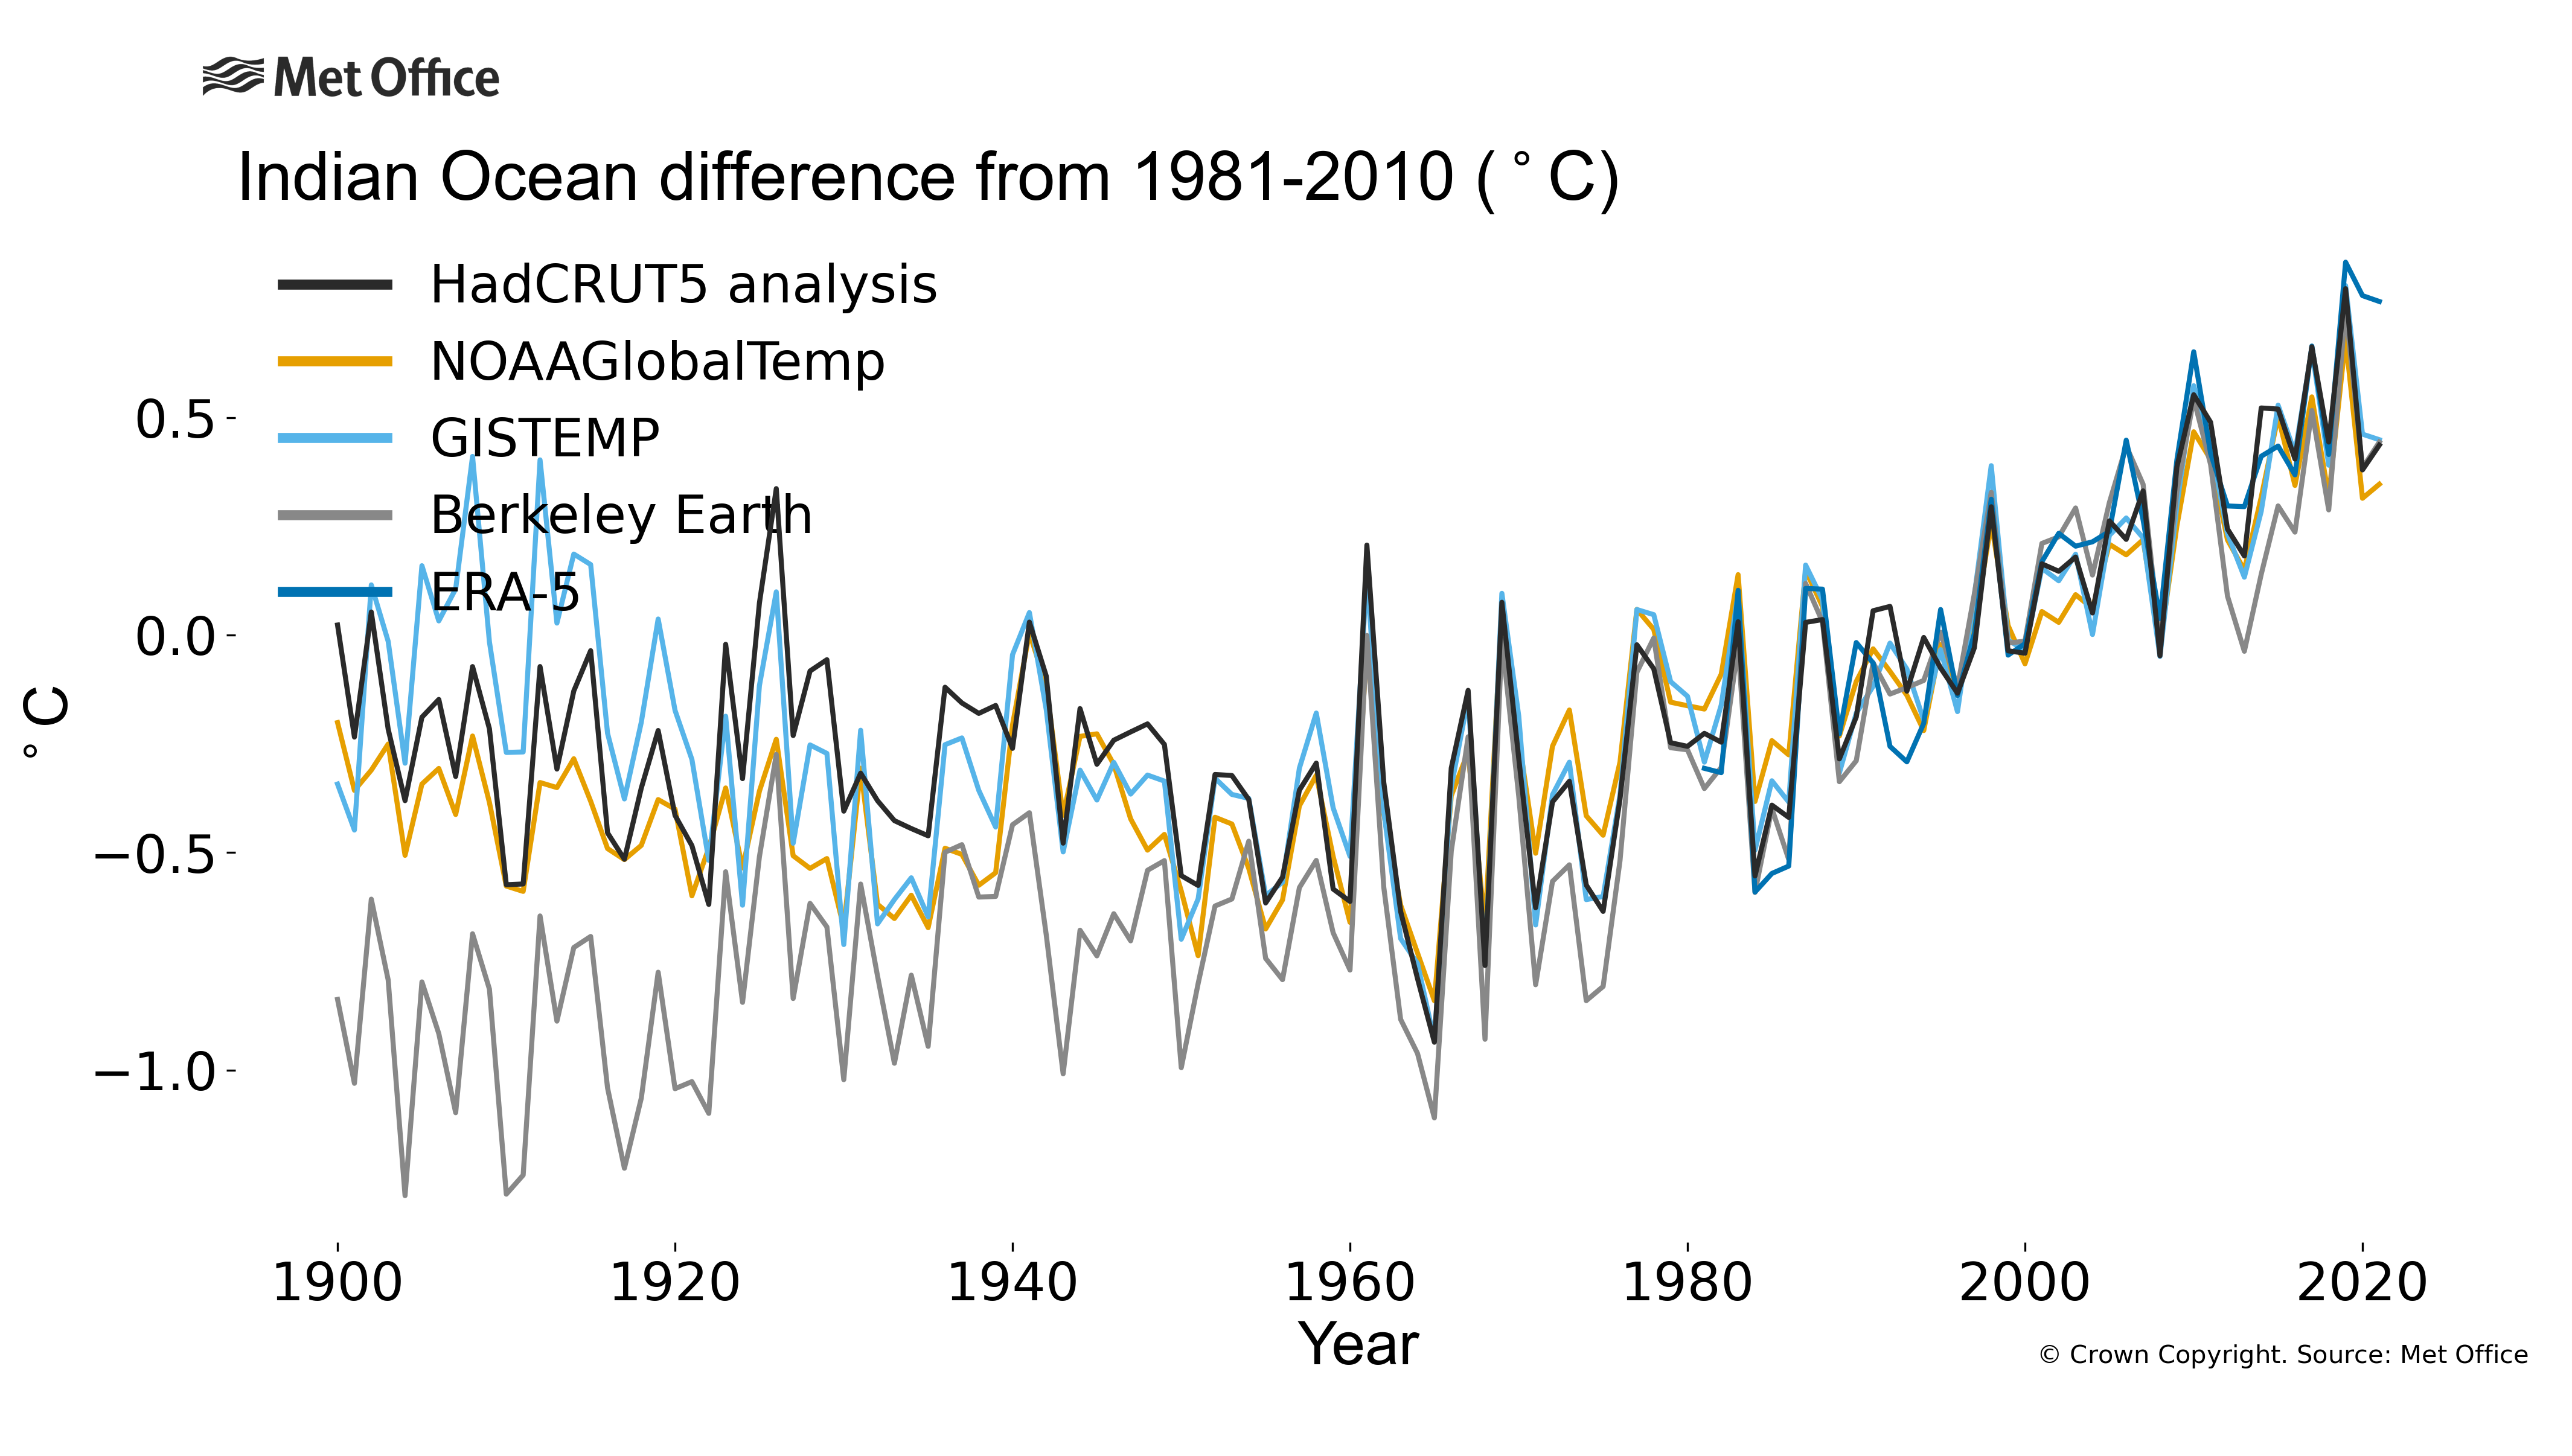
Indian Ocean: The temperature anomaly for 2021 was between 0.35 and 0.77 °c above the 1981-2010 average depending on the data set considered. the mean of the 5 data sets is 0.49 °c. The temperature anomaly relative to 1961-1990 for 2021 was between 0.60 and 0.87 °c above the 1961-1990 average depending on the data set considered. the mean of the 4 data sets is 0.74 °c. Time series figure: png pdf
Find out more about
temperature change in wmo ra i - africa

 for WMO RA I - Africa. Data are from six different data sets: HadCRUT5, NOAAGlobalTemp, GISTEMP, Berkeley Earth, ERA5 and JRA55.")

