Temperature change in WMO RA V - South-West Pacific
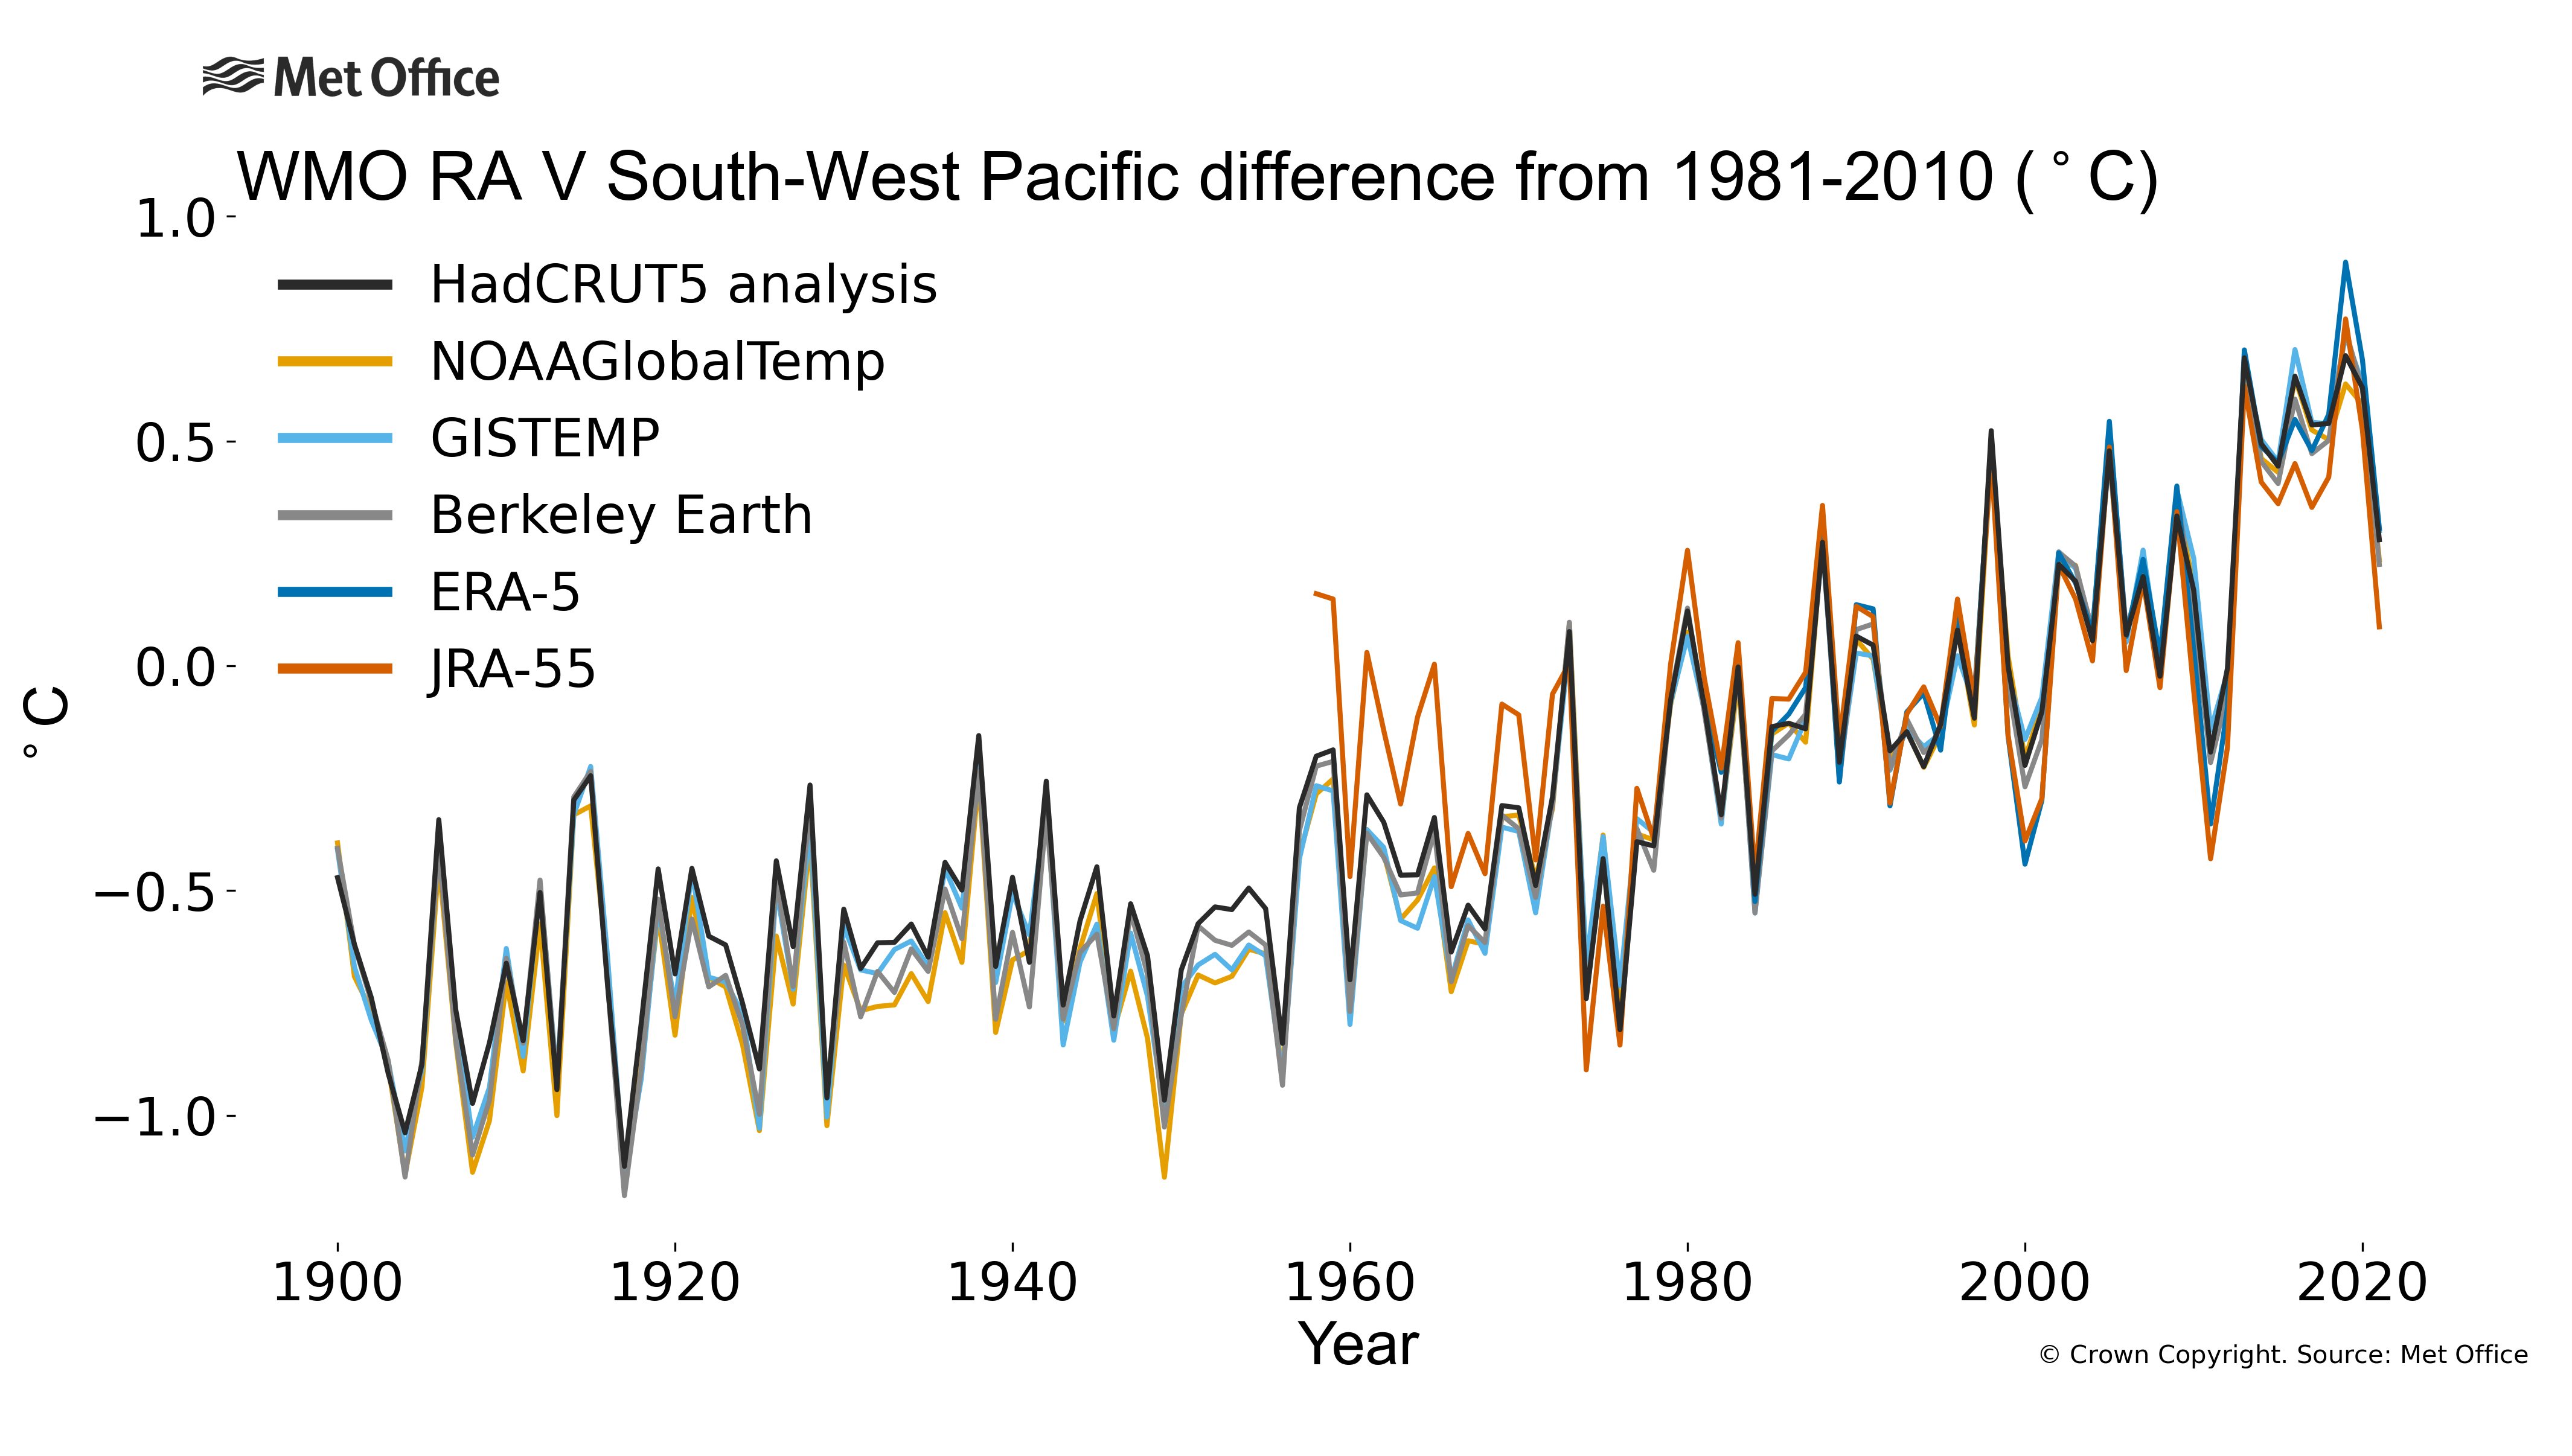
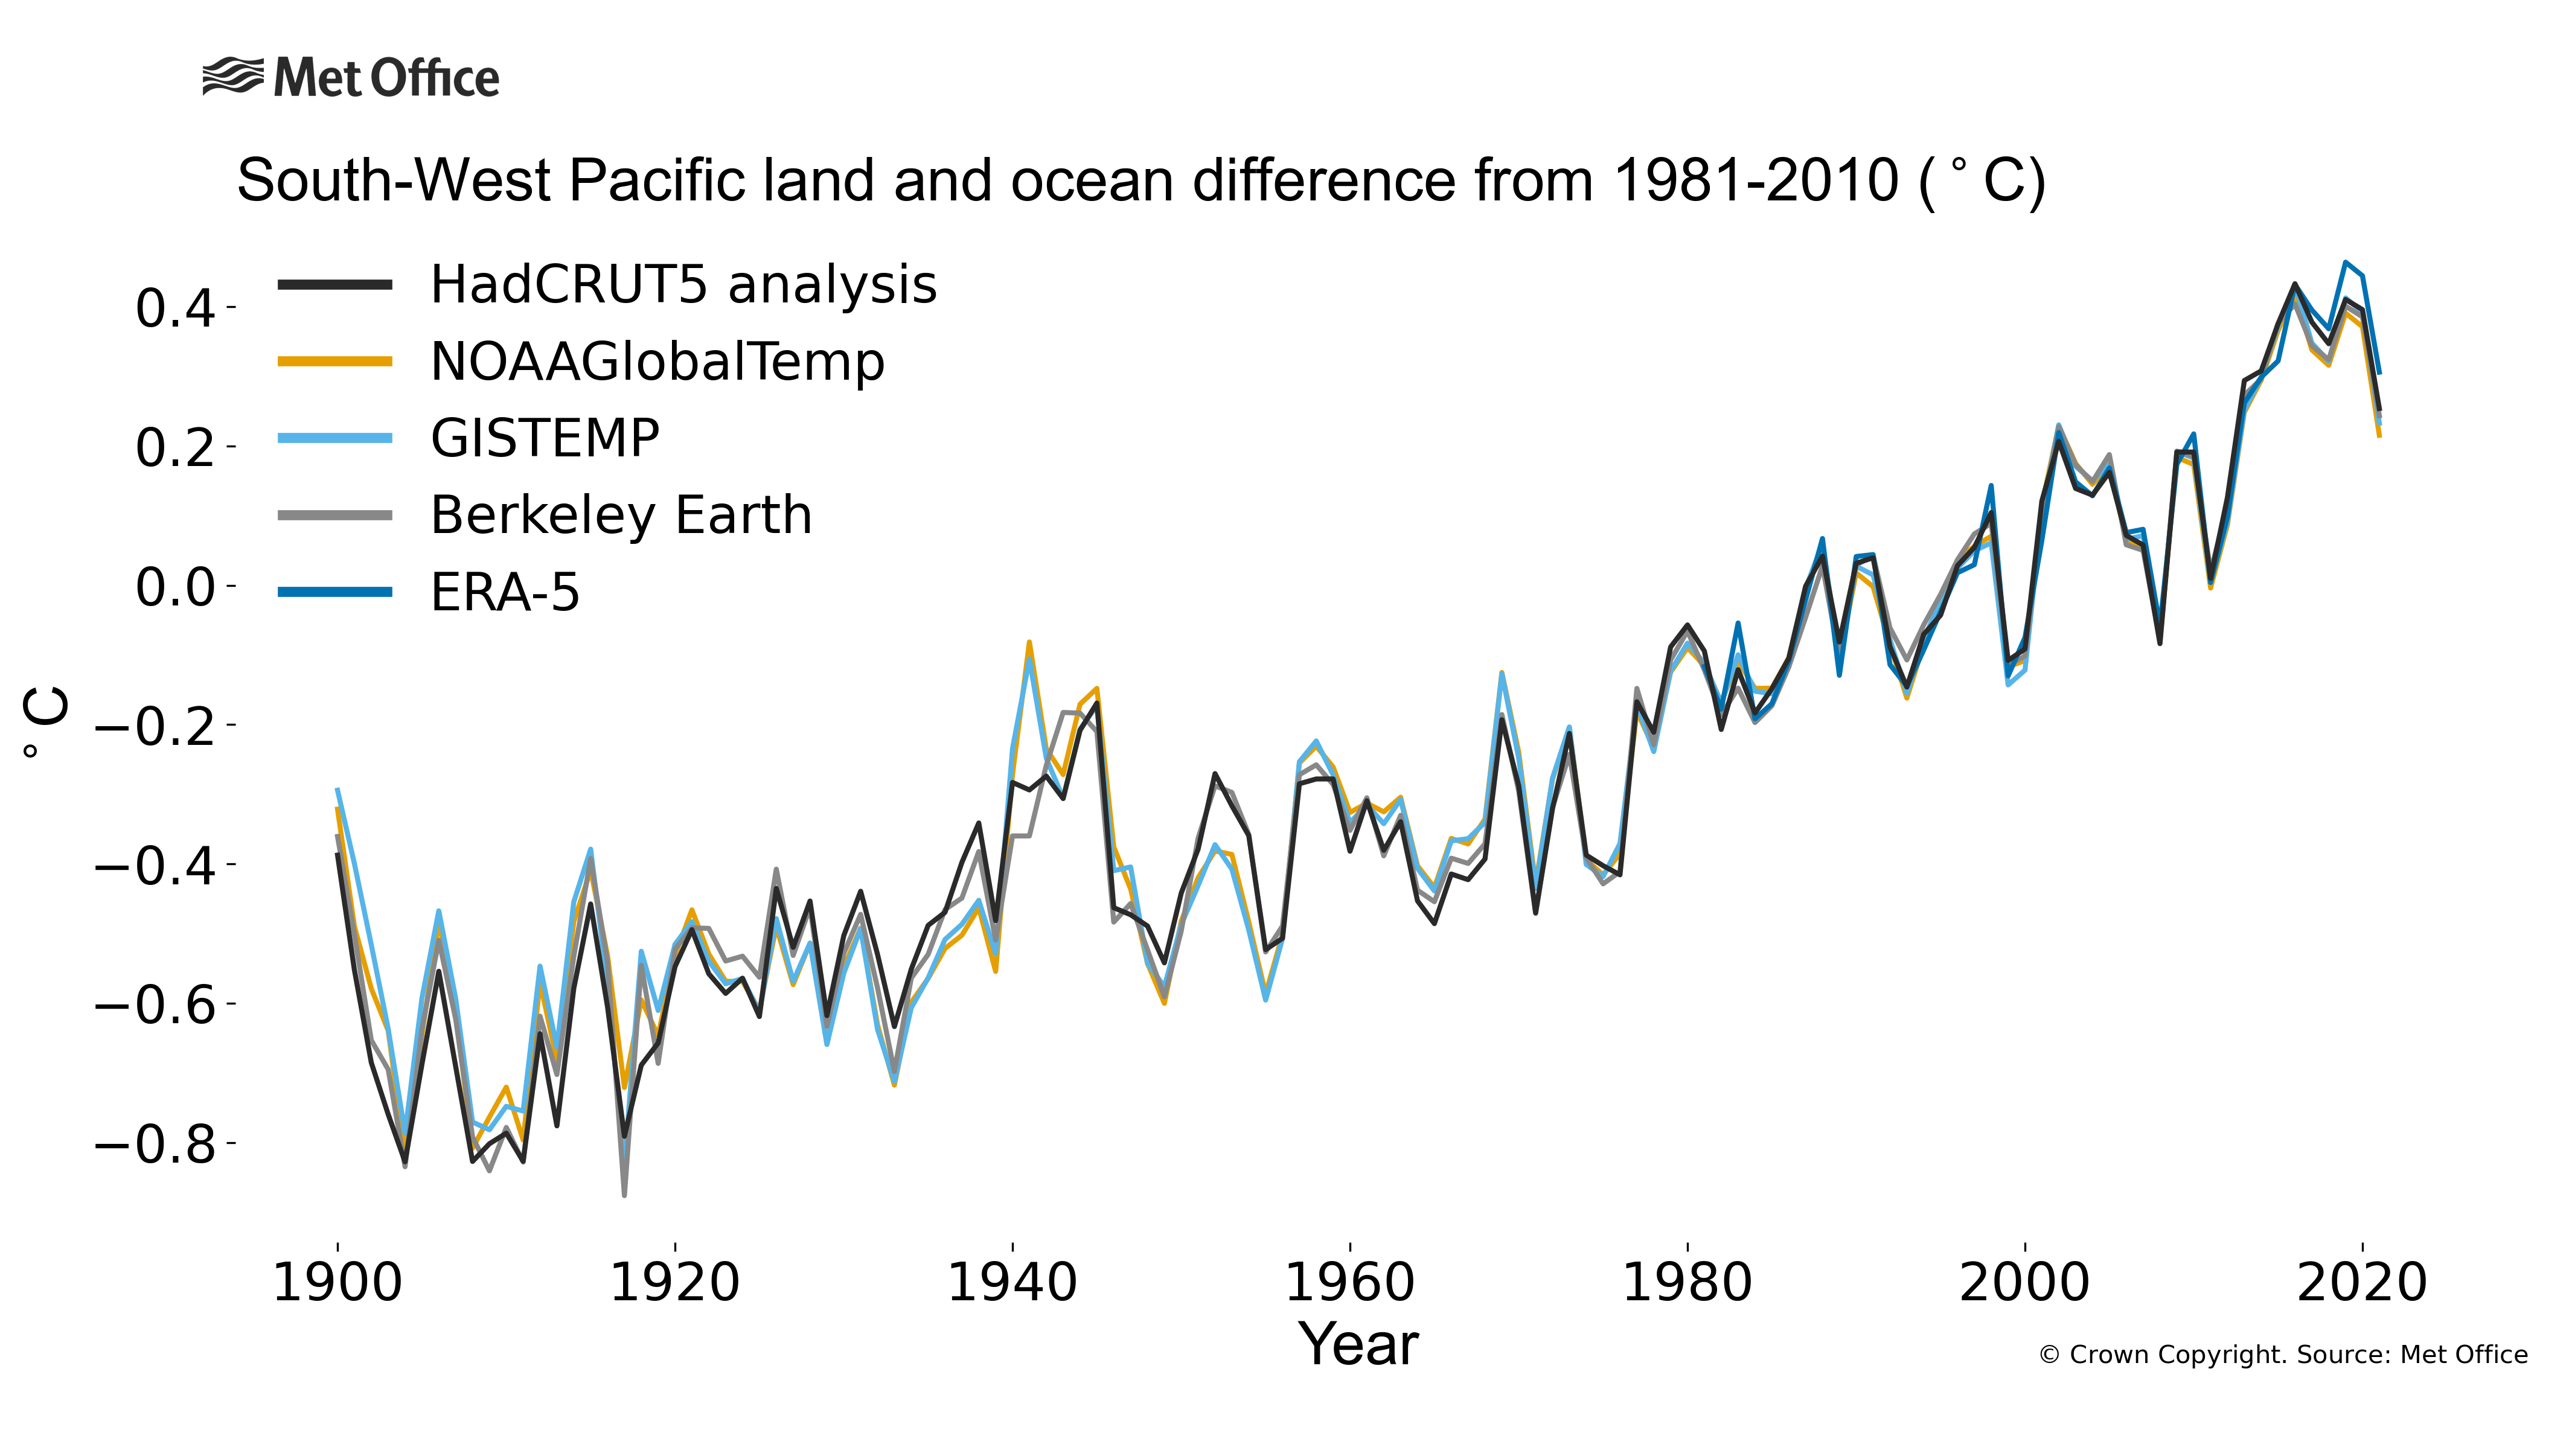
For land and ocean areas in WMO RA V, the temperature anomaly for 2021 was between 0.22 and 0.31 °C above the 1981-2010 average depending on the data set considered. The mean of the 5 data sets is 0.25 °C. 2021 was between the 7th and 10th warmest year on record depending on the data set considered (of 5 datasets).
For land areas only, the temperature anomaly for 2021 was between 0.09 and 0.31 °C above the 1981-2010 average depending on the data set considered. The mean of the 6 data sets is 0.24 °C. 2021 was between the 12th and 22nd warmest year on record depending on the data set considered (of 6 datasets).
For land and ocean areas in WMO RA V, the temperature anomaly relative to 1961-1990 for 2021 was between 0.44 and 0.50 °C above the 1961-1990 average depending on the data set considered. The mean of the 4 data sets is 0.47 °C.
For land areas only, the temperature anomaly relative to 1961-1990 for 2021 was between 0.28 and 0.63 °C above the 1961-1990 average depending on the data set considered. The mean of the 5 data sets is 0.52 °C. . Note that the range and mean of anomalies relative to the two
different baselines are based on different sets of data as anomalies relative to 1961-1990 cannot be computed for ERA5 which starts in 1979.
This can lead to apparent inconsistencies.
Note that the rate of warming and variability are typically higher for land areas than
for land and ocean areas combined. The rate of warming is higher in the latter half of the record
than the first half for both land only and land and ocean areas.
pdf version of land-only time series and
pdf version of land and ocean time series
Find out more about
temperature change in wmo ra v - south-west pacific

The plot shows annual average temperature anomalies (relative to 1981-2010) for WMO RA V - South-West Pacific. Data are from six different data sets: HadCRUT5, NOAAGlobalTemp, GISTEMP, Berkeley Earth, ERA5 and JRA55.
The plot shows annual average temperature anomalies (relative to 1981-2010) for WMO RA V - South-West Pacific. Data are from six different data sets: HadCRUT5, NOAAGlobalTemp, GISTEMP, Berkeley Earth, ERA5 and JRA55.

The plot shows annual average temperature anomalies (relative to 1981-2010) for land and ocean areas in WMO RA V - South-West Pacific. Data are from six different data sets: HadCRUT5, NOAAGlobalTemp, GISTEMP, Berkeley Earth, ERA5 and JRA55.
The plot shows annual average temperature anomalies (relative to 1981-2010) for land and ocean areas in WMO RA V - South-West Pacific. Data are from six different data sets: HadCRUT5, NOAAGlobalTemp, GISTEMP, Berkeley Earth, ERA5 and JRA55.

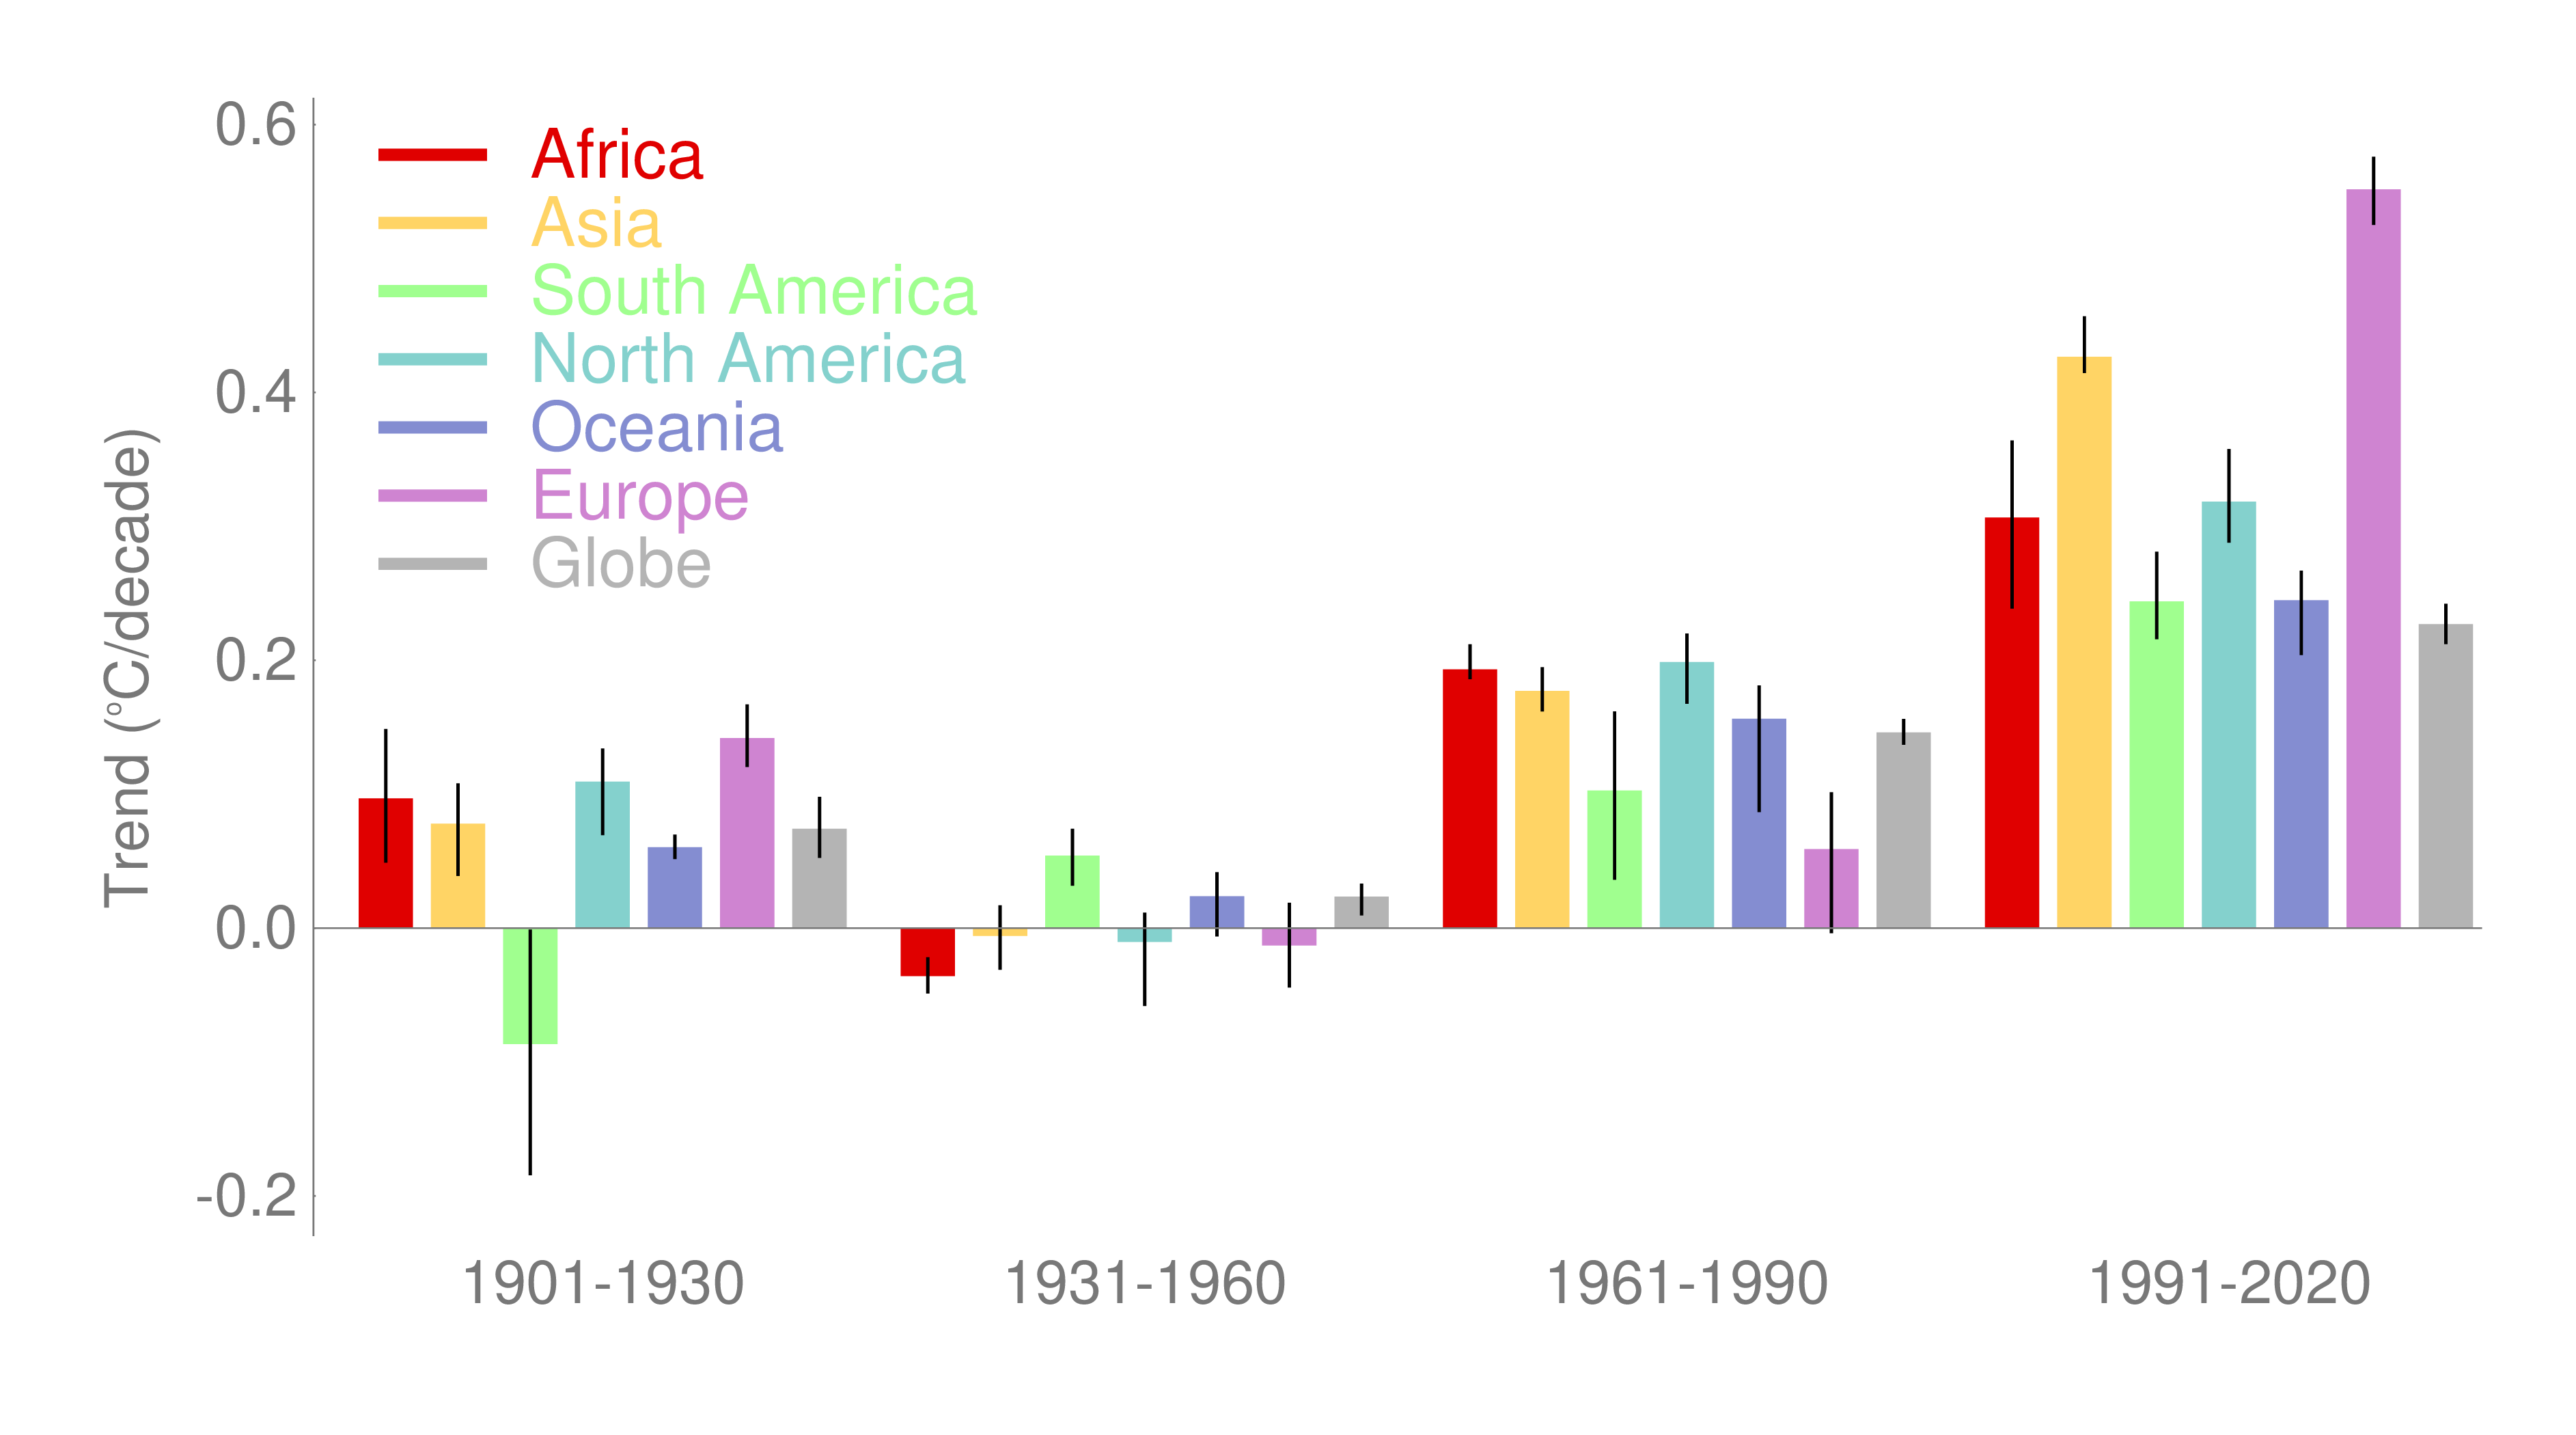
The plot shows the trends for four thirty-year periods as indicated on the x-axis. The coloured bars are the average
trend calculated over each period for each of six data sets: HadCRUT5, NOAAGlobalTemp, GISTEMP, Berkeley Earth, ERA5 and JRA55.
The black vertical line indicates the range of the six estimates.


