Temperature change in WMO RA III - South America
The temperature anomaly for 2021 was between 0.21 and 0.45 °c above the 1981-2010 average depending on the data set considered. the mean of the 6 data sets is 0.36 °c. 2021 was between the 7th and 16th warmest year on record depending on the data set considered (of 6 datasets).
The temperature anomaly relative to 1961-1990 for 2021 was between 0.50 and 0.83 °c above the 1961-1990 average depending on the data set considered. the mean of the 5 data sets is 0.69 °c. . Note that the range and mean of anomalies relative to the two
different baselines are based on different sets of data as anomalies relative to 1961-1990 cannot be computed for ERA5 which starts in 1979.
This can lead to apparent inconsistencies.
pdf version of time series.
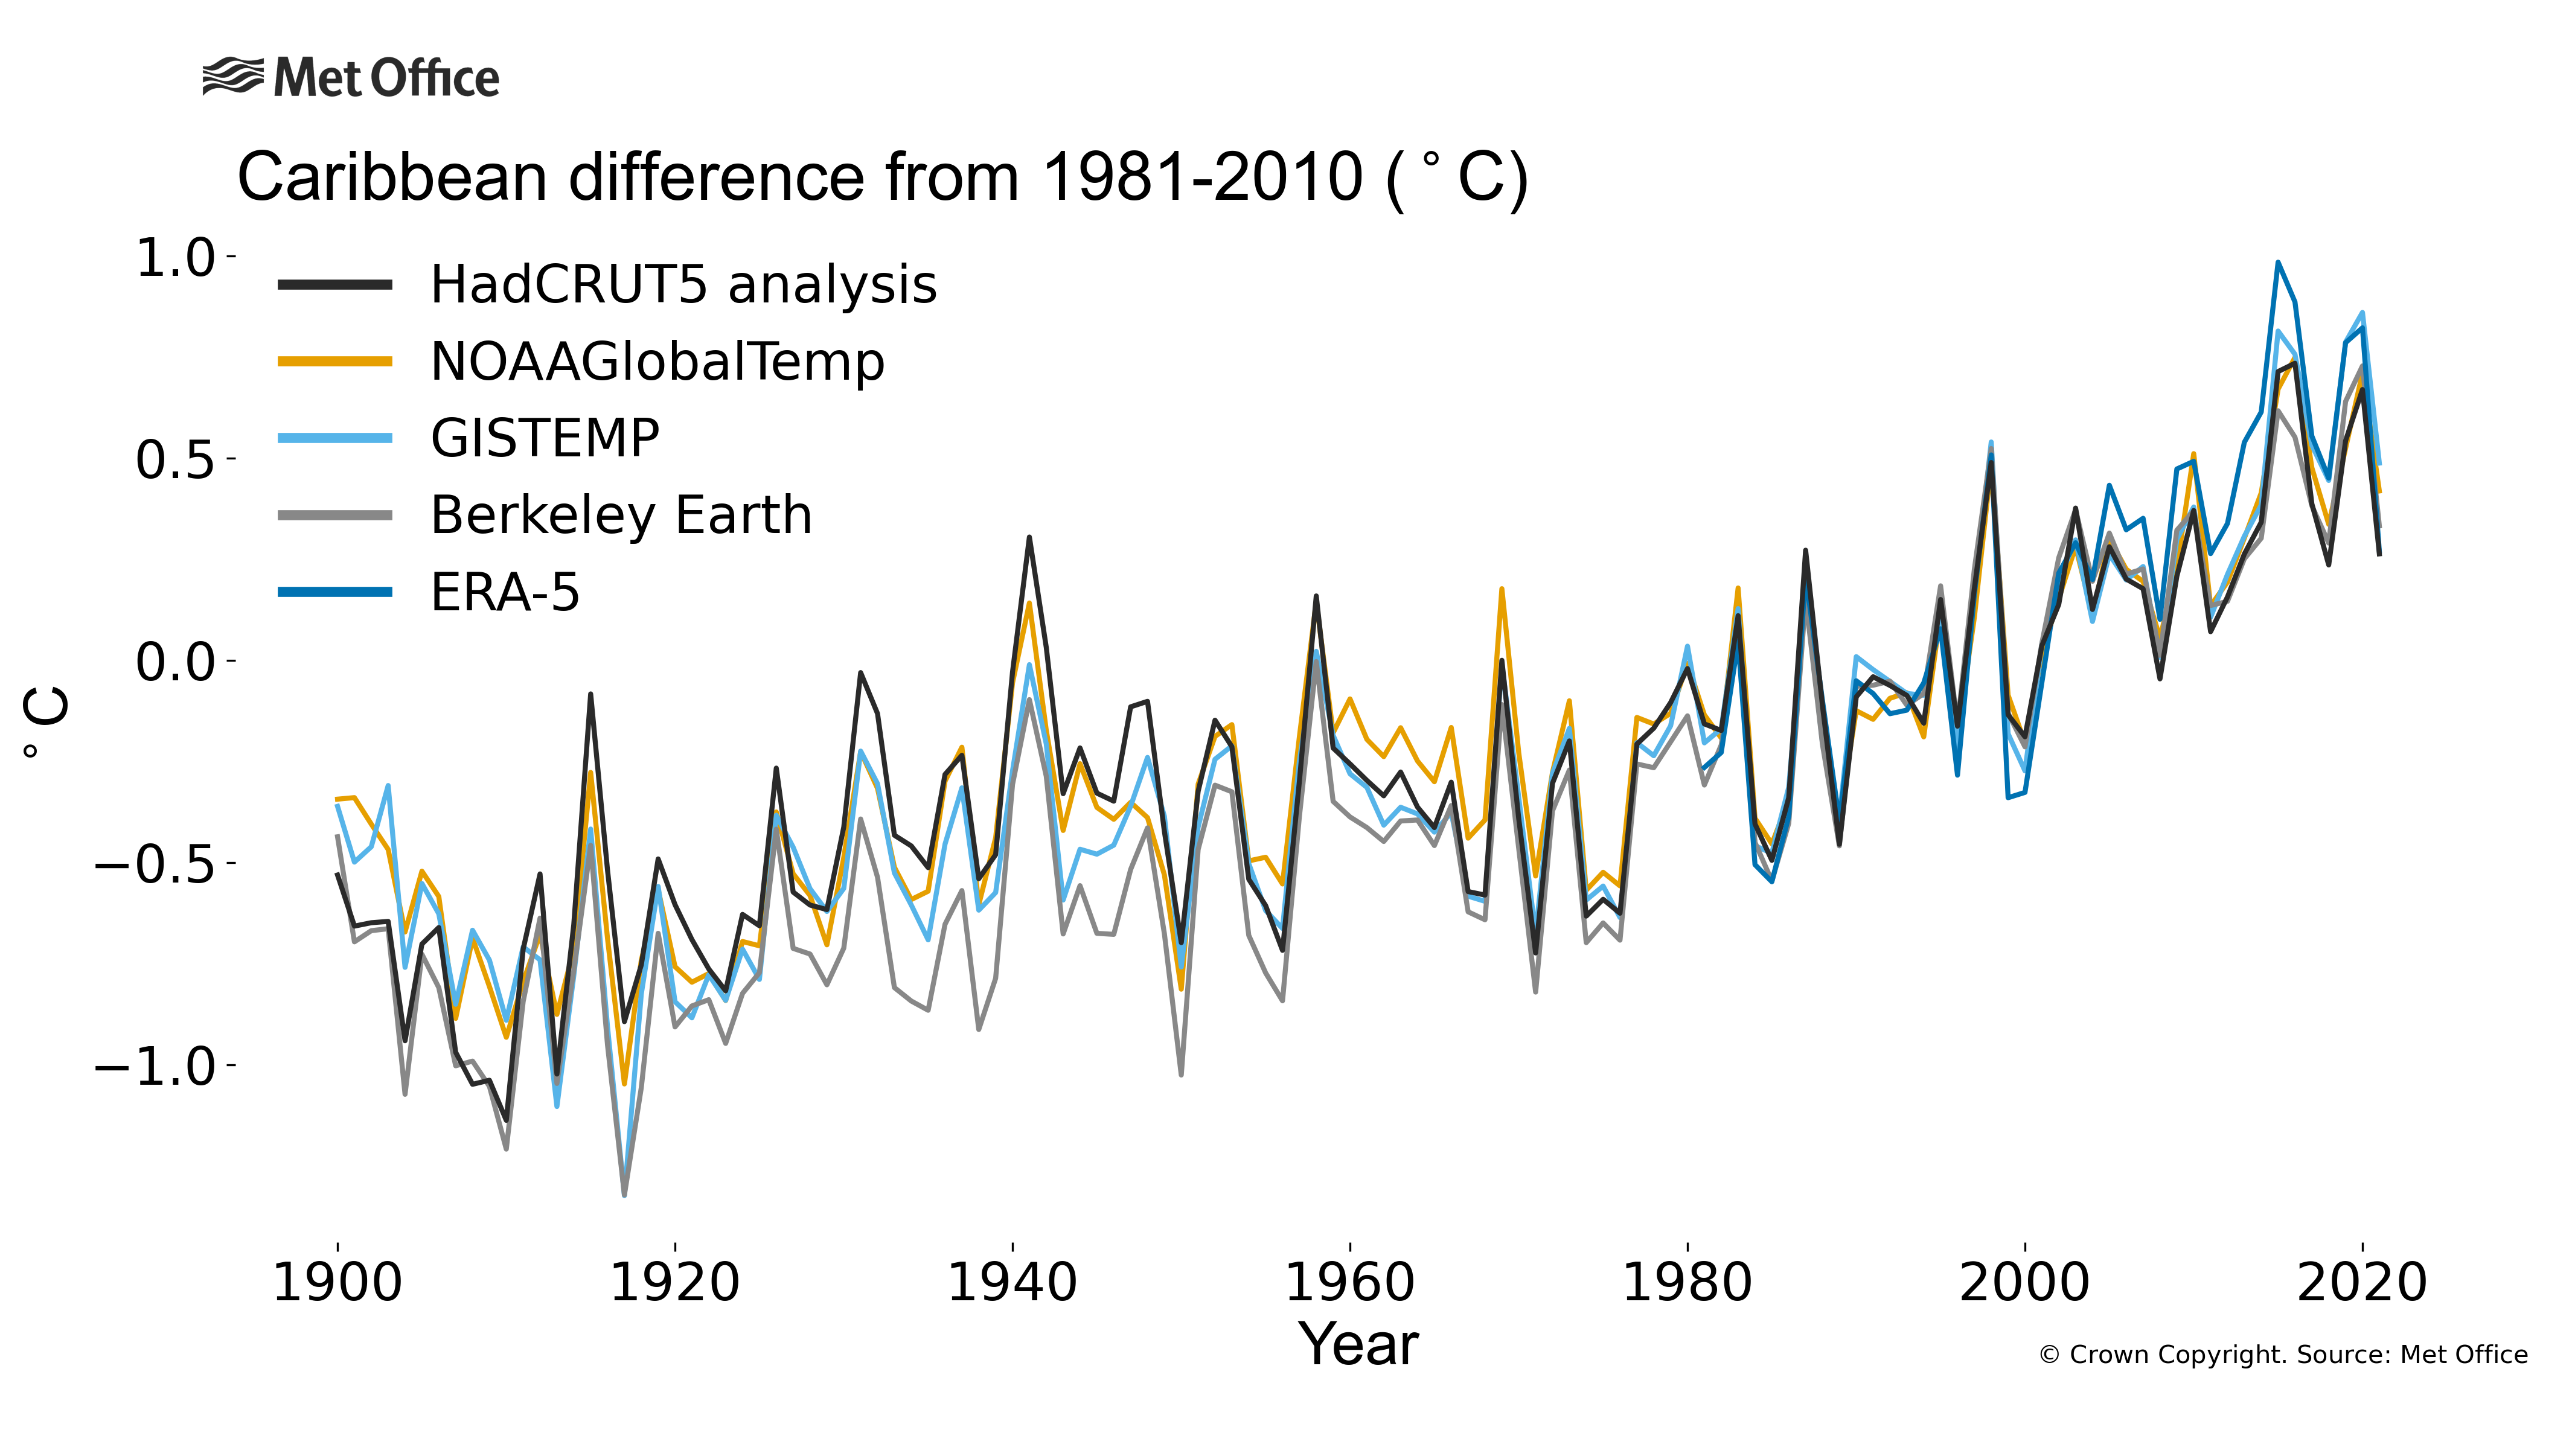
Caribbean: The temperature anomaly for 2021 was between 0.26 and 0.49 °c above the 1981-2010 average depending on the data set considered. the mean of the 5 data sets is 0.35 °c. The temperature anomaly relative to 1961-1990 for 2021 was between 0.56 and 0.79 °c above the 1961-1990 average depending on the data set considered. the mean of the 4 data sets is 0.68 °c. Time series figure: png pdf
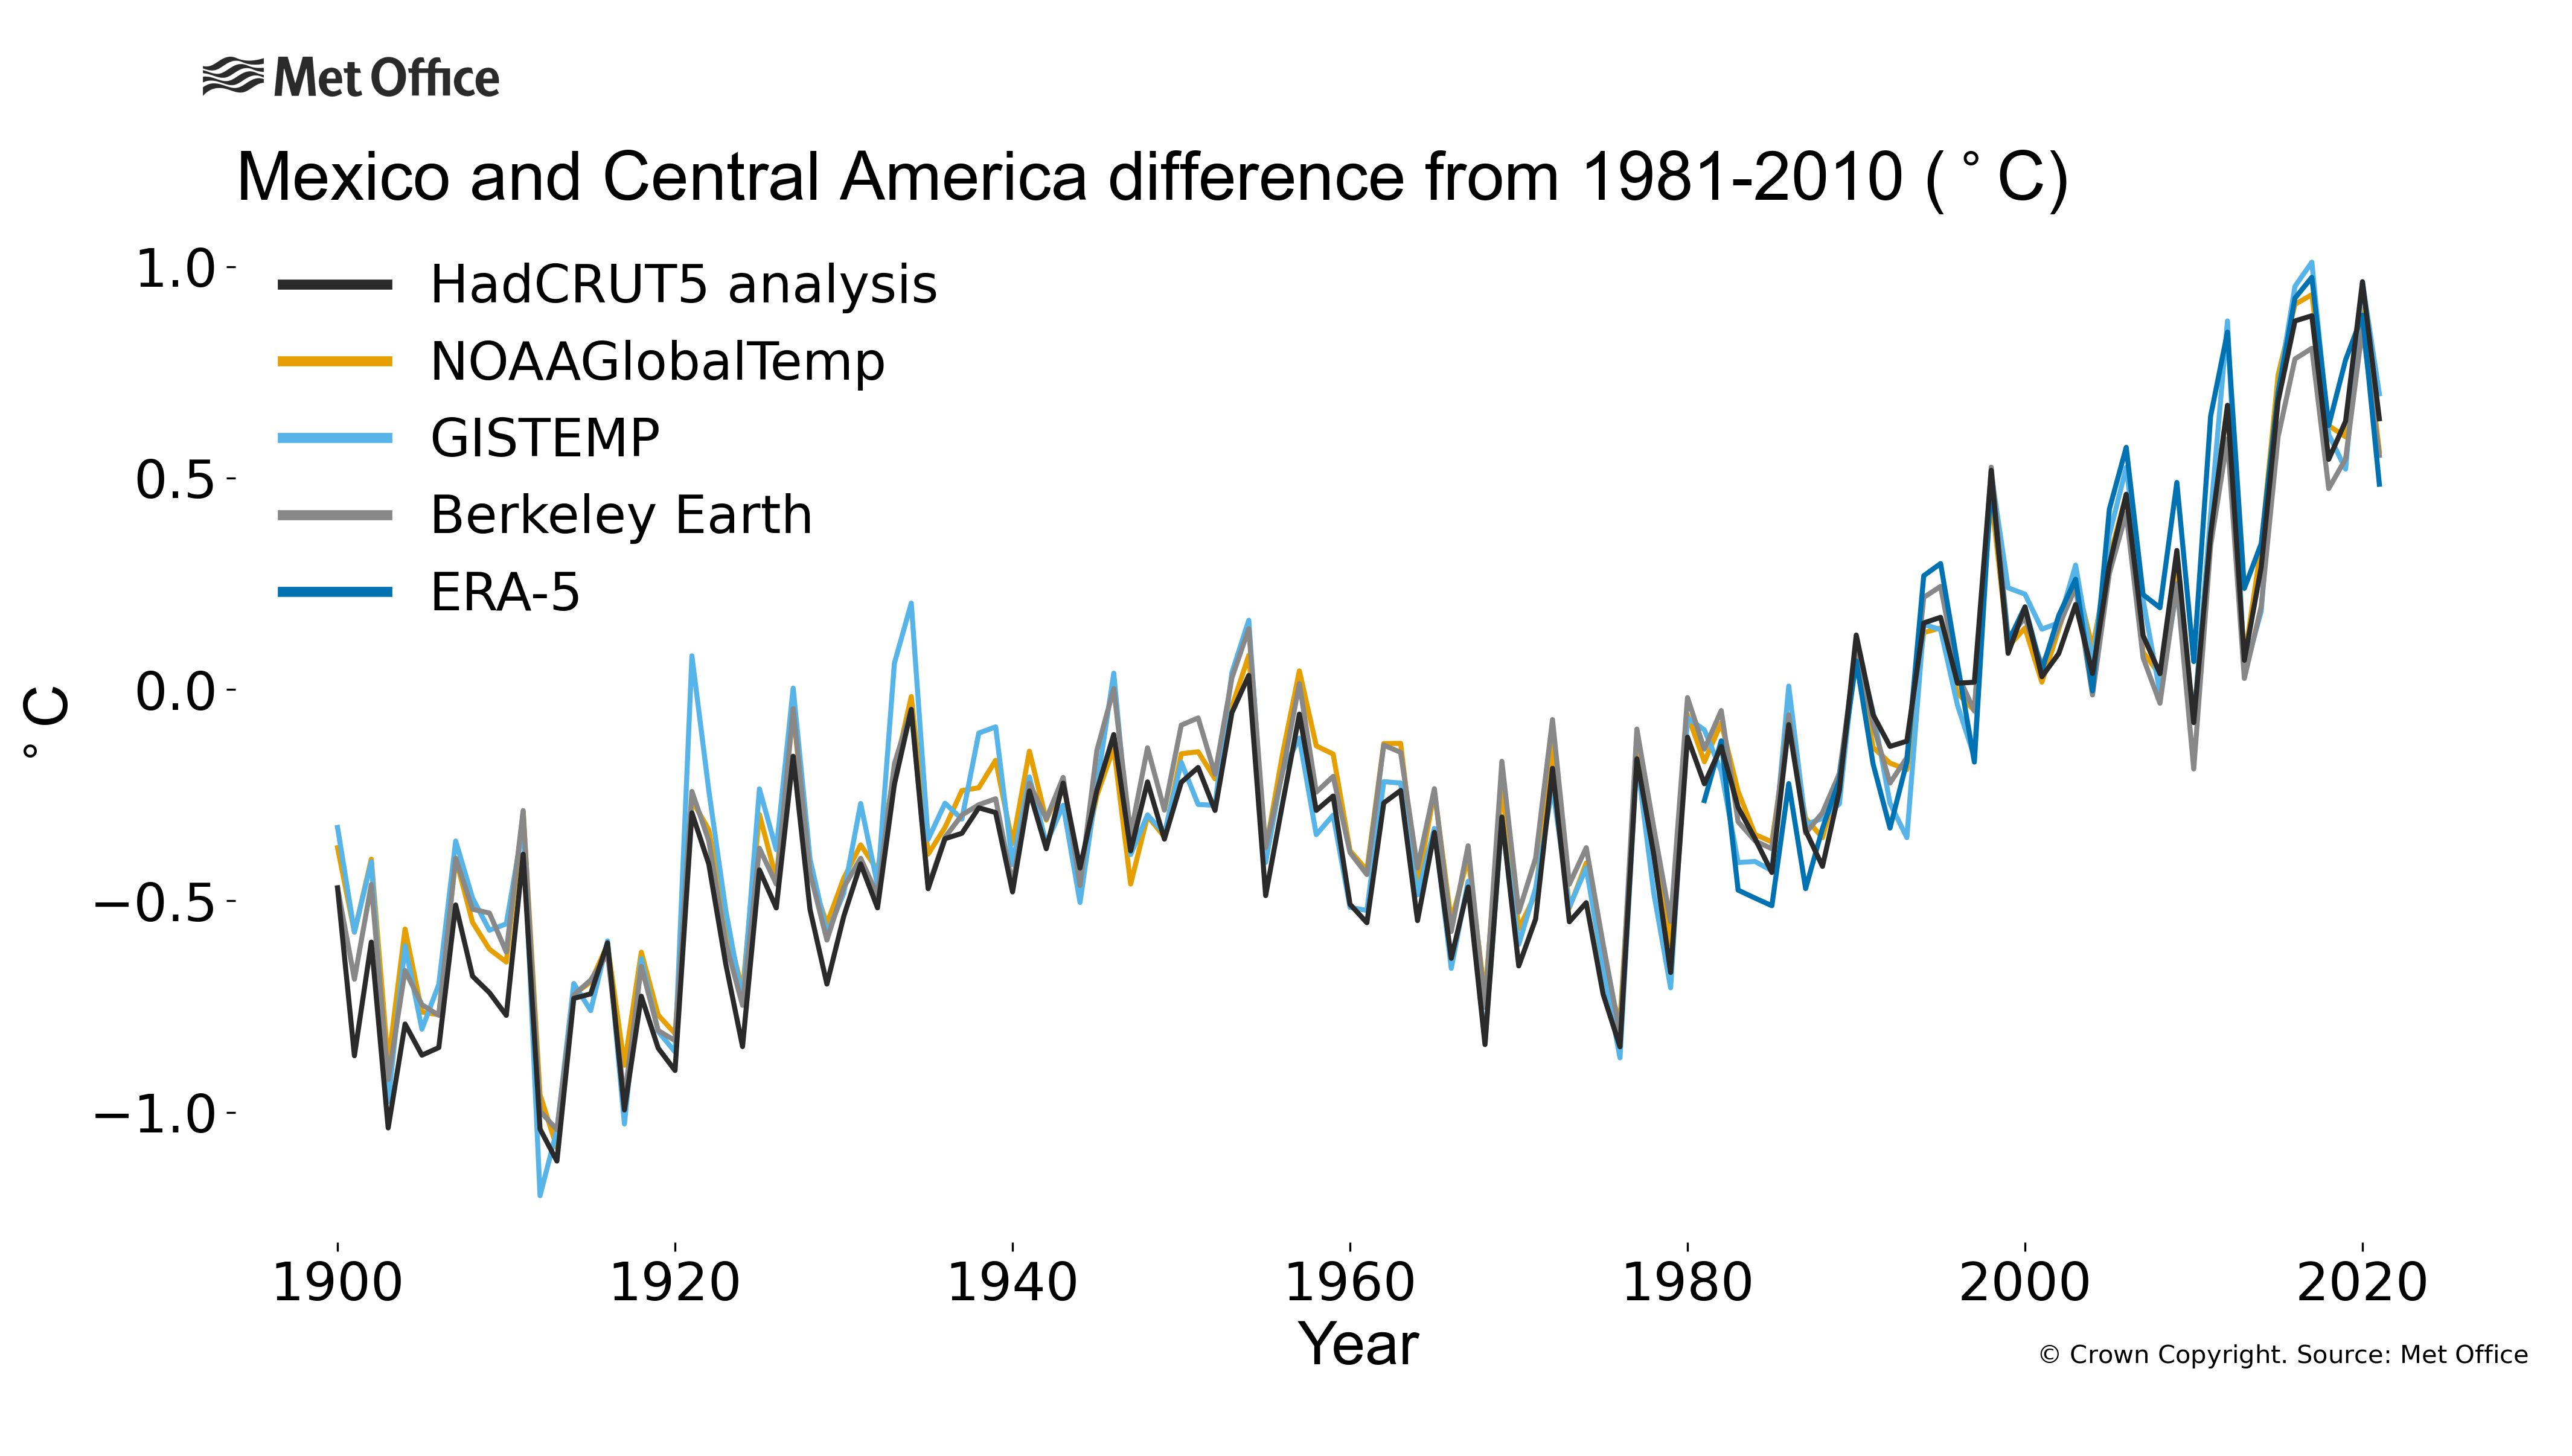
Mexico and Central America: The temperature anomaly for 2021 was between 0.49 and 0.70 °c above the 1981-2010 average depending on the data set considered. the mean of the 5 data sets is 0.59 °c. The temperature anomaly relative to 1961-1990 for 2021 was between 0.87 and 1.08 °c above the 1961-1990 average depending on the data set considered. the mean of the 4 data sets is 0.97 °c. Time series figure: png pdf
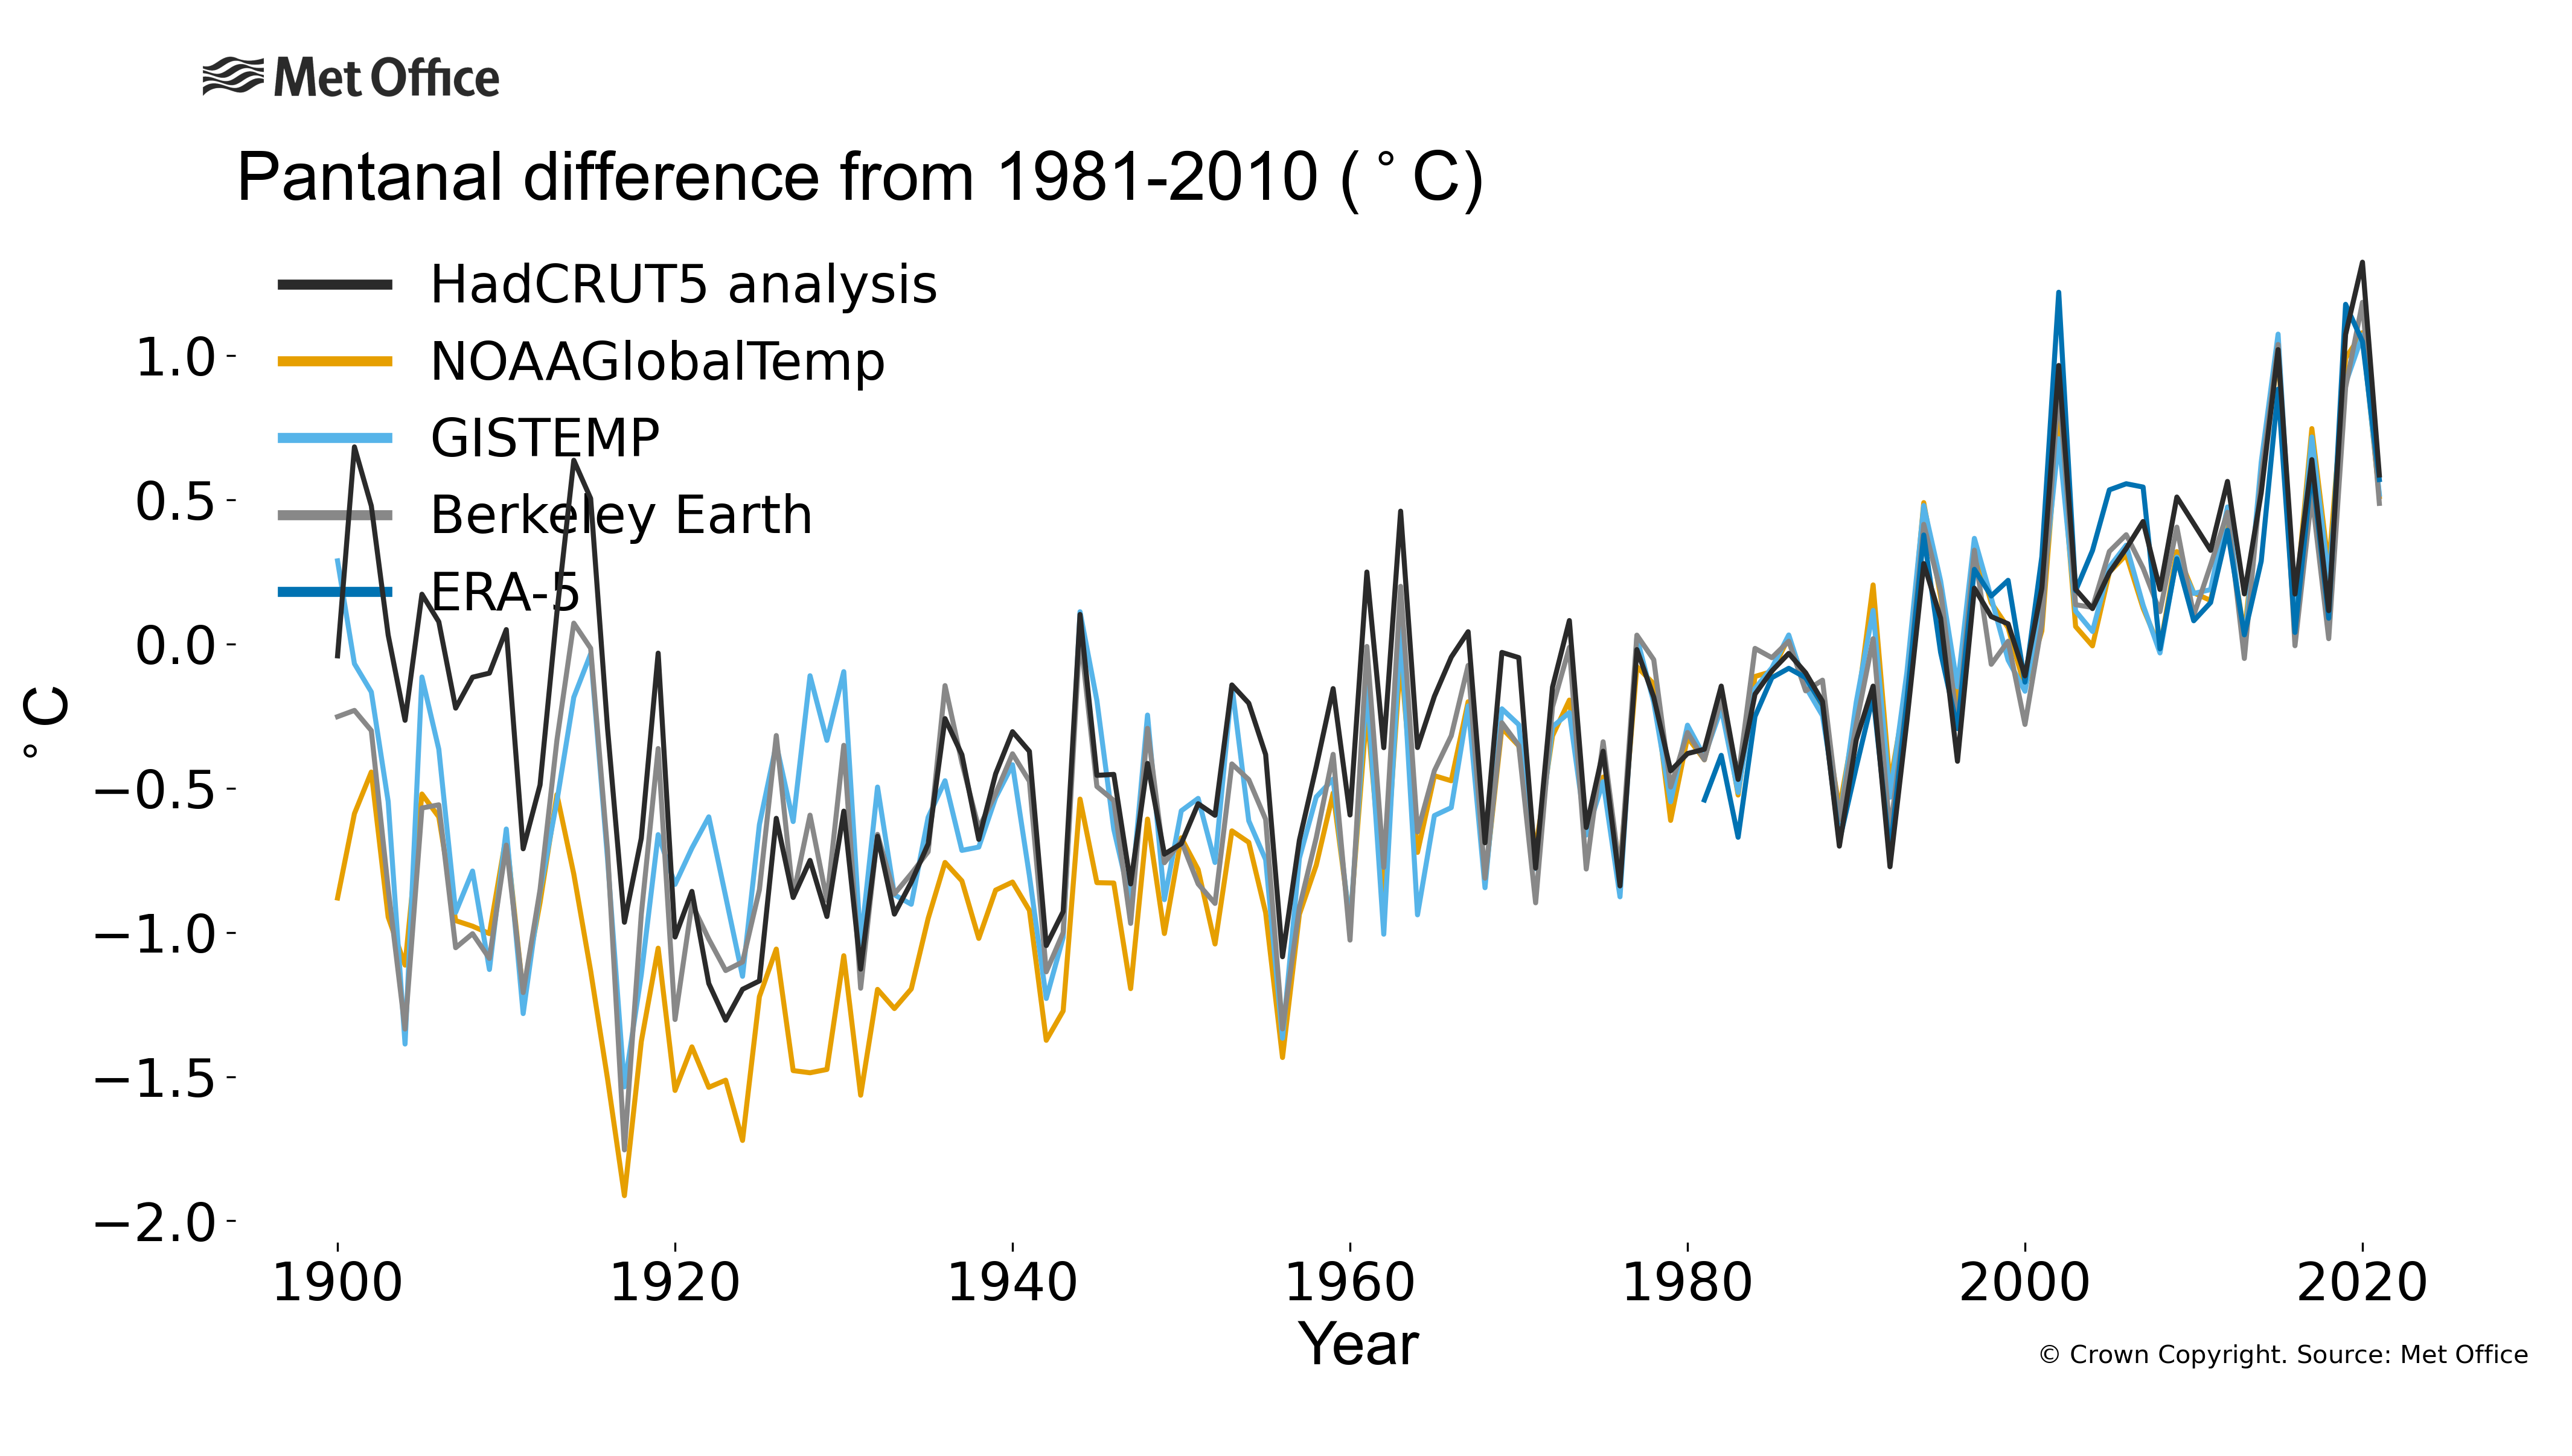
Pantanal: The temperature anomaly for 2021 was between 0.49 and 0.59 °c above the 1981-2010 average depending on the data set considered. the mean of the 5 data sets is 0.53 °c. The temperature anomaly relative to 1961-1990 for 2021 was between 0.81 and 0.91 °c above the 1961-1990 average depending on the data set considered. the mean of the 4 data sets is 0.86 °c. Time series figure: png pdf
Find out more about
temperature change in wmo ra iii - south america
 for WMO RA III - South America. Data are from six different data sets: HadCRUT5, NOAAGlobalTemp, GISTEMP, Berkeley Earth, ERA5 and JRA55.")
The plot shows annual average temperature anomalies (relative to 1981-2010) for WMO RA III - South America. Data are from six different data sets: HadCRUT5, NOAAGlobalTemp, GISTEMP, Berkeley Earth, ERA5 and JRA55.
The plot shows annual average temperature anomalies (relative to 1981-2010) for WMO RA III - South America. Data are from six different data sets: HadCRUT5, NOAAGlobalTemp, GISTEMP, Berkeley Earth, ERA5 and JRA55.

The plot shows the trends for four thirty-year periods as indicated on the x-axis. The coloured bars are the average
trend calculated over each period for each of six data sets: HadCRUT5, NOAAGlobalTemp, GISTEMP, Berkeley Earth, ERA5 and JRA55.
The black vertical line indicates the range of the six estimates.
