Arctic and Antarctic end-of-season report - October 2023
Alex West and Ed Blockley
Summary
- September Arctic sea ice extent was 4.37 million sq km, the joint-4th lowest in the satellite era (since 1979).
- Extent was well below average on the Pacific side of the Arctic but near-average on the Atlantic side.
- This September’s extent was notably lower than the last two years; one cause is likely to be the Arctic Dipole pattern which was active during July, and is often associated with severe Arctic sea ice melt.
- September Antarctic sea ice extent was the lowest on record by a very large margin at 16.80 million sq km, continuing a period of exceptionally low sea ice extent that began in May.
- There is not yet scientific consensus on the causes of this, but it continues a longer period of below-average Antarctic sea ice extent that began in 2016 and is likely associated with winds mixing warm waters upwards in the Southern Ocean.
Arctic sea ice extent
September average Arctic sea ice extent was 4.37 million sq km. This was the joint-4th lowest September extent in the satellite record since 1979, equal with 2019 and higher than only 2012, 2020 and 2007. It was 2.04 million sq km below the 1981-2010 average, and very close to the long-term linear trend line (Figure 1).
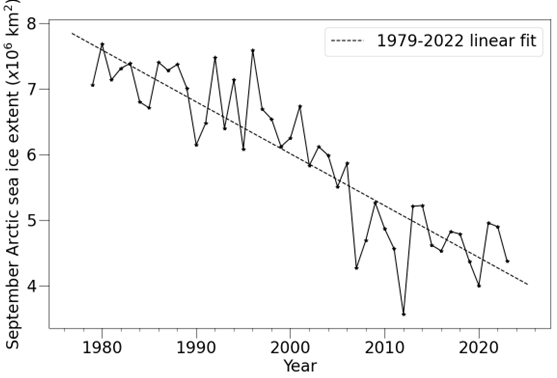
Figure 1. September Arctic sea ice extent during the satellite era, according to the NSIDC Sea Ice Index (Fetterer et al., 2017), with linear trend indicated.
September extent was exceptionally lower than average in the Beaufort, Chukchi and East Siberian Seas on the Pacific Ocean side of the Arctic, where it was similar to that recorded in 2012 when the record-low September extent occurred. However, extent was nearer average, and well above the level of 2012, in the Laptev, Kara and Barents Seas on the Atlantic Ocean side of the Arctic (Figure 2).
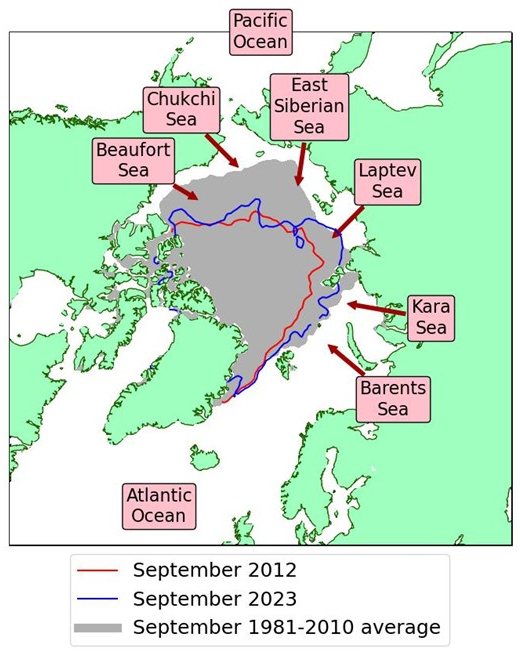
Figure 2. Arctic sea ice extent in September 2023, compared to the record low year of 2012 and the 1981-2010 average, with regions named in the text labelled. Data are from EUMETSAT OSI SAF (Tonboe et al., 2017).
The Arctic sea ice melt this summer, while not record breaking, contrasts strongly to the last two years, which have seen September extents well above the long-term trend. One likely cause of the more severe sea ice melt seen this year is the Arctic Dipole weather pattern observed during July, with high pressure over the North American Arctic and low pressure over the Siberian Arctic. This pattern is often associated with severe ice melt because it tends to blow warm air from midlatitudes over the Arctic and move sea ice out of the Arctic Ocean into warmer waters. During July, sea ice melt was much greater than average throughout the Pacific side of the Arctic Ocean; the resulting areas of open water would subsequently have absorbed more sunlight, helping to sustain higher melt rates throughout August despite much weaker circulation of air during this month (Figure 3).
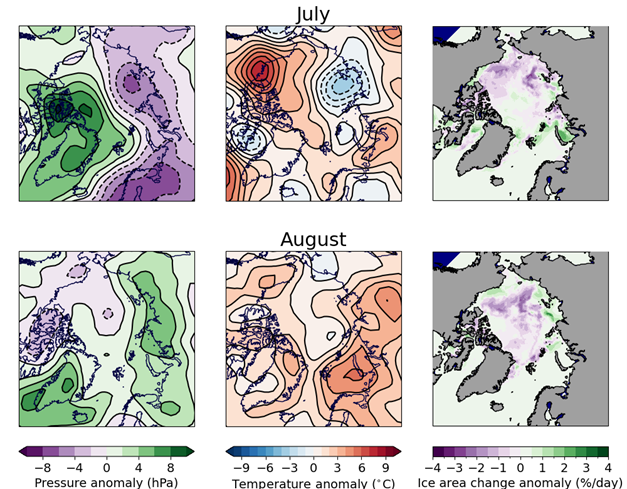
Figure 3. Anomalies of mean sea level pressure (left column), 925hPa temperature (middle column) and ice area rate of change (right column) for July and August 2023. Data are from the NCEP reanalysis for temperature and pressure (Kalnay et al., 1996) and EUMETSAT OSI-SAF (Tonboe et al., 2017) for ice area. Anomalies are relative to the 1981-2010 average. For the ice area, purple indicates areas of faster than average melting while green indicates slower than average.
Assessment of Arctic sea ice predictions
During the summer, the Sea Ice Prediction Network (SIPN) collates predictions of September Arctic sea ice extent from scientific centres around the world and publishes these predictions in a series of monthly Sea Ice Outlooks (SIO), from June to September. In 2023, sea ice extent fell towards the lower end of prediction ranges in all four reports, particularly that of July (Figure 4).
Met Office statistical predictions of September extent are evaluated in Figure 4 alongside the SIO predictions. These statistical predictions, described in the July and August briefings, were made using correlated anomalies with the most recent 15 days of data (blue line and filled region) and historical melt trajectories (red line and filled region). Sea ice extent for September 2023 tended to lie towards the lower end of prediction ranges for both methods throughout the melt season (Figure 4). This is likely because the immediate effect of the July Arctic Dipole was to cause an Arctic-wide drop in ice concentration, which did not feed through into ice extent until much later in the season.
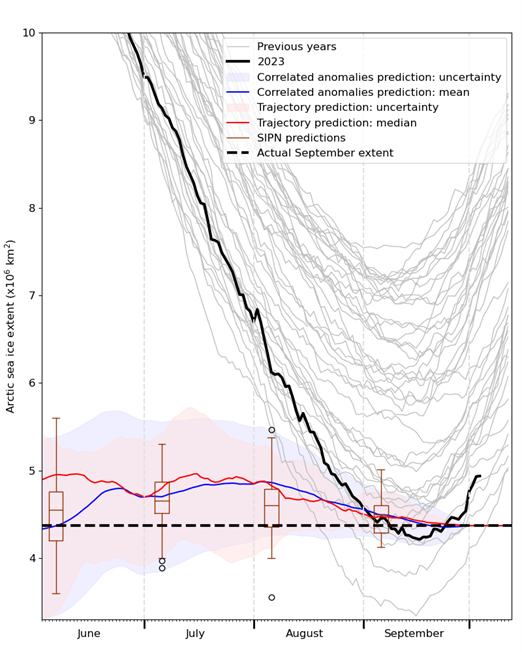
Figure 4. An evaluation of predictions of 2023 September sea ice extent submitted to the Sea Ice Prediction Network (SIPN), alongside statistical predictions performed for the July and August sea ice briefings. Evolution of sea ice extent during the summer in 2023 and previous years is shown for context.
Antarctic sea ice extent
September Antarctic sea ice extent was the lowest on record by a very wide margin at 16.80 million sq km (Figure 5). This was 1.69 million sq km below the 1981-2010 average and considerably lower than the lowest previously recorded extent of 17.69 million sq km in 1986. Extent was particularly low in the Ross Sea, eastern Weddell Sea, and Indian Ocean sector (Figure 6). The 2023 September extent continues a longer period of exceptionally low sea ice extent that began in May: from 5th June – 24th August, Antarctic sea ice extent was consistently more than 2 million sq km below the 1981-2010 average. As of 8th October, Antarctic sea ice extent remains well below previous record lows for the date, 1.82 million sq km below the 1981-2010 average.
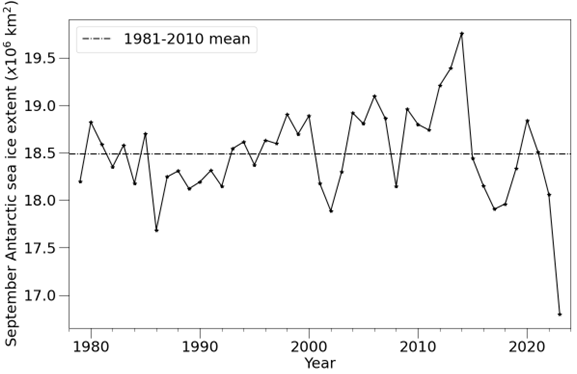
Figure 5. September Antarctic sea ice extent during the satellite era, according to the NSIDC Sea Ice Index (Fetterer et al., 2017), with linear trend indicated.
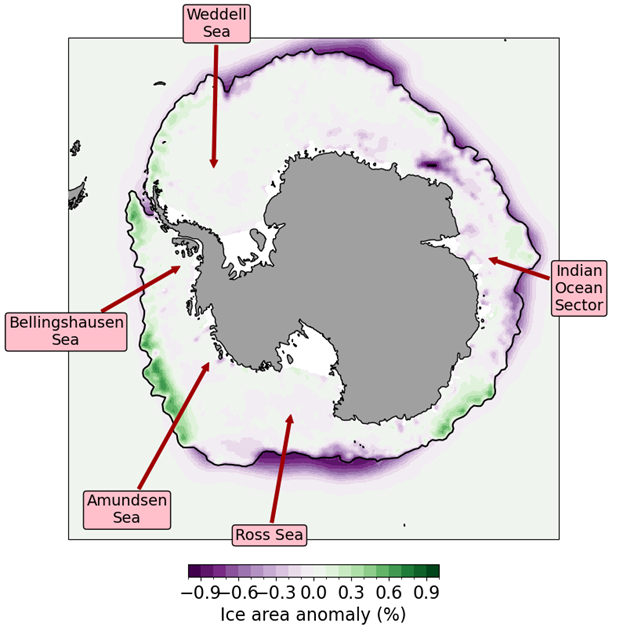
Figure 6. Antarctic sea ice at maximum extent on 11th September. The black line indicates the sea ice edge at maximum extent; the shading indicates the anomaly in ice concentration relative to the 1981-2010 average. Data is from EUMETSAT OSI SAF (Tonboe et al., 2017). Regions referred to in the text are labelled.
Antarctic sea ice extent during the satellite era has been characterised by substantial variability, particularly during the past 20 years (Figure 7). A period of near-flat sea ice extent was followed by a substantial rise from 2012-14 and then a rapid fall in 2015-16, followed by the current prolonged period of below-average extent. The extreme variability is encapsulated by the successive record high September extents of 2012-14 contrasting with the current extreme record low. Over the satellite era as a whole the trend in ice extent is near-zero, the most recent 15-year trend is significantly negative, while trends up until the period 2012-15 were significantly positive (Figure 8).
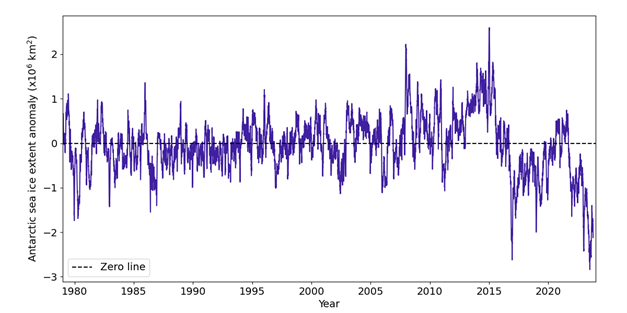
Figure 7. Antarctic sea ice extent anomaly relative to the 1981-2010 average over the satellite era (since 1979).
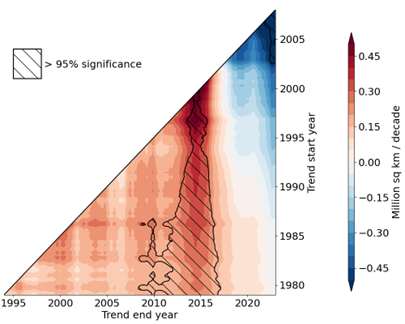
Figure 8. Trends in Antarctic sea ice extent over all periods of at least 15 years in the satellite era with estimates of statistical significance overlaid. The figure demonstrates that for a long time Antarctic sea ice extent was characterised by gently, then sharply rising trends (left and centre of figure) but more recently by rapid decline (top right).
The persistent low sea ice extent since 2016 may be caused by changes in the upper ocean around Antarctica. Evidence from modelling and observations suggests that from 2000-2015, heat gradually accumulated in the subsurface ocean, partly because of strengthened westerly winds around Antarctica helping to mix ocean heat from warmer waters to the north. In late 2016, atmospheric conditions may have acted to bring this heat to the surface, where it has since persisted (Earys et al., 2021; Zhang et al., 2022). The same strengthened westerly winds of this period may have helped cause the temporary rise in sea ice extent of 2012-14, simply by blowing sea ice further away from Antarctica and exposing open water behind it, which would then form more ice.
There is no scientific consensus yet on the causes of the exceptionally low ice extents observed during 2023, including on the role of anthropogenic climate change. Antarctic sea ice extent is projected to decrease in the future by most climate models (Holmes et al., 2021). Models have struggled to reproduce the rising trend of Antarctic sea ice from 1979-2015 (Roach et al., 2020); the current flat trend is likely more consistent with model simulations of Antarctic sea ice. However, uncertainty in the accuracy of model simulation of Antarctic sea ice is very substantial. Further extreme variability of Antarctic sea ice, in either direction, cannot be ruled out in the years and decades ahead.
It is likely that atmospheric circulation helped to cause the very low extent as well, as persistent areas of northerly and southerly winds increased heat exchange with midlatitudes. From May-August 2023, weather around Antarctica was dominated by higher-than-average pressure north of the Ross and Amundsen seas (Figure 9). Early in the season, this was complemented by lower-than-average pressure to the east, corresponding to a strengthened, east-shifted Amundsen Sea Low; later in the season, this dissipated as the high pressure moved further east.
Notably, the position of the largest extent anomalies has changed as the season has progressed. For most of May and June, the low sea ice extent was dominated by the Weddell and Bellingshausen Seas region, to the east of the strengthened Amundsen Sea Low, where warm northerlies dominated. During July, extent in the Weddell and Bellingshausen Seas recovered closer to average as the Amundsen Sea Low weakened, but sea ice extent in the Ross Sea became much lower than average, as the high pressure system moved to direct warm northerly winds over this region instead.
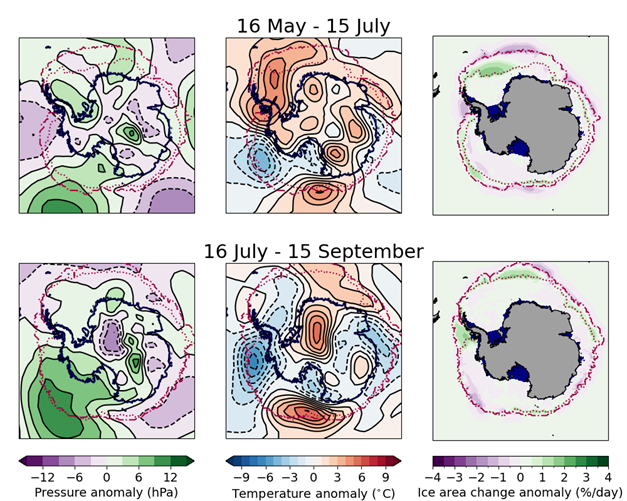
Figure 9. Anomalies of mean sea level pressure (left column), 925hPa temperature (middle column) and ice area rate of change (right column) for indicated periods of the 2023 Antarctic sea ice growth season. In all panels, the sea ice edge at the beginning (dotted line) and end (dot-dashed line) of the period is indicated in maroon. Data are from the NCEP reanalysis for temperature and pressure (Kalnay et al., 1996) and EUMETSAT OSI-SAF (Tonboe et al., 2017) for ice area. Anomalies are relative to the 1981-2010 average. For the ice area, purple indicates areas of slower than average growth while green indicates faster than average growth.
References
Eayrs, C., X. Li, M.N. Raphael and D.M. Holland (2021) Rapid decline in Antarctic sea ice in recent years hints at future change. Nat. Geosci., 14, 460–464. https://doi.org/10.1038/s41561-021-00768-3
Fetterer, F., K. Knowles, W.N. Meier, M. Savoie and A.K. Windnagel (2017) Sea Ice Index, Version 3. Boulder, Colorado USA. National Snow and Ice Data Center. https://doi.org/10.7265/N5K072F8. Date Accessed: 03-07-2023.
Holmes, C.R., T.J. Bracegirdle and P.R. Holland (2022) Antarctic sea ice projections constrained by historical ice cover and future global temperature change. Geophys. Res. Lett., 49, e2021GL097413. https://doi.org/10.1029/2021GL097413
Kalnay, E., and Coauthors (1996) The NCEP/NCAR 40-Year Reanalysis Project. Bull. Amer. Meteor. Soc., 77, 437–472. https://doi.org/10.1175/1520-0477(1996)077<0437:TNYRP>2.0.CO;2
Roach, L.A., J. Dörr, C.R. Holmes, F. Massonnet, E.W. Blockley, D. Notz, T. Rackow, M.N. Raphael, S.P. O'Farrell, D.A. Bailey and C.M. Bitz (2020) Antarctic sea ice area in CMIP6. Geophys. Res. Lett., 47, e2019GL086729. https://doi.org/10.1029/2019GL086729
Tonboe, R., J. Lavelle, R.-H. Pfeiffer and E. Howe (2017) OSI SAF Global Sea Ice Concentration. Product OSI-401-b. Version 1.6. September 2017, Available at: https://osi-saf.eumetsat.int/products/osi-401-b
Zhang, L., T.L. Delworth, X. Yang, F. Zeng, F. Lu, Y. Morioka and M. Bushuk (2022) The relative role of the subsurface Southern Ocean in driving negative Antarctic Sea ice extent anomalies in 2016–2021. Commun. Earth Environ., 3, 302. https://doi.org/10.1038/s43247-022-00624-1


