

2023 was second warmest year on record for UK
Author: Press Office
13:17 (UTC) on Tue 2 Jan 2024
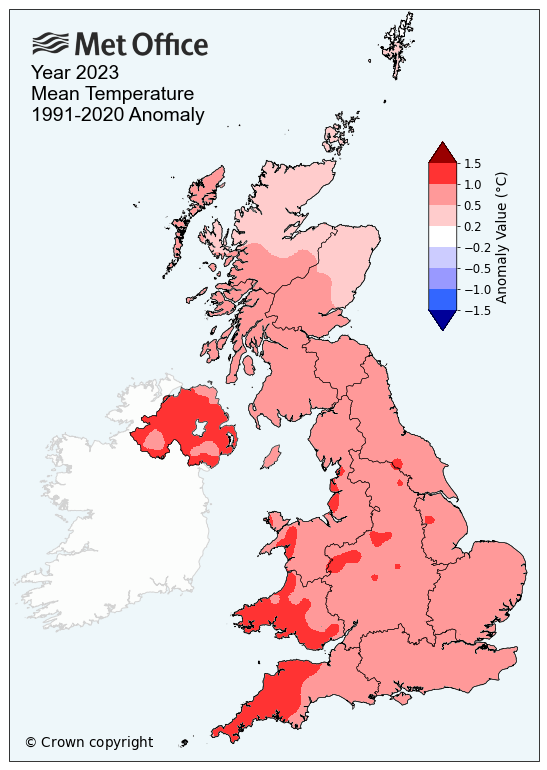
2023 was provisionally the second warmest year on record for the UK, with Wales and Northern Ireland having their respective warmest years in a series from 1884.
- Following last year’s record-breaking year, 2023 is provisionally the second warmest year for the UK according to mean temperature.
- Both Wales and Northern Ireland had their warmest years on record, meaning they’ve had consecutive warmest years on record.
- 2023 is provisionally the warmest year for the UK for minimum temperature.
- Human-induced climate change has made the UK’s 2023 mean temperature significantly more likely compared to a pre-industrial climate.
- Northern Ireland had its third wettest year in a series from 1836, and wettest since 2002.
UK climate continues to change
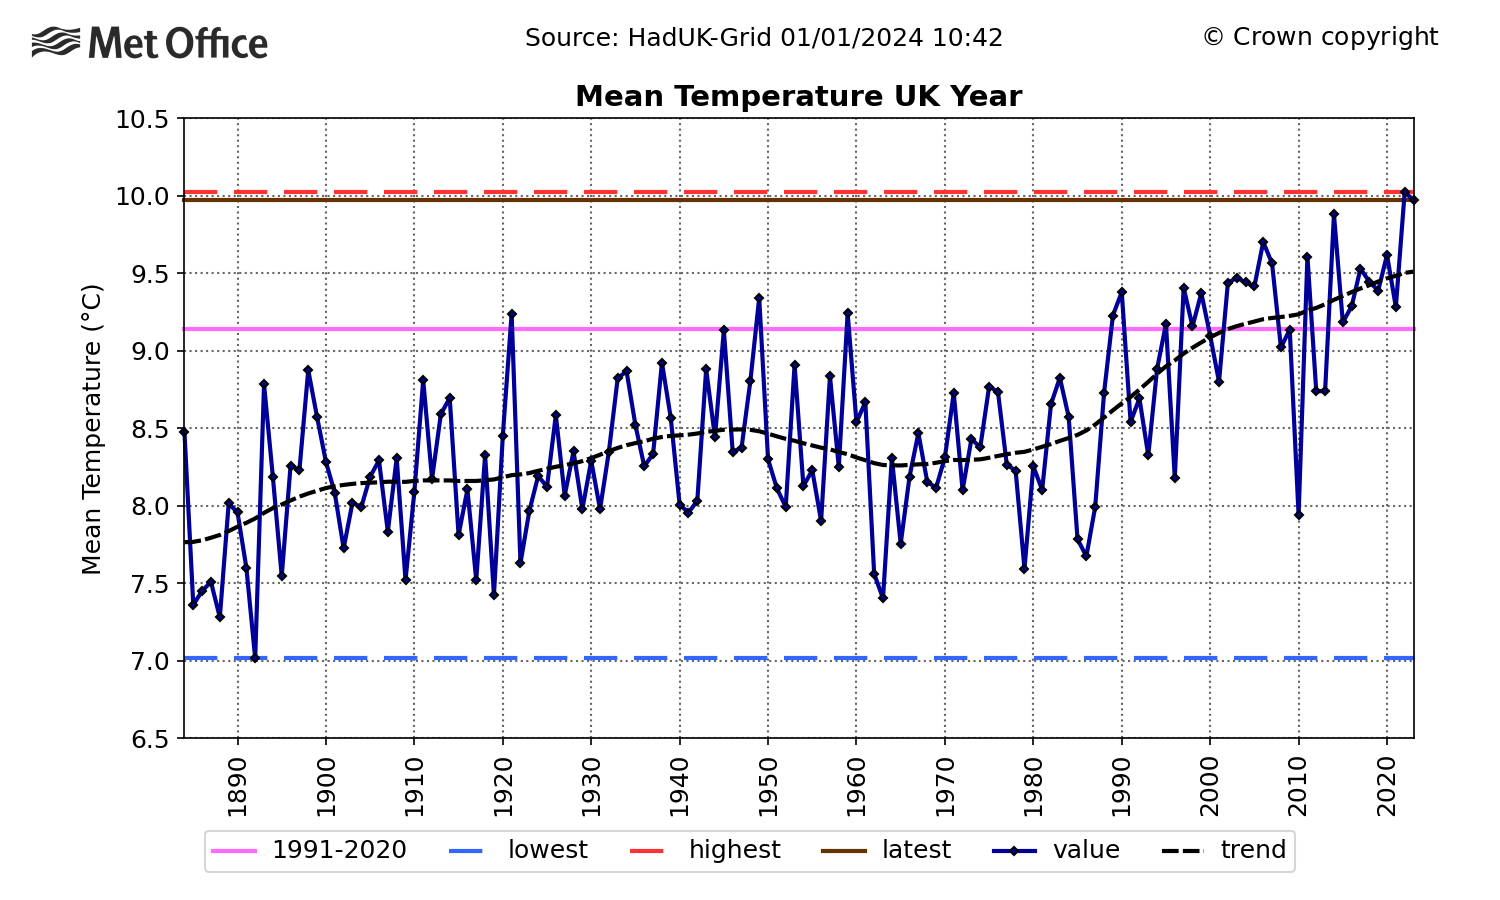
UK mean temperatures have been shifting over the decades as a result of human-induced climate change. The trend in UK climate observations is consistent with that observed globally: 2023 is on track to be Earth’s warmest year on record, while carbon dioxide concentrations in our atmosphere are at their highest for at least 2 million years. The five warmest years in the UK series from 1884 include 2022, 2023, and 2020 and the ten warmest years have all occurred since 2003.
2023’s provisional mean temperature of 9.97°C puts it just behind 2022’s figure of 10.03°C and ahead of 2014’s 9.88°C. 2023 was also ranked as the second warmest for Central England Temperature (CET), the world’s longest instrumental temperature series from 1659.
The below graph shows mean temperature for the UK for every year since 1884, with an added line depicting the underlying trend.
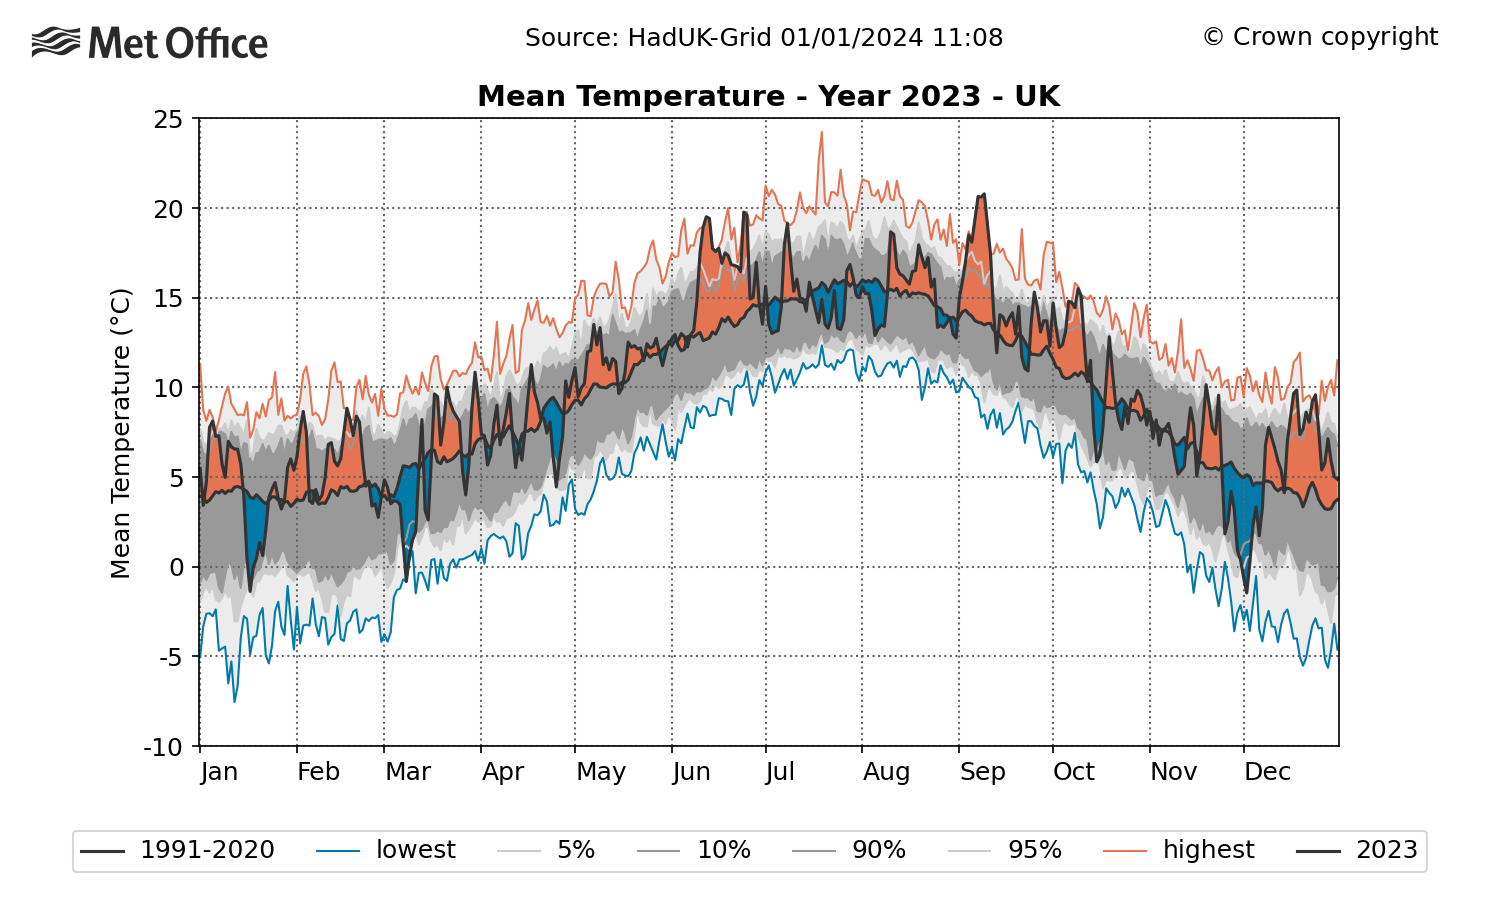
Eight of the 12 months of the year were warmer than average for the UK. June and September were particularly warm compared to average. It was the hottest June on record for the UK by a wide margin, and the joint-hottest September as temperatures in the year peaked at 33.5°C on 10 September – only the fifth time this has happened in September in observational records.
The graph below shows daily mean temperature compared to average for 2023 in the UK. Orange denotes warmer than average dates, with blue colder than average.
Wales and Northern Ireland have both now had consecutive warmest years on record, with 2023 topping their previous 2022 records.
Met Office Senior Scientist Mike Kendon said: “The observations of the UK climate are clear. Climate change is influencing UK temperature records over the long term, with 2023 going down as another very warm year and the second warmest on record. Had the 2023 value occurred during the 20th Century, it would have been, by far, the warmest year on record.
“While our climate will remain variable, with periods of cold and wet weather, what we have observed over recent decades is a number of high temperature records tumbling.
“We expect this pattern to continue as our climate continues to change in the coming years as a result of human-induced climate change.”
2023’s warmth was spearheaded by notable heatwaves in June and September and was backed up by above average temperatures for eight of the 12 months of the year.
Climate change’s influence on 2023 temperature
Climate attribution studies are used to analyse the influence of human activity on a specific climatological event. Attribution studies assess the chance of specific temperatures occurring in today’s climate, a ‘natural’ climate unaffected by human emissions and in a possible future climate further impacted by human caused greenhouse gas emissions.
A rapid attribution study by Met Office Scientists on the 2023 UK annual mean temperature shows that a mean temperature of 9.97°C would have been around a 1-in-500 year event (0.2% chance each year) in a climate unaffected by humans. In the current climate that annual mean temperature is around a 1-in-3 year event (33% each year) and by the end of the century, under a medium emissions scenario (SSP2-4.5), it could occur almost every year (79% each year).
Met Office Climate Attribution Senior Scientist, Dr Andy Ciavarella, said: “Observations are showing the UK’s climate is changing, but our attribution study, which compares today’s climate with one that was solely influenced by natural factors, has shown that human caused emissions of greenhouse gasses have made this much more likely.
“Using a CMIP6 multi-model ensemble, we have shown how the mean temperature seen in 2023 will occur more frequently in the coming years, as often as every year by the end of the century.”
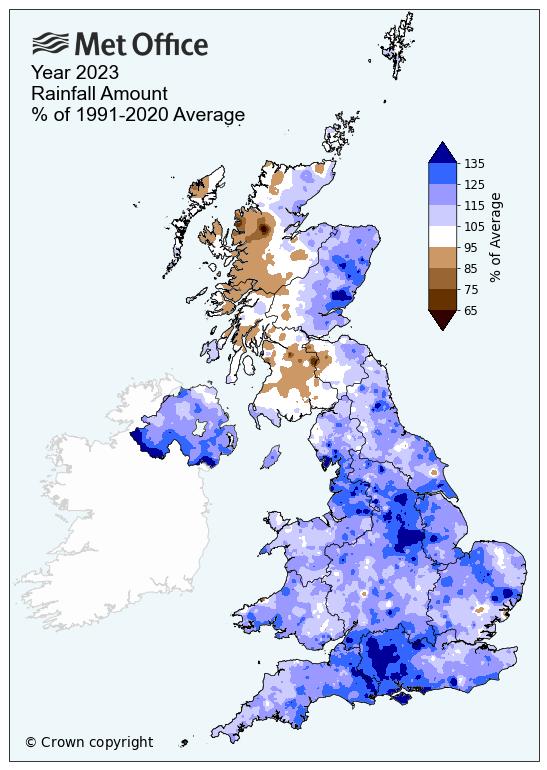
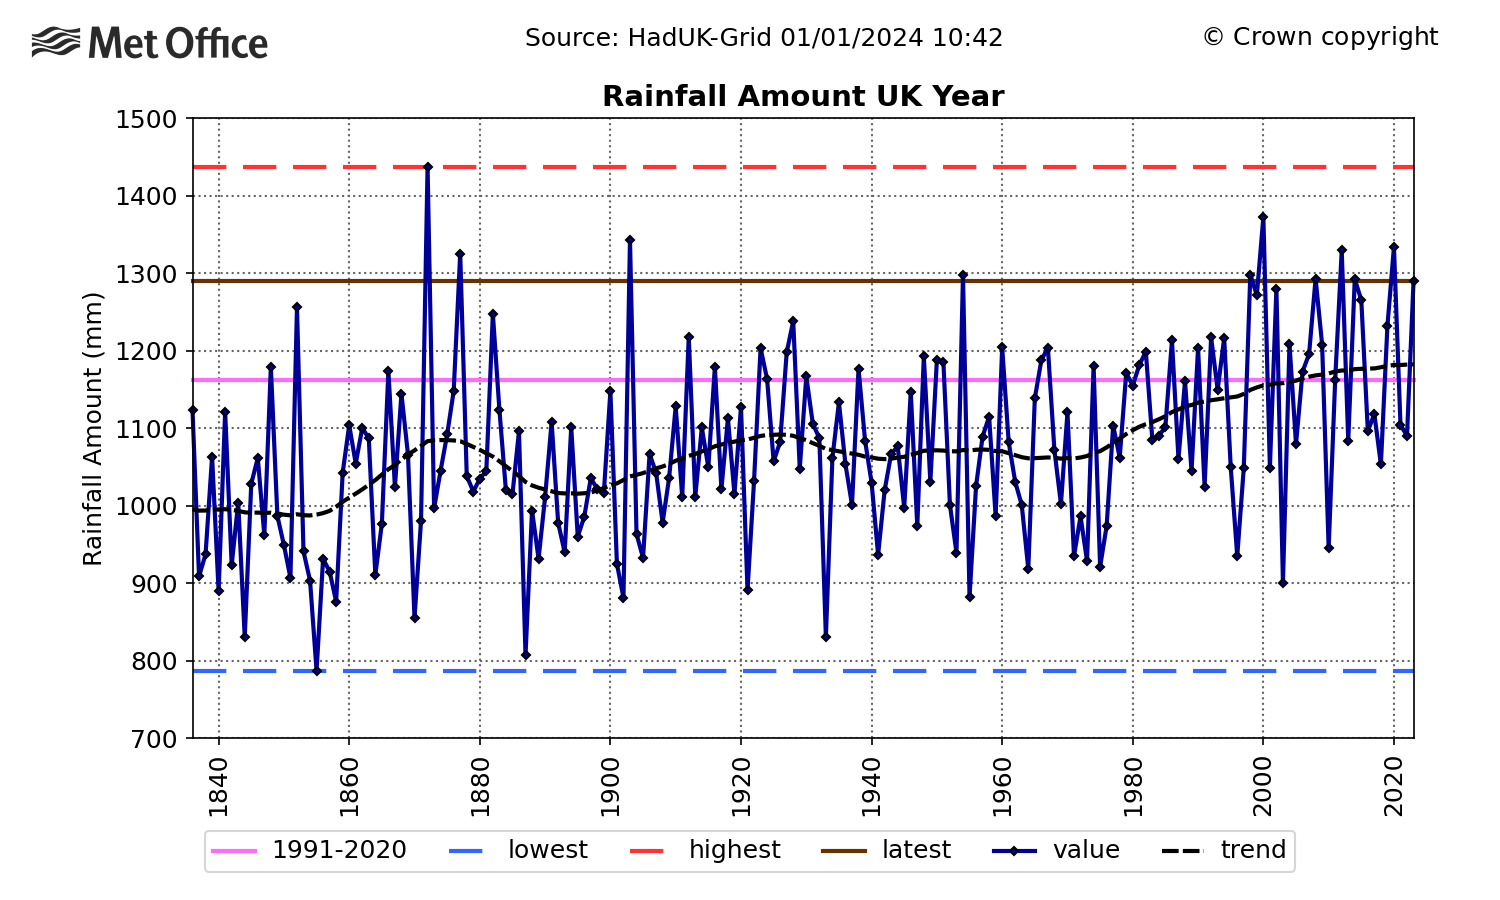
A wet year for many
The UK saw 11% more rain than average with a provisional figure of 1289.8mm falling. The year included the UK’s sixth wettest March, July and joint-sixth wettest October to help pep up rainfall totals.
Much of the country was wetter than average in the year, with Northern Ireland having its third wettest year on record in a series from 1836. Northern Ireland provisionally recorded 1399.0mm of rain, which is 21% more than average. England had its sixth wettest year on record (series from 1836), with 1045.4mm, or 20% more than average. Some parts of the UK recorded a third more rainfall than normal.
Mike Kendon continued: “Despite the mild conditions in the year, 2023 had more than its fair share of rain, with impactful storms like Babet and Ciaran also influencing the figures.
“Climate projections suggest an increase in the frequency of hotter, drier summers and warmer, wetter winters, and we’ve seen a generally warm and wet autumn and start to the 2023/2024 winter. Overall, this has been another wet year for the UK with 11% more rainfall than average. A warmer atmosphere has a greater capacity to hold moisture, so as our climate warms, we expect it to become wetter too and, while there is a large amount of annual variability, that trend is also apparent in the observations.”
Sunshine was near-average for much of the UK, though Scotland did have its ninth sunniest year on record in a series from 1910.
The full UK State of the Climate Report will be released later in 2024.
|
Provisional 2023 stats |
Max temp (°C) |
Min temp (°C) |
Mean temp (°C) |
Rainfall (mm/%) |
Sunshine (hours/ %) |
|||||
|
Actual |
91/20 anom |
Actual |
91/20 anom |
Actual |
91/20 anom |
Actual |
91/20 anom |
Actual |
91/20 anom |
|
|
UK |
13.66 |
0.87 |
6.31 |
0.78 |
9.97 |
0.83 |
1289.8 |
111 |
1435.4 |
102 |
|
England |
14.75 |
0.93 |
7.03 |
0.91 |
10.89 |
0.93 |
1045.4 |
120 |
1561.9 |
102 |
|
Wales |
13.82 |
0.90 |
7.03 |
1.09 |
10.41 |
1.00 |
1679.9 |
115 |
1356.9 |
96 |
|
Scotland |
11.79 |
0.72 |
4.84 |
0.44 |
8.28 |
0.59 |
1574.2 |
100 |
1280.2 |
107 |
|
Northern Ireland |
13.69 |
1.02 |
6.67 |
1.06 |
10.17 |
1.04 |
1399.0 |
121 |
1221.8 |
97 |
December statistics
December 2023 closed the year how meteorological autumn left it – largely warm and wet.
The UK’s mean temperature in the month of 5.8°C was 1.6°C above average, though not high enough to trouble the record.
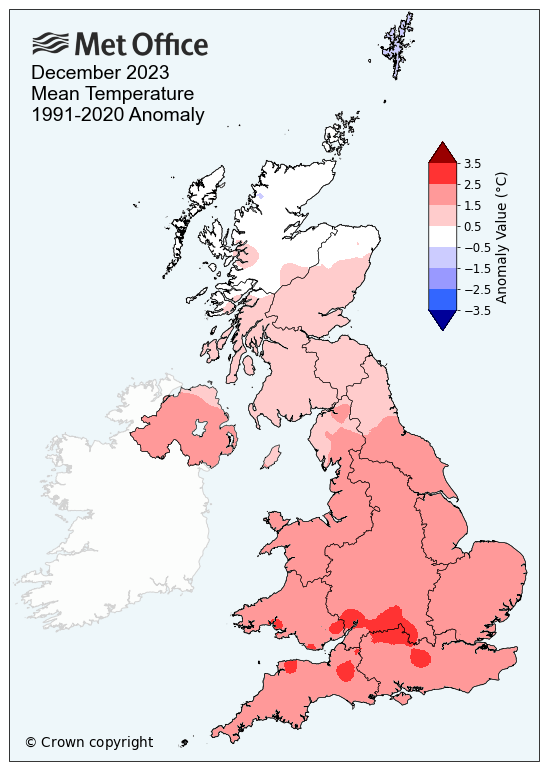
However, England, Wales and Northern Ireland had Decembers in their respective top 10 warmest, but were short of breaking any records.
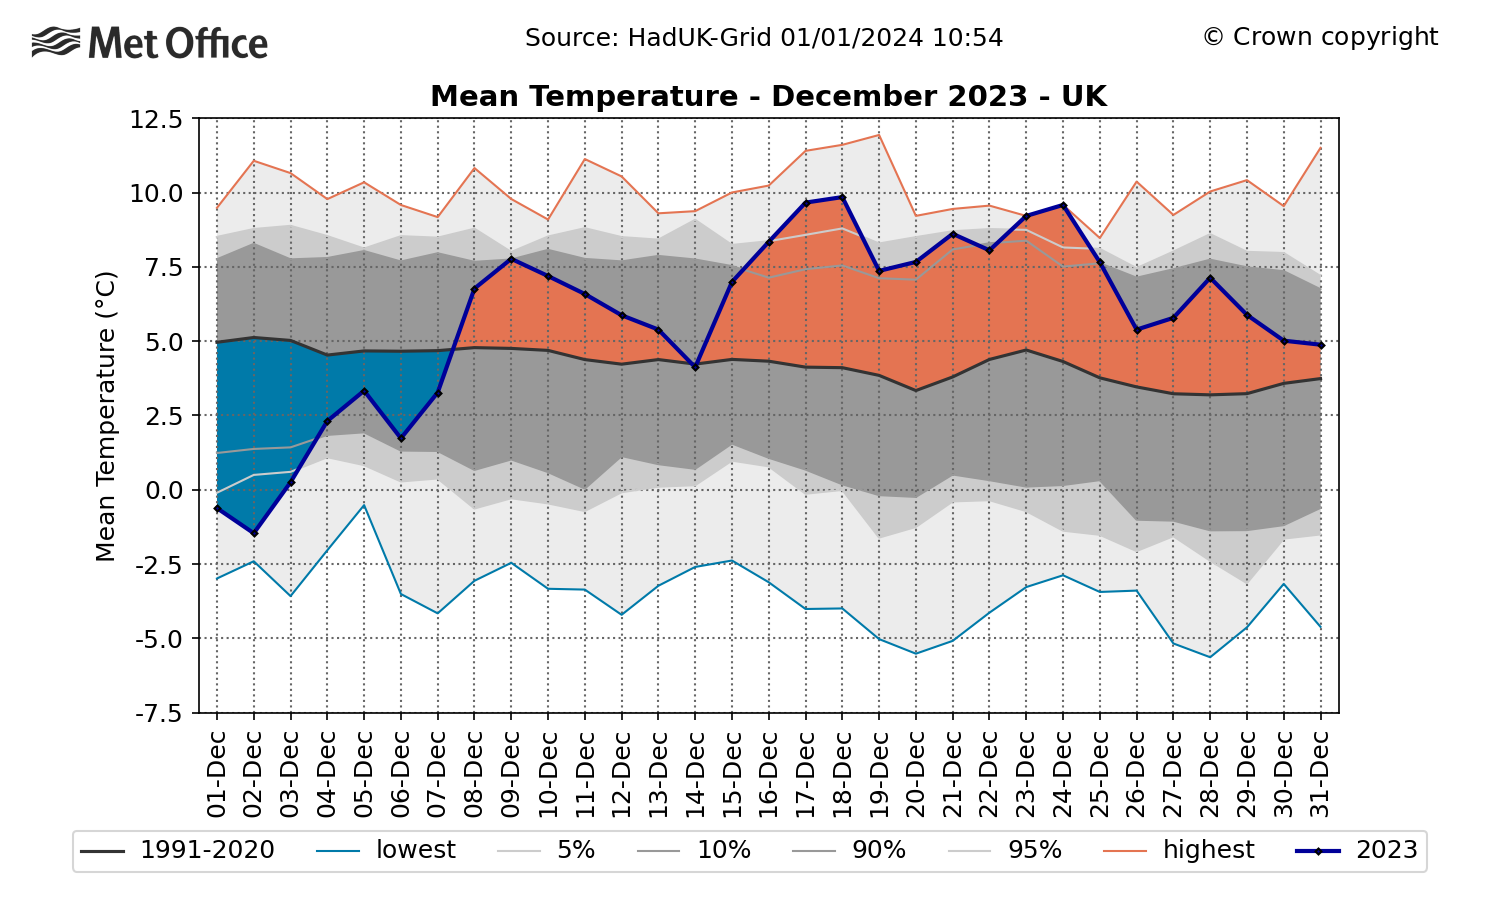
A cold start to December was swept away early in the month by storms Elin and Fergus, after which December was generally mild and unsettled. Storms Elin, Fergus and Gerrit all brought significant impactful weather in the month.
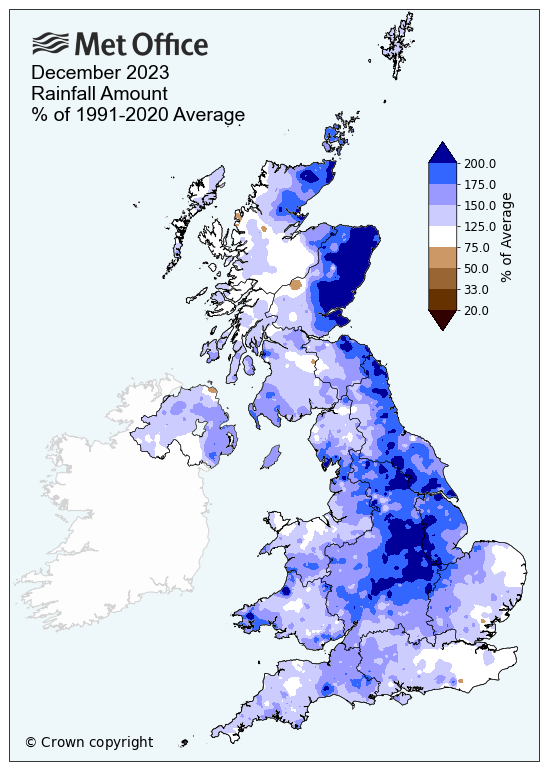
The UK had 48% more rainfall than average with 188.6mm falling, though it was chiefly counties in the north and northeast which were responsible for this.
Much of eastern Scotland received over twice the normal rainfall – this being very unwelcome following the record wet October in this area. Angus, Fife, Kincardineshire and Aberdeenshire were amongst a number of counties to have one of their ten wettest Decembers on record.
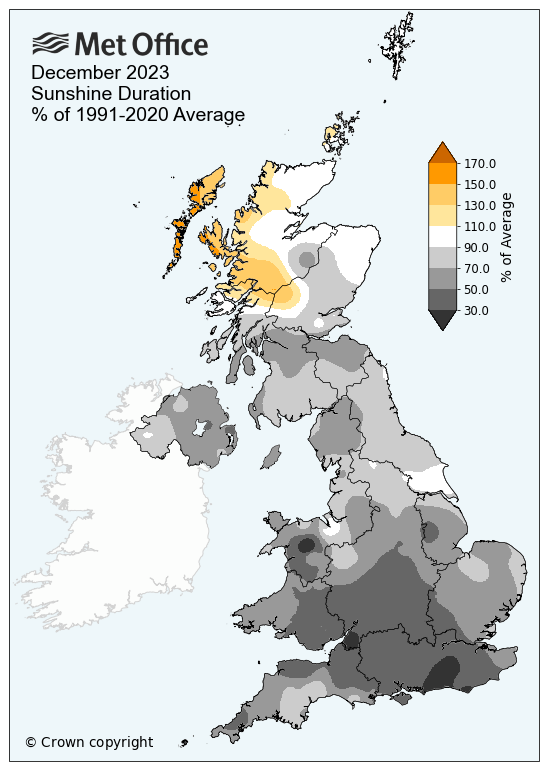
Sunshine amounts were particularly dull, with some counties seeing less than half their usual amount of sunshine hours in December, including Berkshire, East Sussex and Bristol. Most of the UK enjoyed only around 1 hour per day of sunshine, on average.
Wales had its third dullest December on record in a series back to 1910, with England having its eighth dullest.
The UK also had its eighth dullest December on record, with 27.9 hours of sunshine.
|
December 2023 provisional stats |
Max temp (°C) |
Min temp (°C) |
Mean temp (°C) |
Rainfall (mm/%) |
Sunshine (hours/%) |
|||||
|
Actual |
91/20 anom |
Actual |
91/20 anom |
Actual |
91/20 anom |
Actual |
91/20 anom |
Actual |
91/20 anom |
|
|
UK |
8.3 |
1.3 |
3.3 |
1.9 |
5.8 |
1.6 |
188.6 |
148 |
27.9 |
65 |
|
England |
9.4 |
1.8 |
4.3 |
2.4 |
6.8 |
2.1 |
145.0 |
158 |
29.7 |
58 |
|
Wales |
9.2 |
1.6 |
4.7 |
2.6 |
7.0 |
2.1 |
258.1 |
147 |
21.9 |
53 |
|
Scotland |
6.2 |
0.4 |
1.0 |
0.7 |
3.6 |
0.6 |
246.0 |
141 |
26.9 |
91 |
|
Northern Ireland |
8.9 |
1.4 |
4.2 |
2.3 |
6.5 |
1.8 |
169.6 |
140 |
25.1 |
66 |