

Joint-warmest September on record for UK
Author: Press Office
14:00 (UTC+1) on Mon 2 Oct 2023
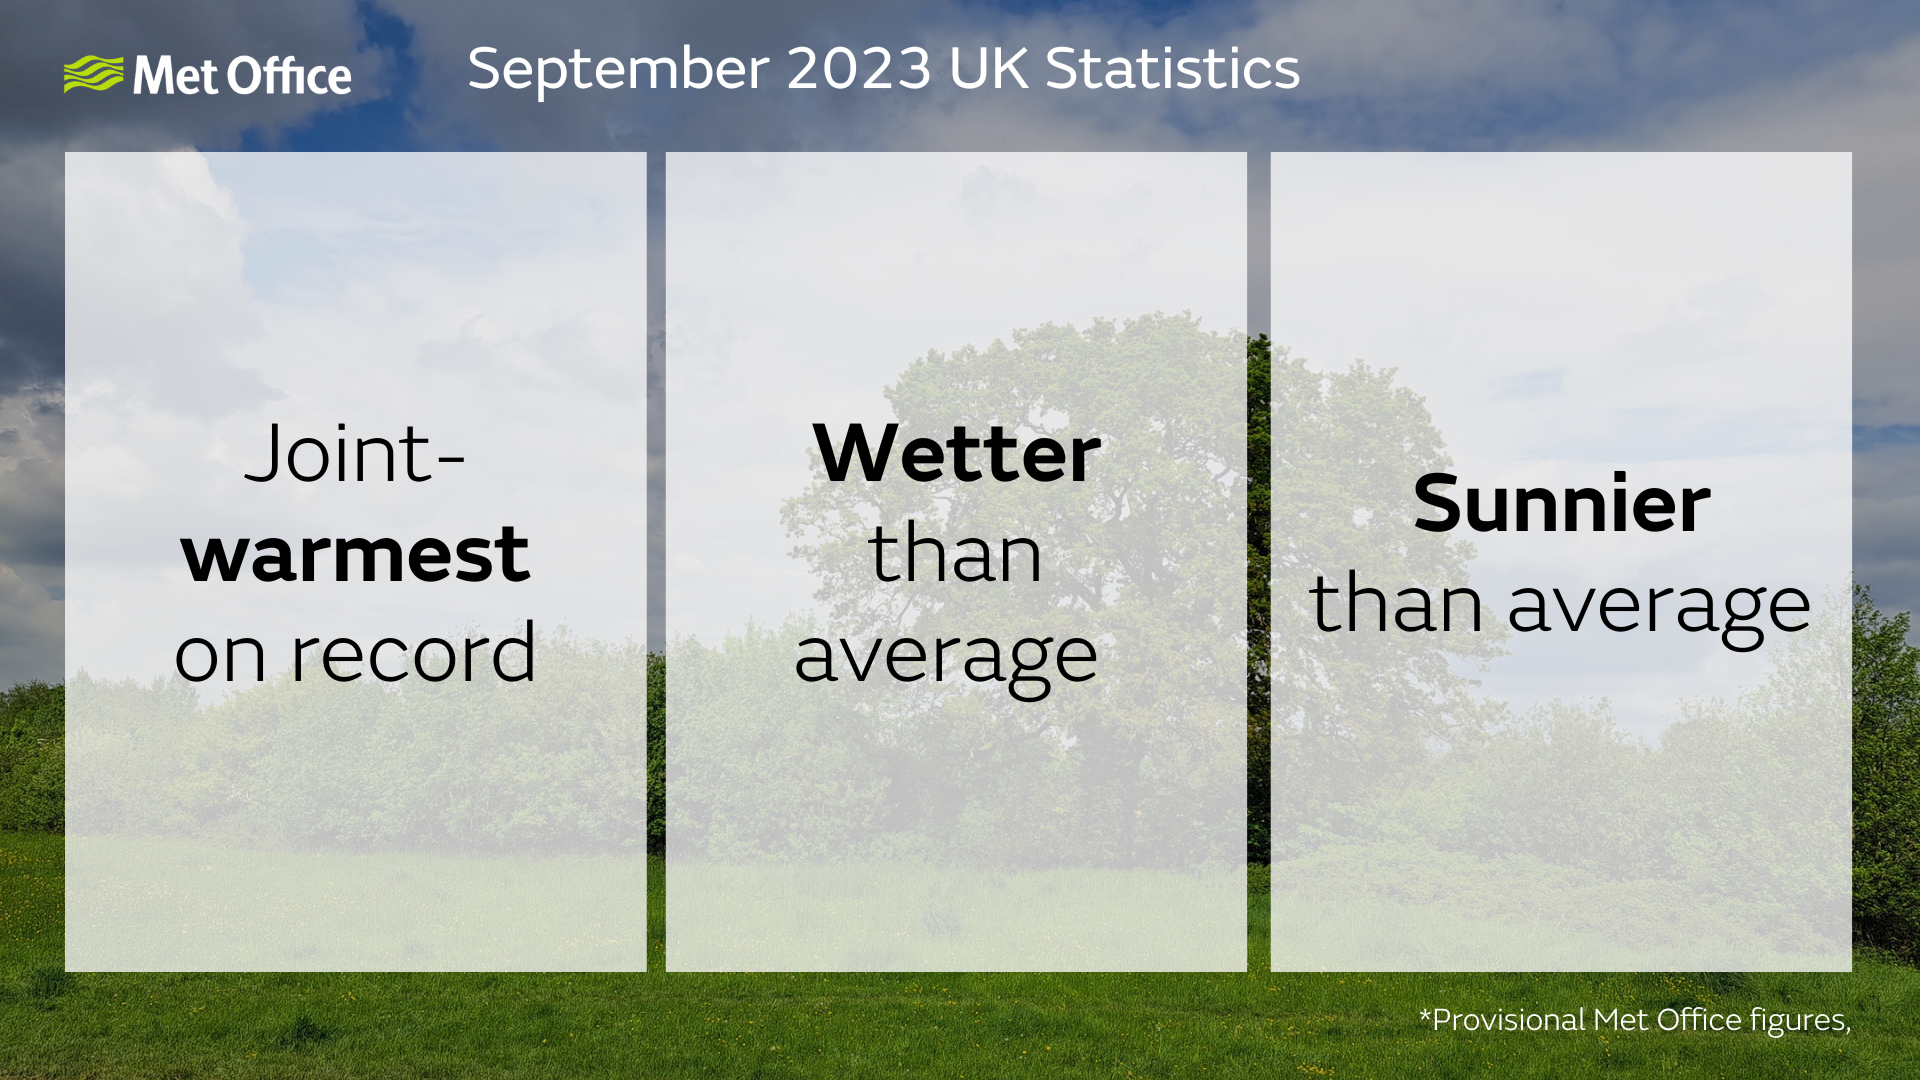
The UK had its joint-warmest September on record in a series which goes back to 1884 according to provisional Met Office statistics.
The UK had its joint-warmest September on record in a series which goes back to 1884 according to provisional Met Office statistics.
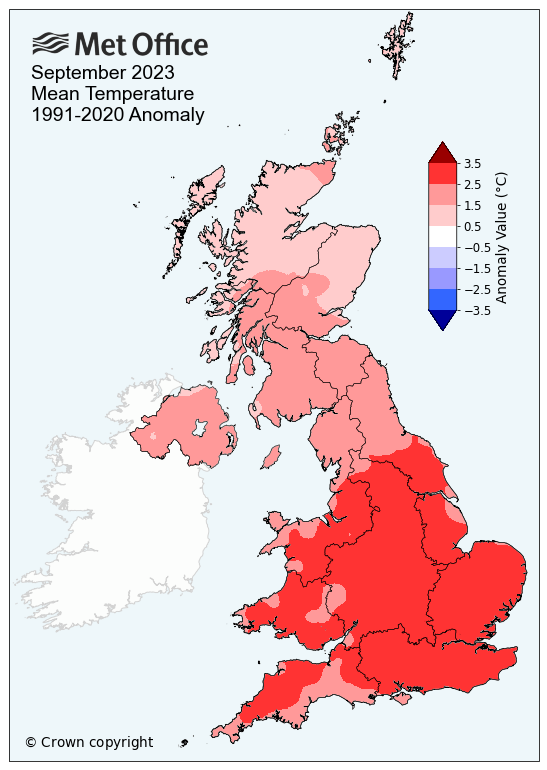
The UK’s September 2023 mean temperature of 15.2°C puts it level with 2006’s record figure in statistics that have been ‘substantially influenced’ by the impact of climate change.
England and Wales had their respective warmest September on record according to mean temperature. England’s provisional figure of 16.7°C topped the previous record of 16.5°C set in 2006. Wales’ 15.6°C also beat its 2006 figure of 15.2°C.
For Northern Ireland, September 2023 was the joint-warmest on record with an average mean temperature of 14.2°C putting it level with both 2006 and 2021’s figures.
Scotland provisionally had its third warmest September on record, with an average mean temperature of 12.8°C. Only 2021 and 2006 were warmer for the country according to September mean temperature.
Met Office Scientific Manager Mark McCarthy said: “This September’s temperature records are heavily driven by how significantly warm the first half of the month was. Not only did September have the hottest day of the year – something that has only happened on four previous occasions in our observations – but it also had seven consecutive days where temperatures were above 30°C somewhere in the UK, which had never happened in this month in Met Office observations.
“The significantly warm start to September was influenced by high pressure across Europe. This helped to draw warmer air over the UK at the start of the month. Once this pattern subsided, we had a more Atlantic influence, with periods of winds and rain, as well as Storm Agnes late in the month, yet often a south westerly flow resulting in above average temperatures but also humid conditions and plenty of rain.”
The graph below shows daily mean temperature averaged across the UK on each day of September 2023, showing how significantly warm the first half of the month was.
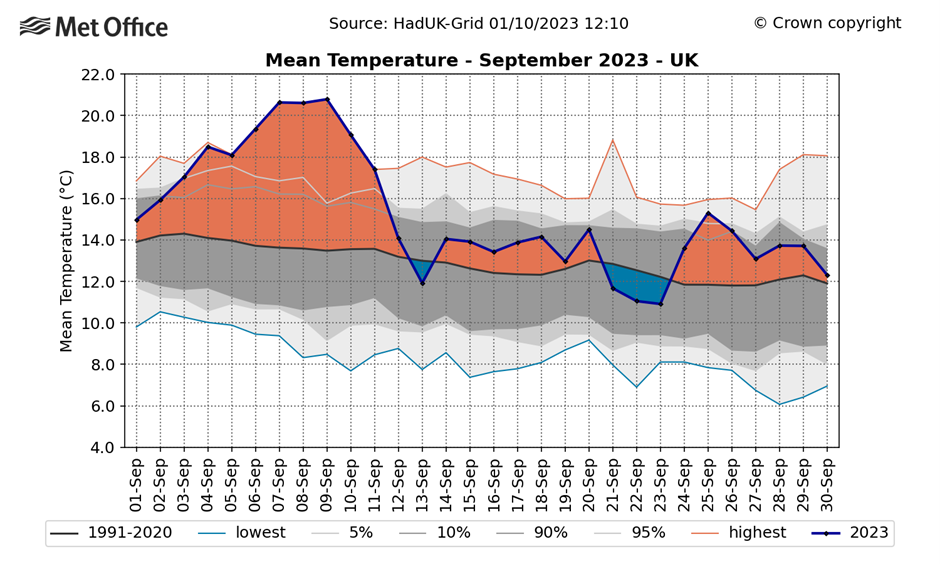
In more granular detail, average maximum temperature for September 2023 was also the joint-warmest on record for the UK, with 19.4°C. Average minimum temperatures were the UK’s second highest on record for the month.
Warmth a sign of a changing climate
According to a Met Office rapid attribution study, which looks at the likelihood of temperature thresholds being reached in climates with and without human emissions of greenhouse gasses, a UK September mean temperature of 15.2°C as seen this year would be virtually impossible without human-induced climate change.
In the current climate, where global temperatures have risen by around 1.1°C since the industrial revolution, there’s now a 3% chance in a given year of the mean September temperature reaching or exceeding 15.2°C for the UK.
Met Office Senior Scientist Jennifer Pirret, who works as part of the Weather and Climate Extremes Impacts Team, said: “September 2023’s temperature was substantially influenced by climate change and our attribution study shows how this figure would have been practically impossible in a climate without human-induced greenhouse gas emissions.
“While a 3% chance of these September temperatures occurring in the current climate might seem like a small amount, in a pre-industrial climate these temperatures would have been nearly impossible for the UK in September. It shows how climate change is moving the dial on mean temperatures. This September’s temperatures are still unlikely and needed the right combination of large-scale conditions and weather patterns, but climate change has helped to make it possible.
“As global temperatures continue to rise as a result of human greenhouse gas emissions, we expect these chances to increase over the coming decades, though the natural year-to-year variability of the UK climate will obviously continue to play a role.”
Warm and wet month
Despite the record-equalling mean temperature, it was also a wetter than average month, though not enough to trouble any records.
The UK saw almost a third more rain than average for the month, with 119.4mm of rain falling, which is 31% more than average.
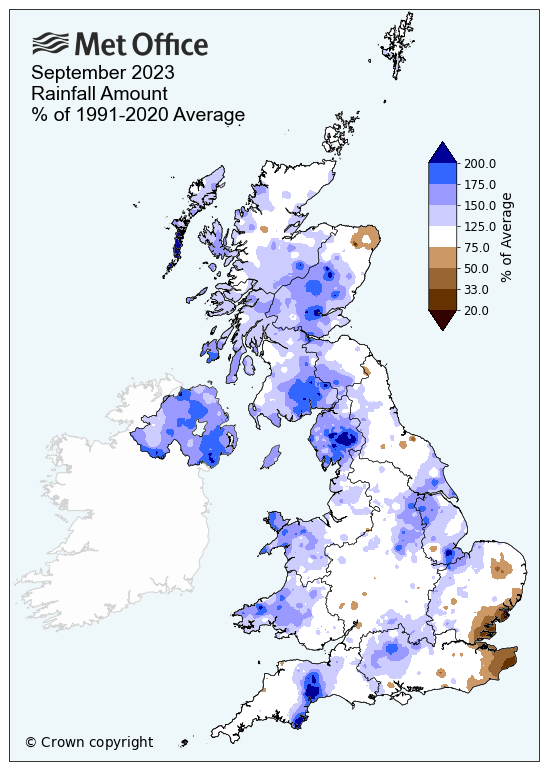
Northern Ireland saw the most significant divergence from average, with 66% more rain than average with 145.1mm of rain falling in the month.
Mark McCarthy continued: “Although September warmth will likely make the headlines, September had its fair share of wet and unsettled weather, predominantly in the second half of the month. A wet second half of the month has made it a wetter than average month, with Storm Agnes on 27 and 28 September bringing a period of more significant winds, especially in the northwest.”
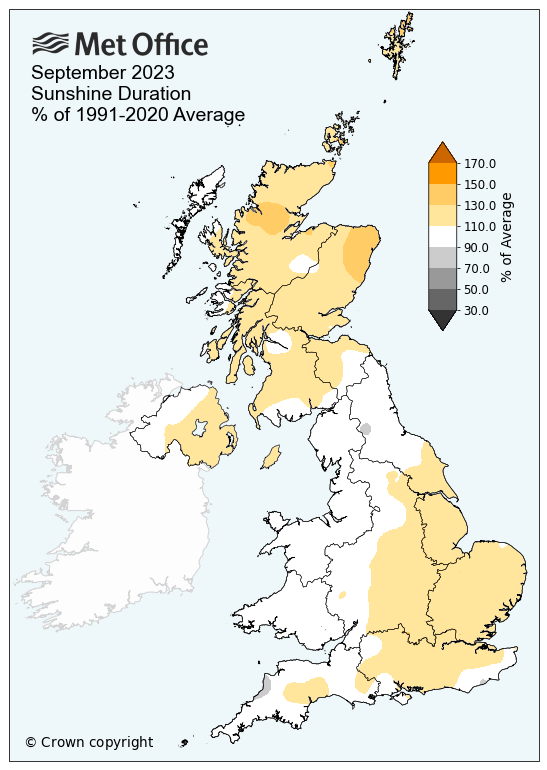
Sunshine for some
The UK was slightly sunnier than average in September, with Scotland seeing 17% more sunshine hours than average with 124.8 hours of sunshine in the month.
Provisional September 2023 statistics
| Maximum temp | Minimum temp | Mean temp | Rainfall | Sunshine | ||||||
|---|---|---|---|---|---|---|---|---|---|---|
| Area | Actual temp (°C) | Anomaly (°c) | Actual temp (°C) | Anomaly (°C) | Actual temp (°C) | Anomaly (°C) | Actual (mm) | Anomaly (%) | Actual (hours) | Anomaly (%) |
| UK | 19.4 | 2.5 | 11.0 | 1.0 | 15.2 | 2.2 | 119.4 | 131 | 142.4 | 112 |
| England | 21.2 | 3.0 | 11.1 | 2.4 | 16.7 | 2.7 | 81.7 | 119 | 156.7 | 111 |
| Wales | 19.4 | 2.6 | 11.8 | 2.5 | 15.6 | 2.5 | 155.5 | 139 | 129.2 | 100 |
| Scotland | 16.6 | 1.9 | 9.0 | 1.1 | 12.8 | 1.5 | 167.9 | 136 | 124.8 | 117 |
|
N. Ireland |
18.0 | 1.7 | 10.4 | 1.6 | 14.2 | 1.6 | 145.1 | 166 | 125.8 | 111 |