New research shows increasing frequency of extreme rain
Author: Press Office
16:00 (UTC) on Tue 7 Mar 2023
Extreme rainfall events could be four times as frequent by 2080 compared to 1980s.
For the first time, a high resolution model that captures the detail of convective, or extreme, rainfall events has provided 100 years of data, spanning the past, present and future continuously, to analyse the future risk of rainfall with the intensity that can cause flash flooding.
A version of the Met Office Unified Model, the same that is used for the operational UK weather forecast, has been run 12 times at a resolution of 2.2km (known as k-scale modelling) to give an ensemble of 100-year climate projections.
This is like starting 12 weather forecasts and running them for 100 years, except the researchers are not interested in the weather on a given day but rather how the occurrence of local weather extremes varies year-by-year. By starting the model runs in the past it is also possible to verify the output against observations to assess the model performance.
At this level of detail, it is possible to more accurately assess how convective downpours that can lead to flash flooding will change, for example when the intensity of the rain exceeds 20mm/hour. Thresholds of rainfall intensity like 20mm/hr are used for aspects of planning such as surface water drainage and flood risk.
The research, published in Nature Communications, found that under a high emissions scenario (RCP 8.5) rainfall events in the UK exceeding 20mm/hr could be four times as frequent by 2080 compared to the 1980s. Previous coarser model output (12km) predicted an increase of around two and a half times in the same period.
RCP 8.5 is a pathway where greenhouse gas emissions keep accelerating. This is not inevitable, but a plausible scenario if we do not curb our emissions.
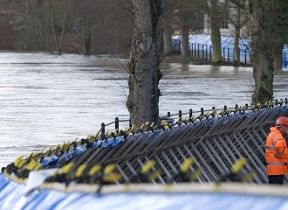
An example of an intense rainfall event with 20mm/hr is London in July 2021, when 40mm of rain fell over three hours at Kew Gardens, flooding the underground and other infrastructure.
This increase was found to differ across the UK. When looking regionally, future changes in extreme rainfall events could be almost 10 times more frequent in Northwest Scotland in 2080 compared to the 1980s, whilst in the south of the UK the value is closer to three times more frequent.
As the atmosphere warms it can hold more moisture, at a rate of 7% more moisture for every degree of warming. On a simple level, this explains why in many regions of the world projections show an increase in precipitation as a consequence of human induced climate change.
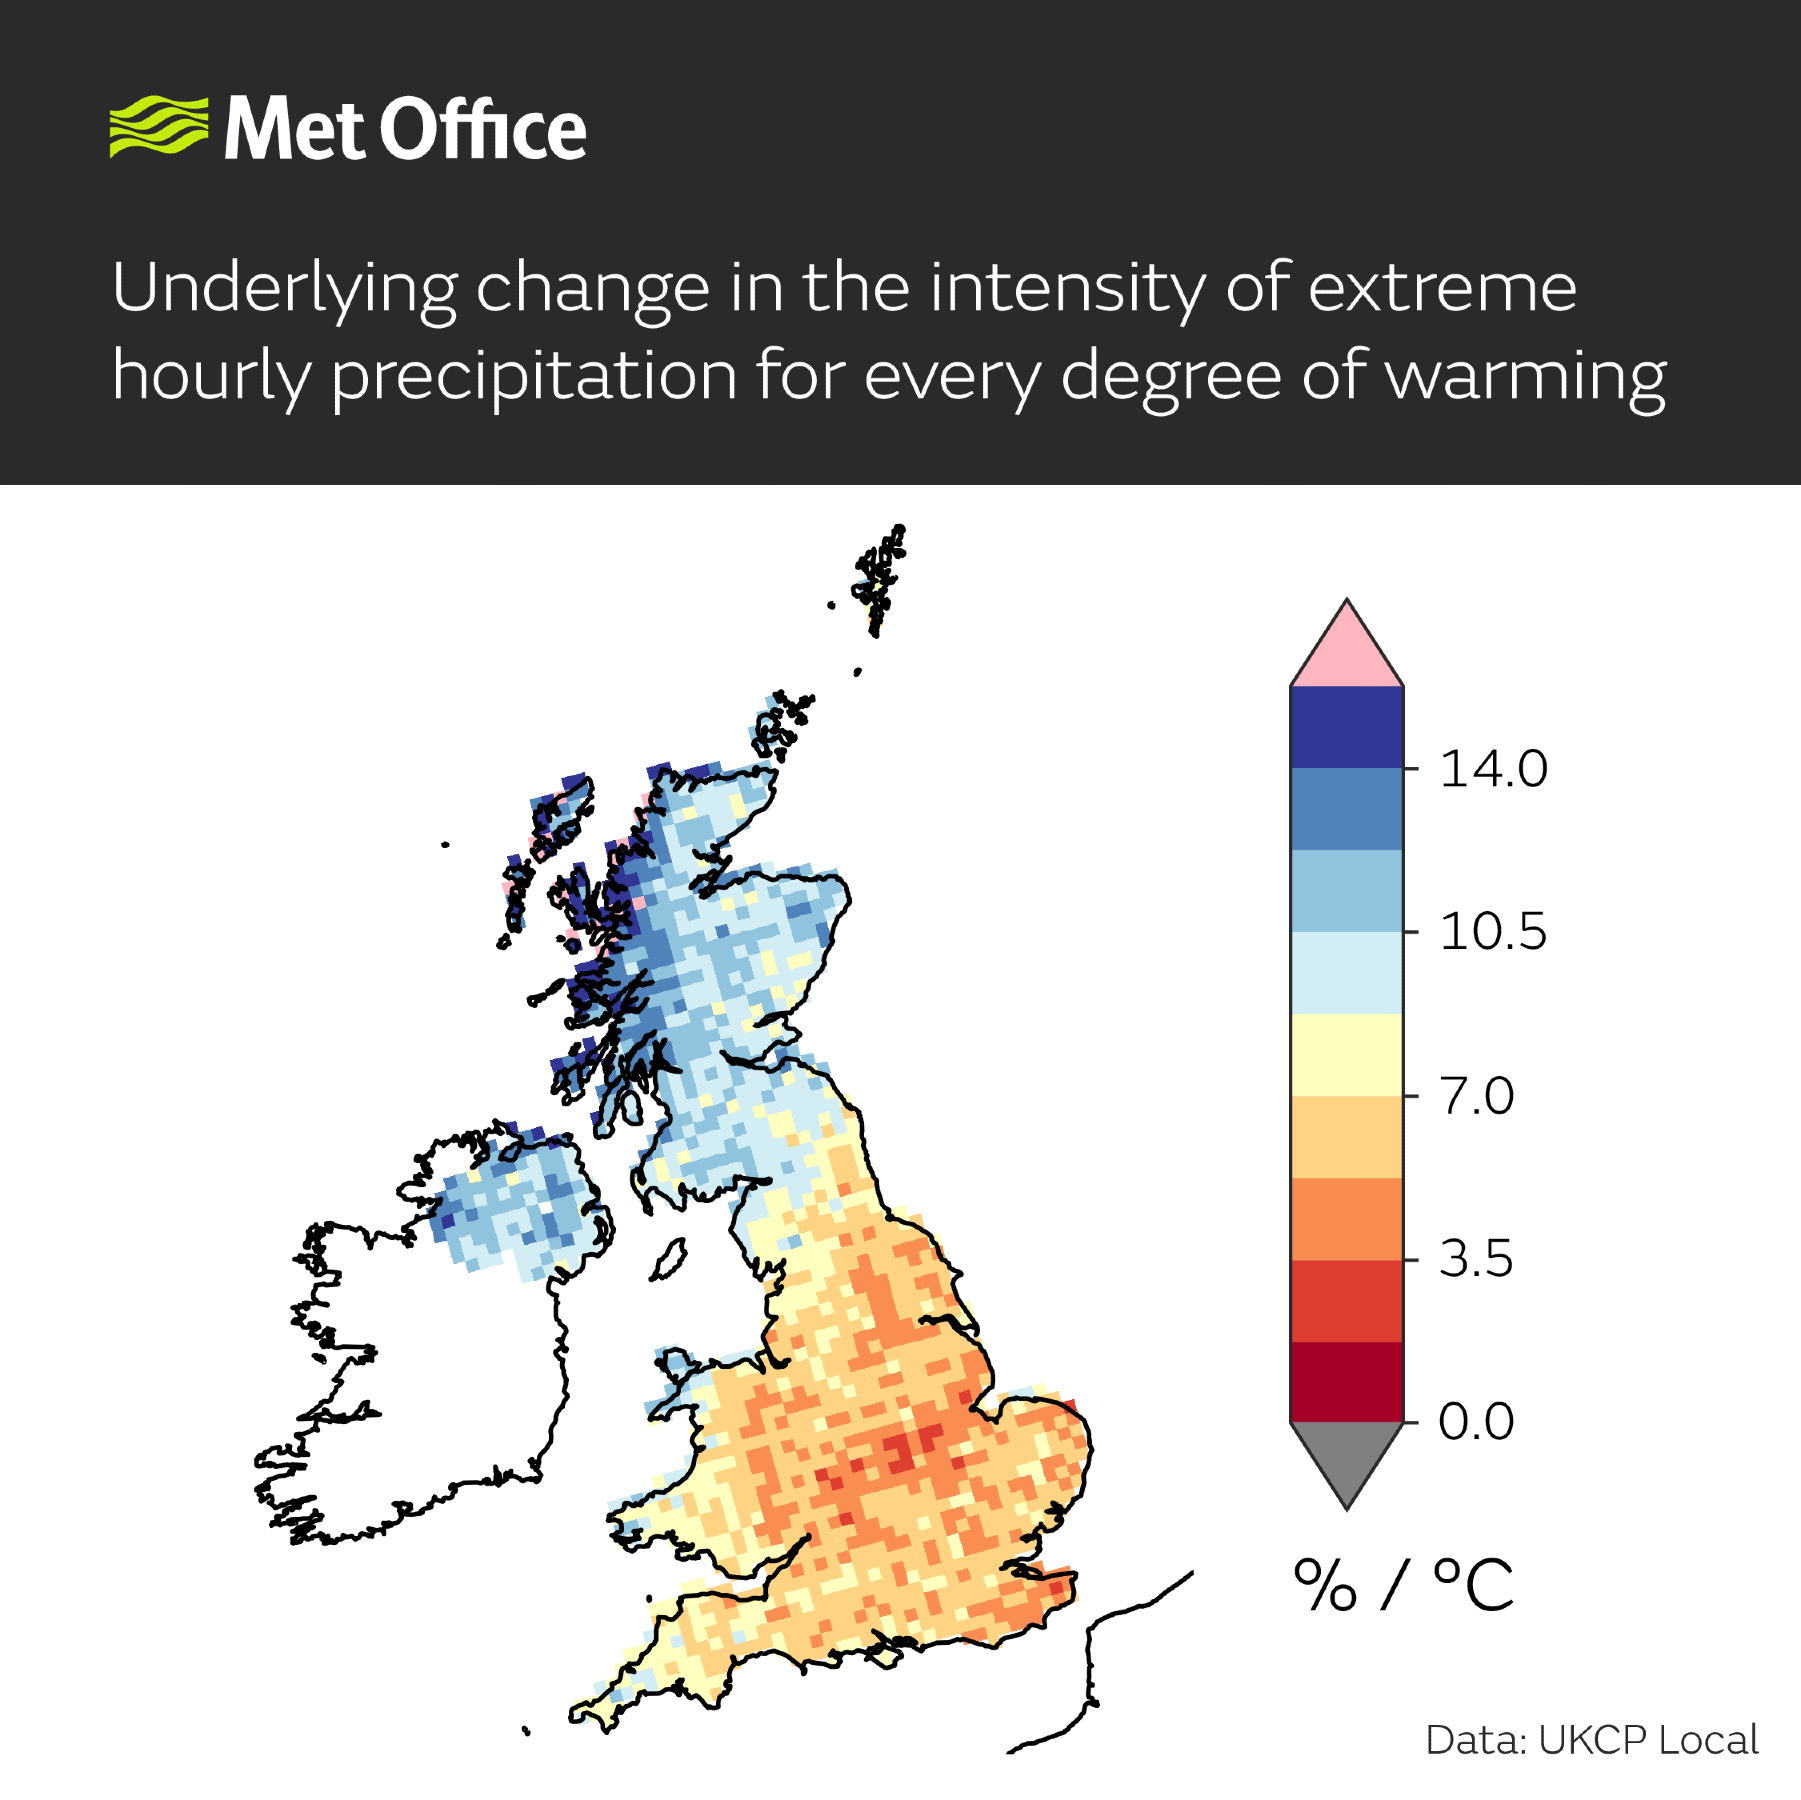
This new study has shown that during extreme rainfall events in the UK the intensity of downpours could increase by 5-15% per °C of regional warming. This change is also uneven across the UK, the map below shows the underlying change in the intensity of extreme hourly precipitation for every degree of warming. The greatest change is indicated by the blues in the Northwest of the UK, with the red and orange colours showing less change.
Lead Author of the research Met Office Climate Scientist Lizzie Kendon, Professor of Climate Science at the University of Bristol Cabot Institute for the Environment, said: “Being able to look at our projected future climate in such detail has unlocked an incredible amount of information and has shown how expected increases in intense rainfall events will actually manifest at local scale and for the coming years. Having this level of detail is crucial to ensure that we’re prepared for the possible extremes of the future.
“The greater future increases in the number of extreme rainfall events in higher compared to lower resolution models shows the importance of having k-scale projections to enable society to adapt to climate change.”
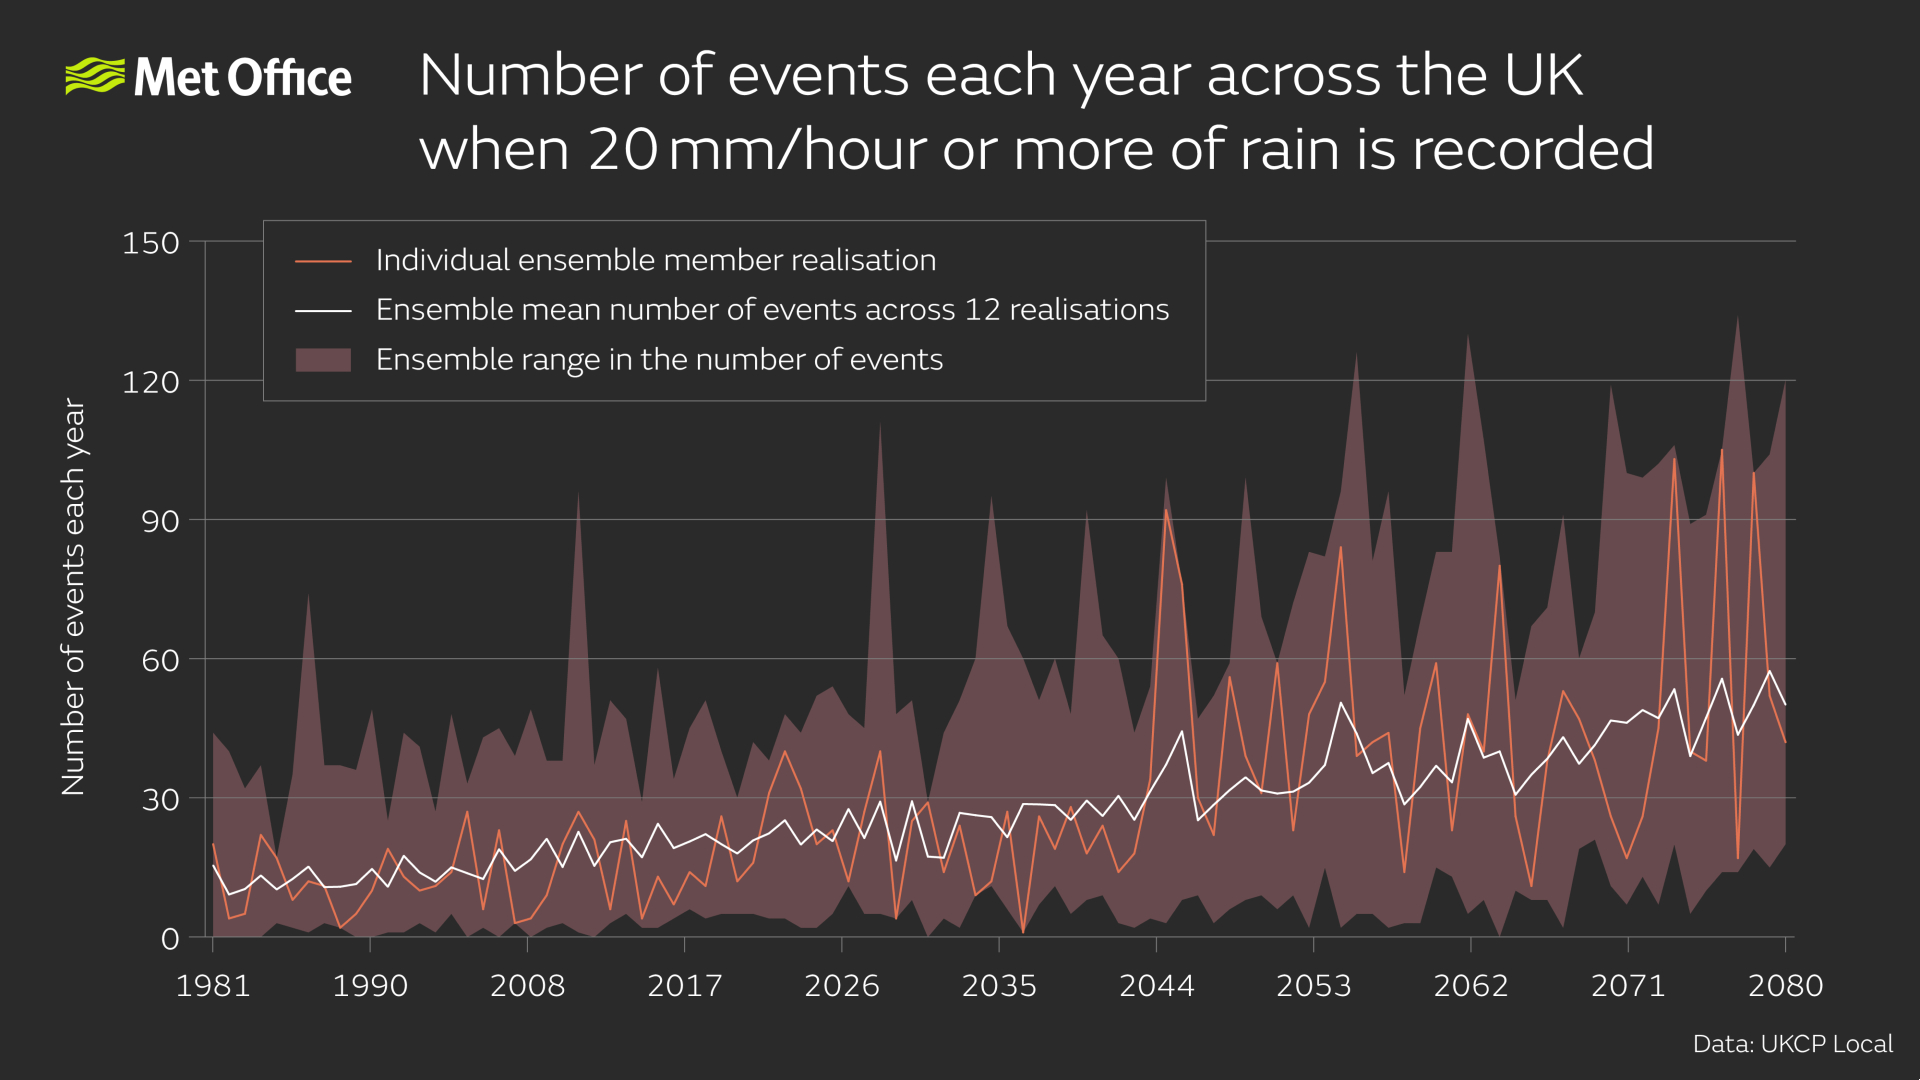
Although there is a long term increase in the number of extreme rainfall events in the UK as we go through the century, as shown by the white line in the graph above, in any individual realisation (or ensemble member, as shown by the red line) the number of events per year remains erratic much like the observational record. As our climate warms, it is notable quite how variable the number of events becomes year to year.
Professor Kendon explains: “The observed rainfall record in the UK is fairly erratic with a large amount of variability, these latest projections show that this is likely to continue through the century. What we can see from the higher resolution output is an even more erratic frequency of extreme events each year, so this could mean we see clusters of record breaking intense rainfall events, followed by a period when no records are broken. Despite the underlying trend, these pauses in the intensification of local rainfall extremes can last a surprisingly long time – even multiple decades.
“Another concern is apparent sudden transitions to a much higher frequency of extreme events illustrated by the model output. This would suggest a sudden increase in the numbers of extreme rainfall events, outside of the experience of recent decades. If this scenario did happen it could lead to impacts where infrastructure was unprepared for such a change in our weather.”
In addition to providing valuable information on the future risk of intense rainfall, the new research provides a pioneering new data set for climate attribution scientists to use to assess current rainfall events and how much more likely they will have been because of human induced climate change.
Professor Kendon added: “This is the first time that such a high resolution data set has spanned over a century. As well as being a valuable asset for planners and policy makers to prepare for the future, it can also be used by climate attribution scientists to examine current extreme rainfall events to see how much more likely they will have been because of human greenhouse gas emissions.
“Our study highlights the complexity of how natural climate variability and human-induced climate change will come together in the extreme rainfall events we experience over the UK – it is far from a simple picture of more extreme events decade by decade as a steadily increasing trend.”
The dataset will be part of an update to the Met Office UKCP Local projections expected at the end of March 2023.