
Wettest July on record for Northern Ireland
Author: Press Office
13:39 (UTC+1) on Tue 1 Aug 2023
Northern Ireland had its wettest July on record in a series which dates back to 1836, according to provisional Met Office statistics.
After a hot and dry June, July followed up with a wet and slightly cool month for many as low pressure brought frequent periods of winds and rain. Northern Ireland saw more than double its average rainfall for the month, with 185.4mm (207% of its long-term average) the provisional figure.
The previous record for Northern Ireland was very close to this figure with 185.2mm of rain in July 1936. Further rainfall data will be collected and reviewed for this July over the coming months, which could result in small amendments to the 2023 value in finalised figures, hence why they are provisional at this stage.
A rain-filled month
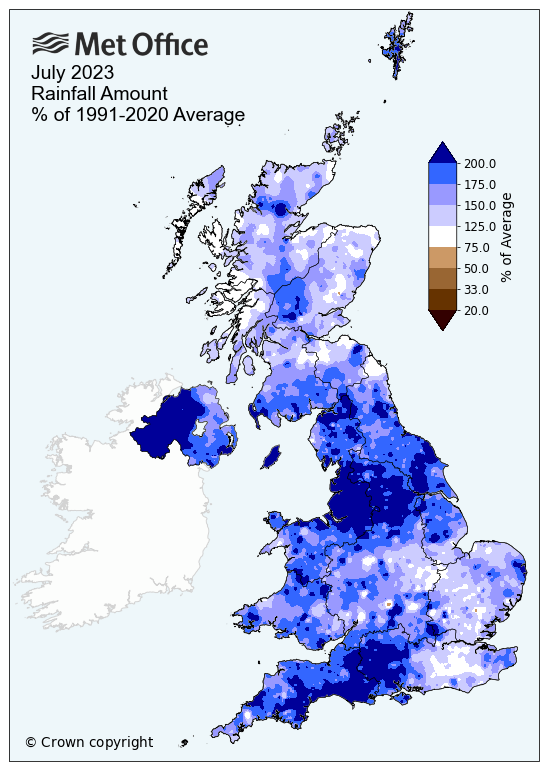
Although Northern Ireland led the way in terms of rainfall, the UK also had its sixth wettest July on record, and its wettest since 2009, with 140.1mm of rain (170% of average).
England and Wales also had significantly wetter than average months, with 120.4mm and 176.7mm of rain respectively. Scotland had 50% more rain than average, with 155.1mm.
The Met Office’s Mike Kendon, who works as part of a team that looks after the UK’s climate records, said: “It has been a significantly wet month for much of the UK; particularly for those in Northern Ireland.
“The jet stream has been shifted to the south of the UK for much of the month, simultaneously allowing extreme heat to build in southern Europe for a time, but also allowing a succession of low pressure systems to influence the UK, with long periods of winds and rain that many more typically associate with autumn weather.”
As well as Northern Ireland, parts of England also had their respective wettest July on record. Greater Manchester, Lancashire and Merseyside all had their wettest July, as a succession of weather fronts brought long periods of rain. Lancashire was the wettest county compared to average, with 234.6mm of rain falling in the month, which is 247% of its long-term average for the month.
Despite a month of above average rain, water resources generally work over a much longer term.
Sam Larsen, Director of Programmes and Planning at Water UK, said: “The recent wet and unsettled weather has helped river, reservoir and groundwater levels recover in much of the country. However, there are still areas in drought or that have experienced prolonged periods of dry weather, and climate change is changing the weather patterns that we all rely on for water.
“It is important that we all continue to do what we can to save water to protect the environment and help safeguard against drought. Our Water’s Worth Saving campaign has a host of hints and tips on how to save water, money and energy. For more information visit www.watersworthsaving.org.uk.”
Lack of sunshine
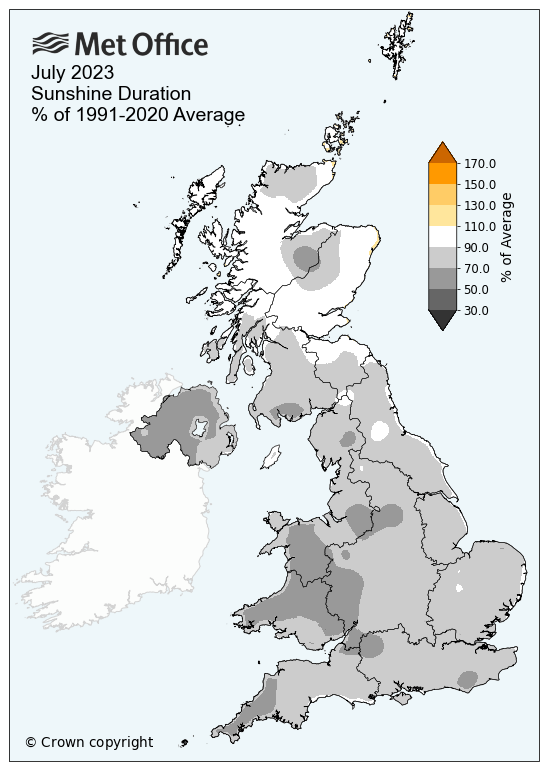
Somewhat unsurprisingly, sunshine was also in short supply in July 2023, though not enough to trouble any records in a series back to 1910. The UK had 19% fewer hours of sunshine than average, with 140.3 hours.
Scotland saw the most of its average sunshine, with 128.1 hours being 91% of its average. Wales and Northern Ireland had the dullest month compared to average with 123.2 hours (70% of average) and 94.9 hours (70% of average) respectively.
How cool has July been?
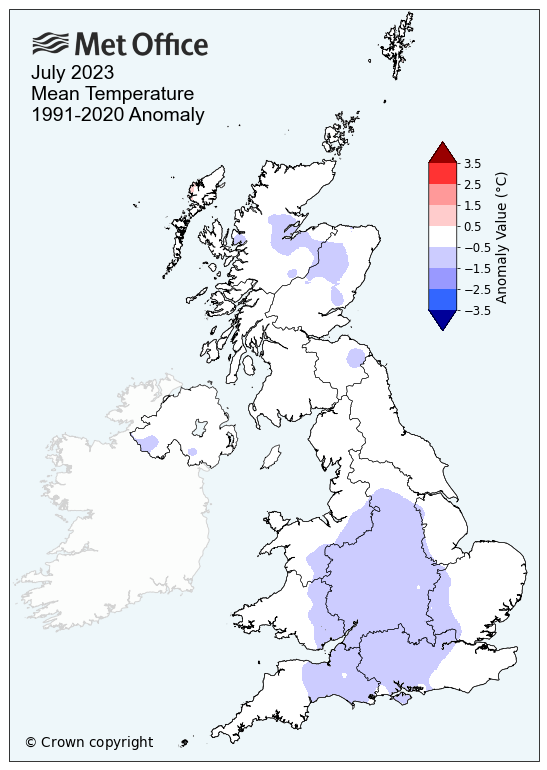
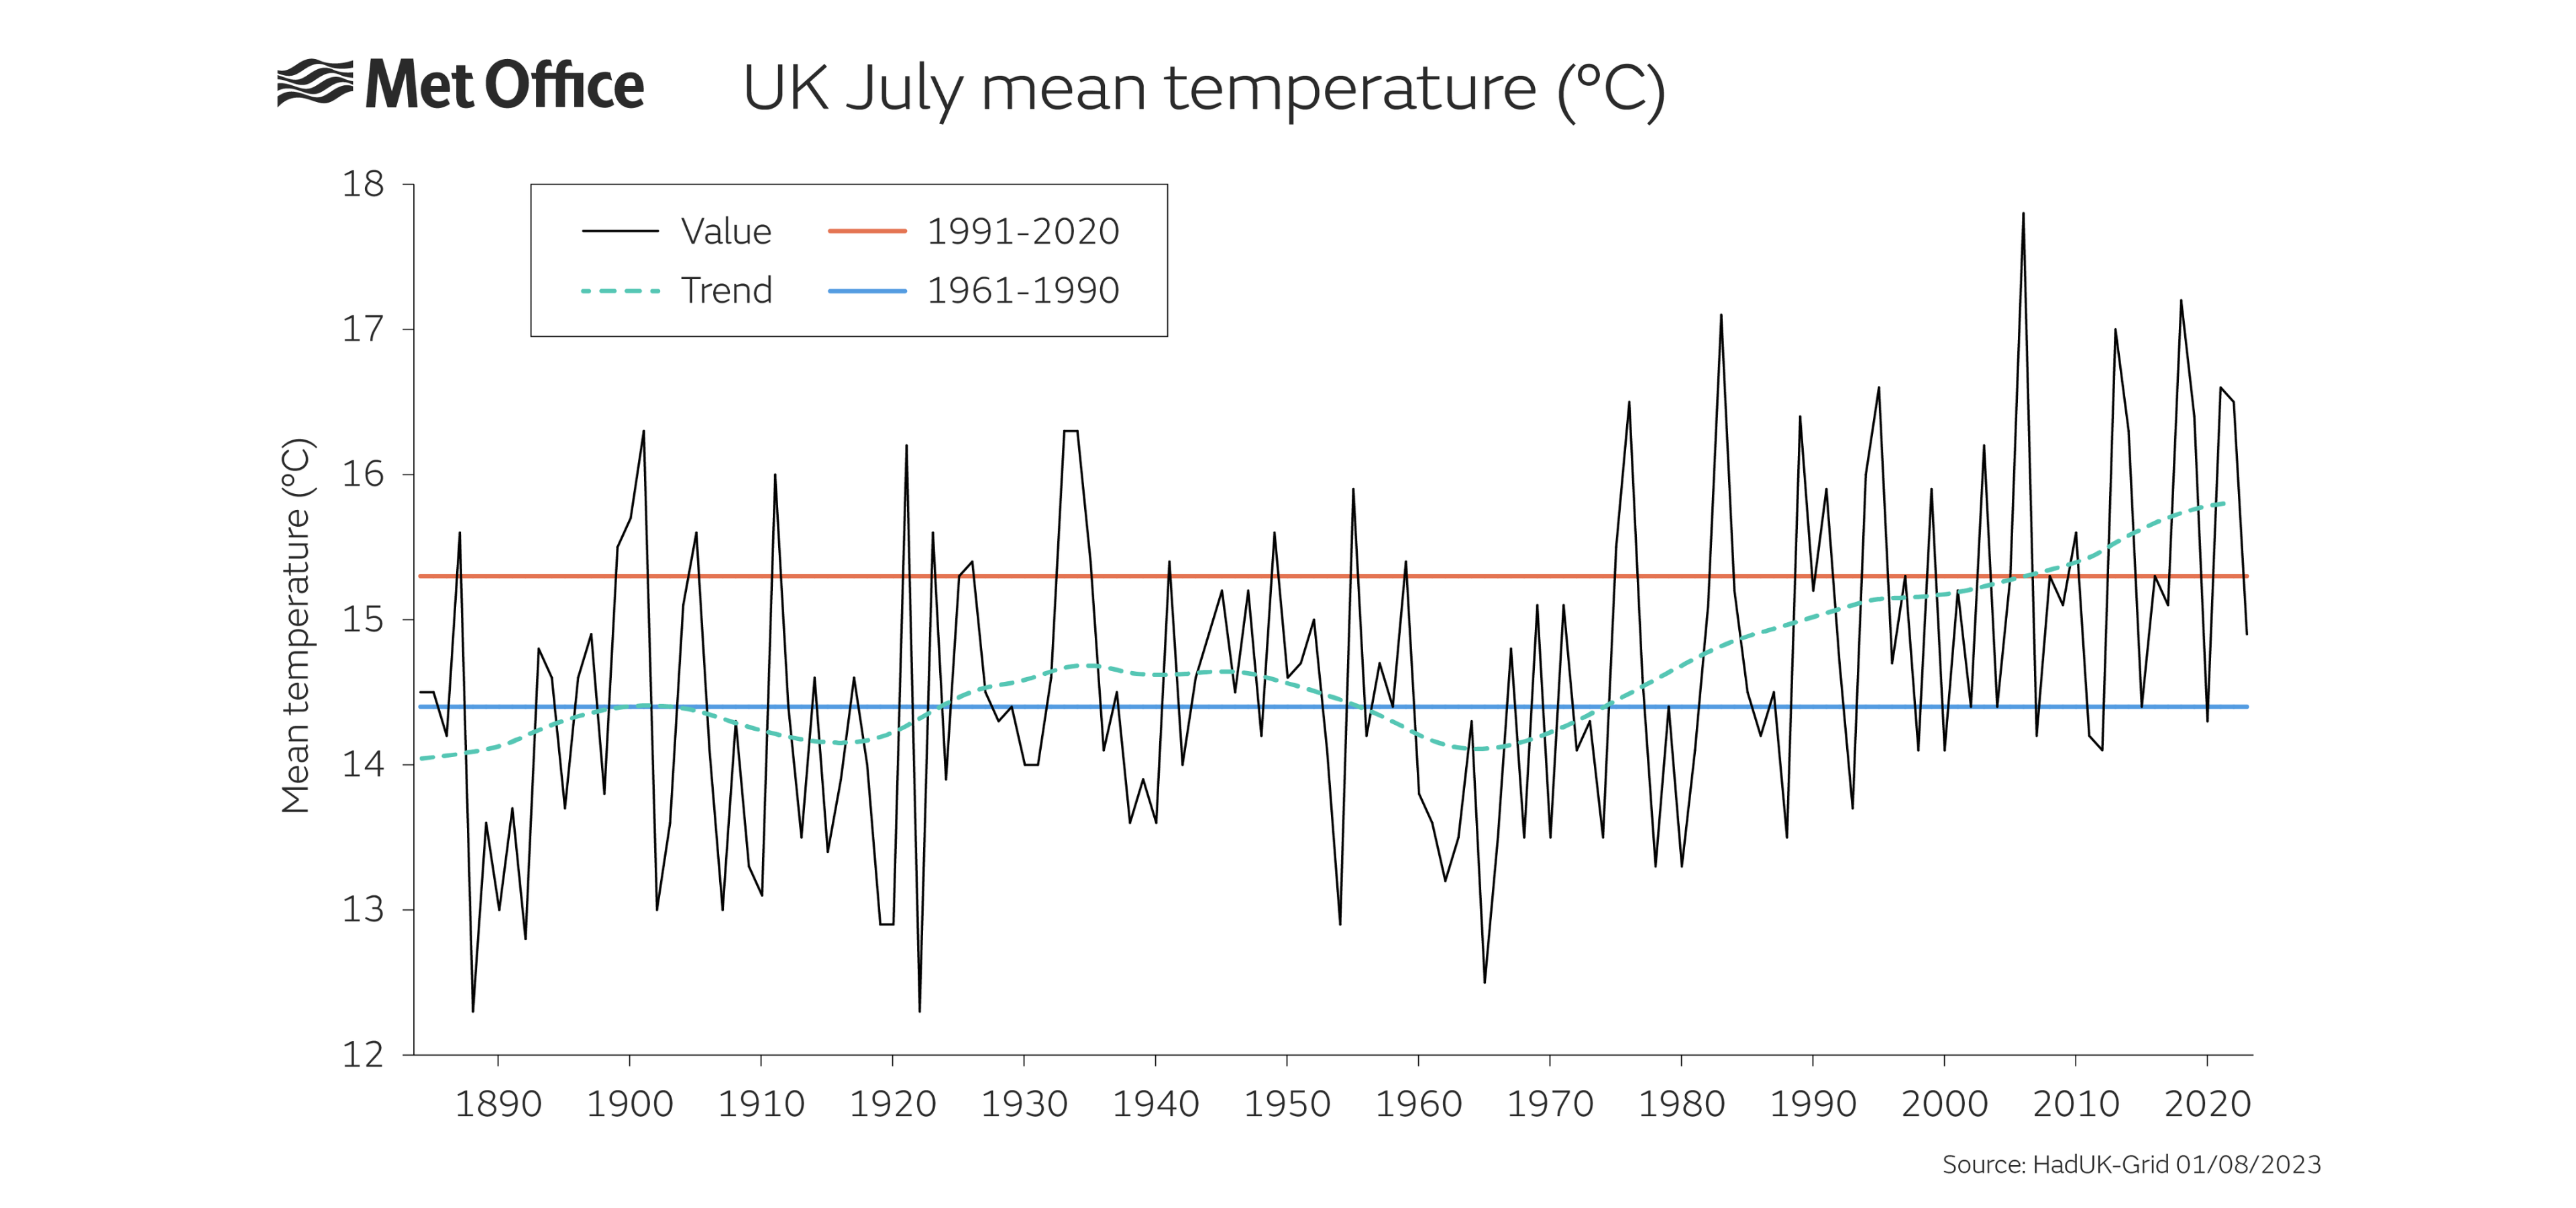
July has been slightly cooler than average, with a mean temperature of 14.9C. This is 0.3C cooler than the current 30-year meteorological averaging period (1991-2020).
Some online debate has suggested a cooler than average month dismisses the influence of climate change, though this is fundamentally not the case, as the UK’s variable climate will continue to have some cooler-than-average months.
Mike Kendon added: “Although July 2023 is considered to be a cooler-than-average July by current standards, for an early climate baseline of 1961-1990, if would have been considered a warmer-than-average July. This a tangible example of how we see the climate changing in our long-term data set.”
A windy month
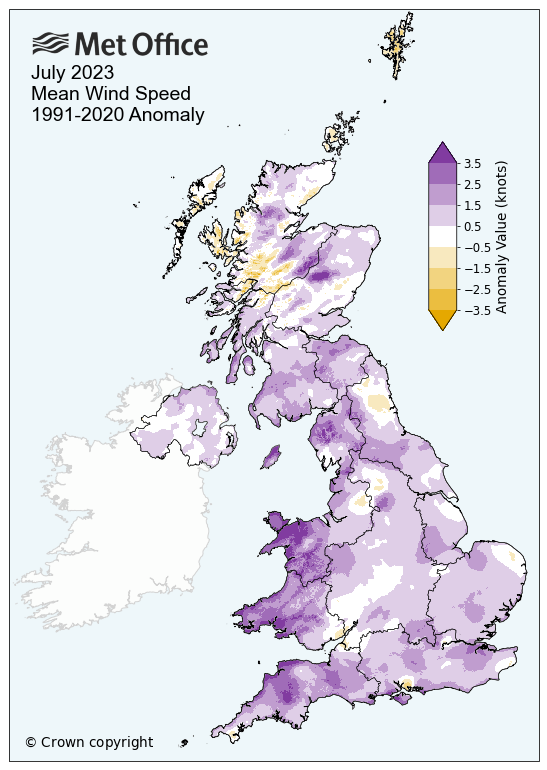
Accompanied with the frequent rain was some unseasonably gusty winds for the UK. A gust of 79mph was recorded on 15 July at the exposed site of Needles on the Isle of Wight. Gusts in excess of 55mph have also been recorded this month in Devon, Gwynedd and Northumberland as low-pressure systems exerted their influence to create unusually strong winds for the time of year.
RNLI Water Safety Partner, Sam Hughes, said: “We always encourage the public to check the weather forecast and tide times before visiting the coast. The strong winds like those we’ve experienced this past month can pose a safety risk, especially along exposed cliffs, seafronts and piers so we ask that people exercise caution if visiting the shoreline.”
“If you see someone else in danger in the water, call 999 and ask for the Coastguard. If you have something that floats that they can hold on to, throw it to them. Don’t go in the water yourself – you may end up in difficulty too.”
Provisional July 2023 statistics
| Maximum temp | Minimum temp | Mean temp | Rainfall | Sunshine | ||||||
|---|---|---|---|---|---|---|---|---|---|---|
| Area | Actual temp (°C) | Anomaly (°c) | Actual temp (°C) | Anomaly (°C) | Actual temp (°C) | Anomaly (°C) | Actual (mm) | Anomaly (%) | Actual (hours) | Anomaly (%) |
| UK | 18.8 | -0.8 | 11.1 | 0.1 | 14.9 | -0.3 | 140.1 | 170 | 140.3 | 81 |
| England | 20.2 | -1.0 | 11.9 | 0.1 | 16.1 | -0.4 | 120.4 | 181 | 155.0 | 79 |
| Wales | 18.3 | -1.0 | 11.7 | 0.4 | 14.9 | -0.3 | 176.7 | 179 | 123.2 | 70 |
| Scotland | 16.9 | -0.4 | 9.6 | -0.1 | 13.2 | -0.3 | 155.1 | 150 | 128.1 | 91 |
|
N. Ireland |
17.9 | -0.7 | 10.9 | 0.1 | 14.4 | -0.3 | 185.4 | 207 | 94.9 | 70 |
Summer so far
Thanks in part to the record-breaking June warmth, meteorological summer so far is still warmer than average for the UK, despite a lacklustre July. Rainfall amounts are slightly ahead of where they would typically be at this point in the season, though there’s still plenty of time for the figures to change during August.