

Warmest February on record for England and Wales
Author: Press Office
12:39 (UTC) on Fri 1 Mar 2024
England and Wales had their respective warmest Februarys on record according to provisional Met Office statistics in what was a mild and wet month for many.
The average temperature in England for February 2024 was 7.5°C, topping the previous record of 7.0°C set in 1990. Wales saw an average mean temperature at 6.9°C for the month, marginally ahead of 1998’s record of 6.8°C.
The UK experienced its second warmest February, averaging 6.3°C, but not surpassing February 1998’s figure of 6.8°C. The UK’s 10 warmest Februarys on record in a series from 1884 now include 2024, 2023, 2022 and 2019.
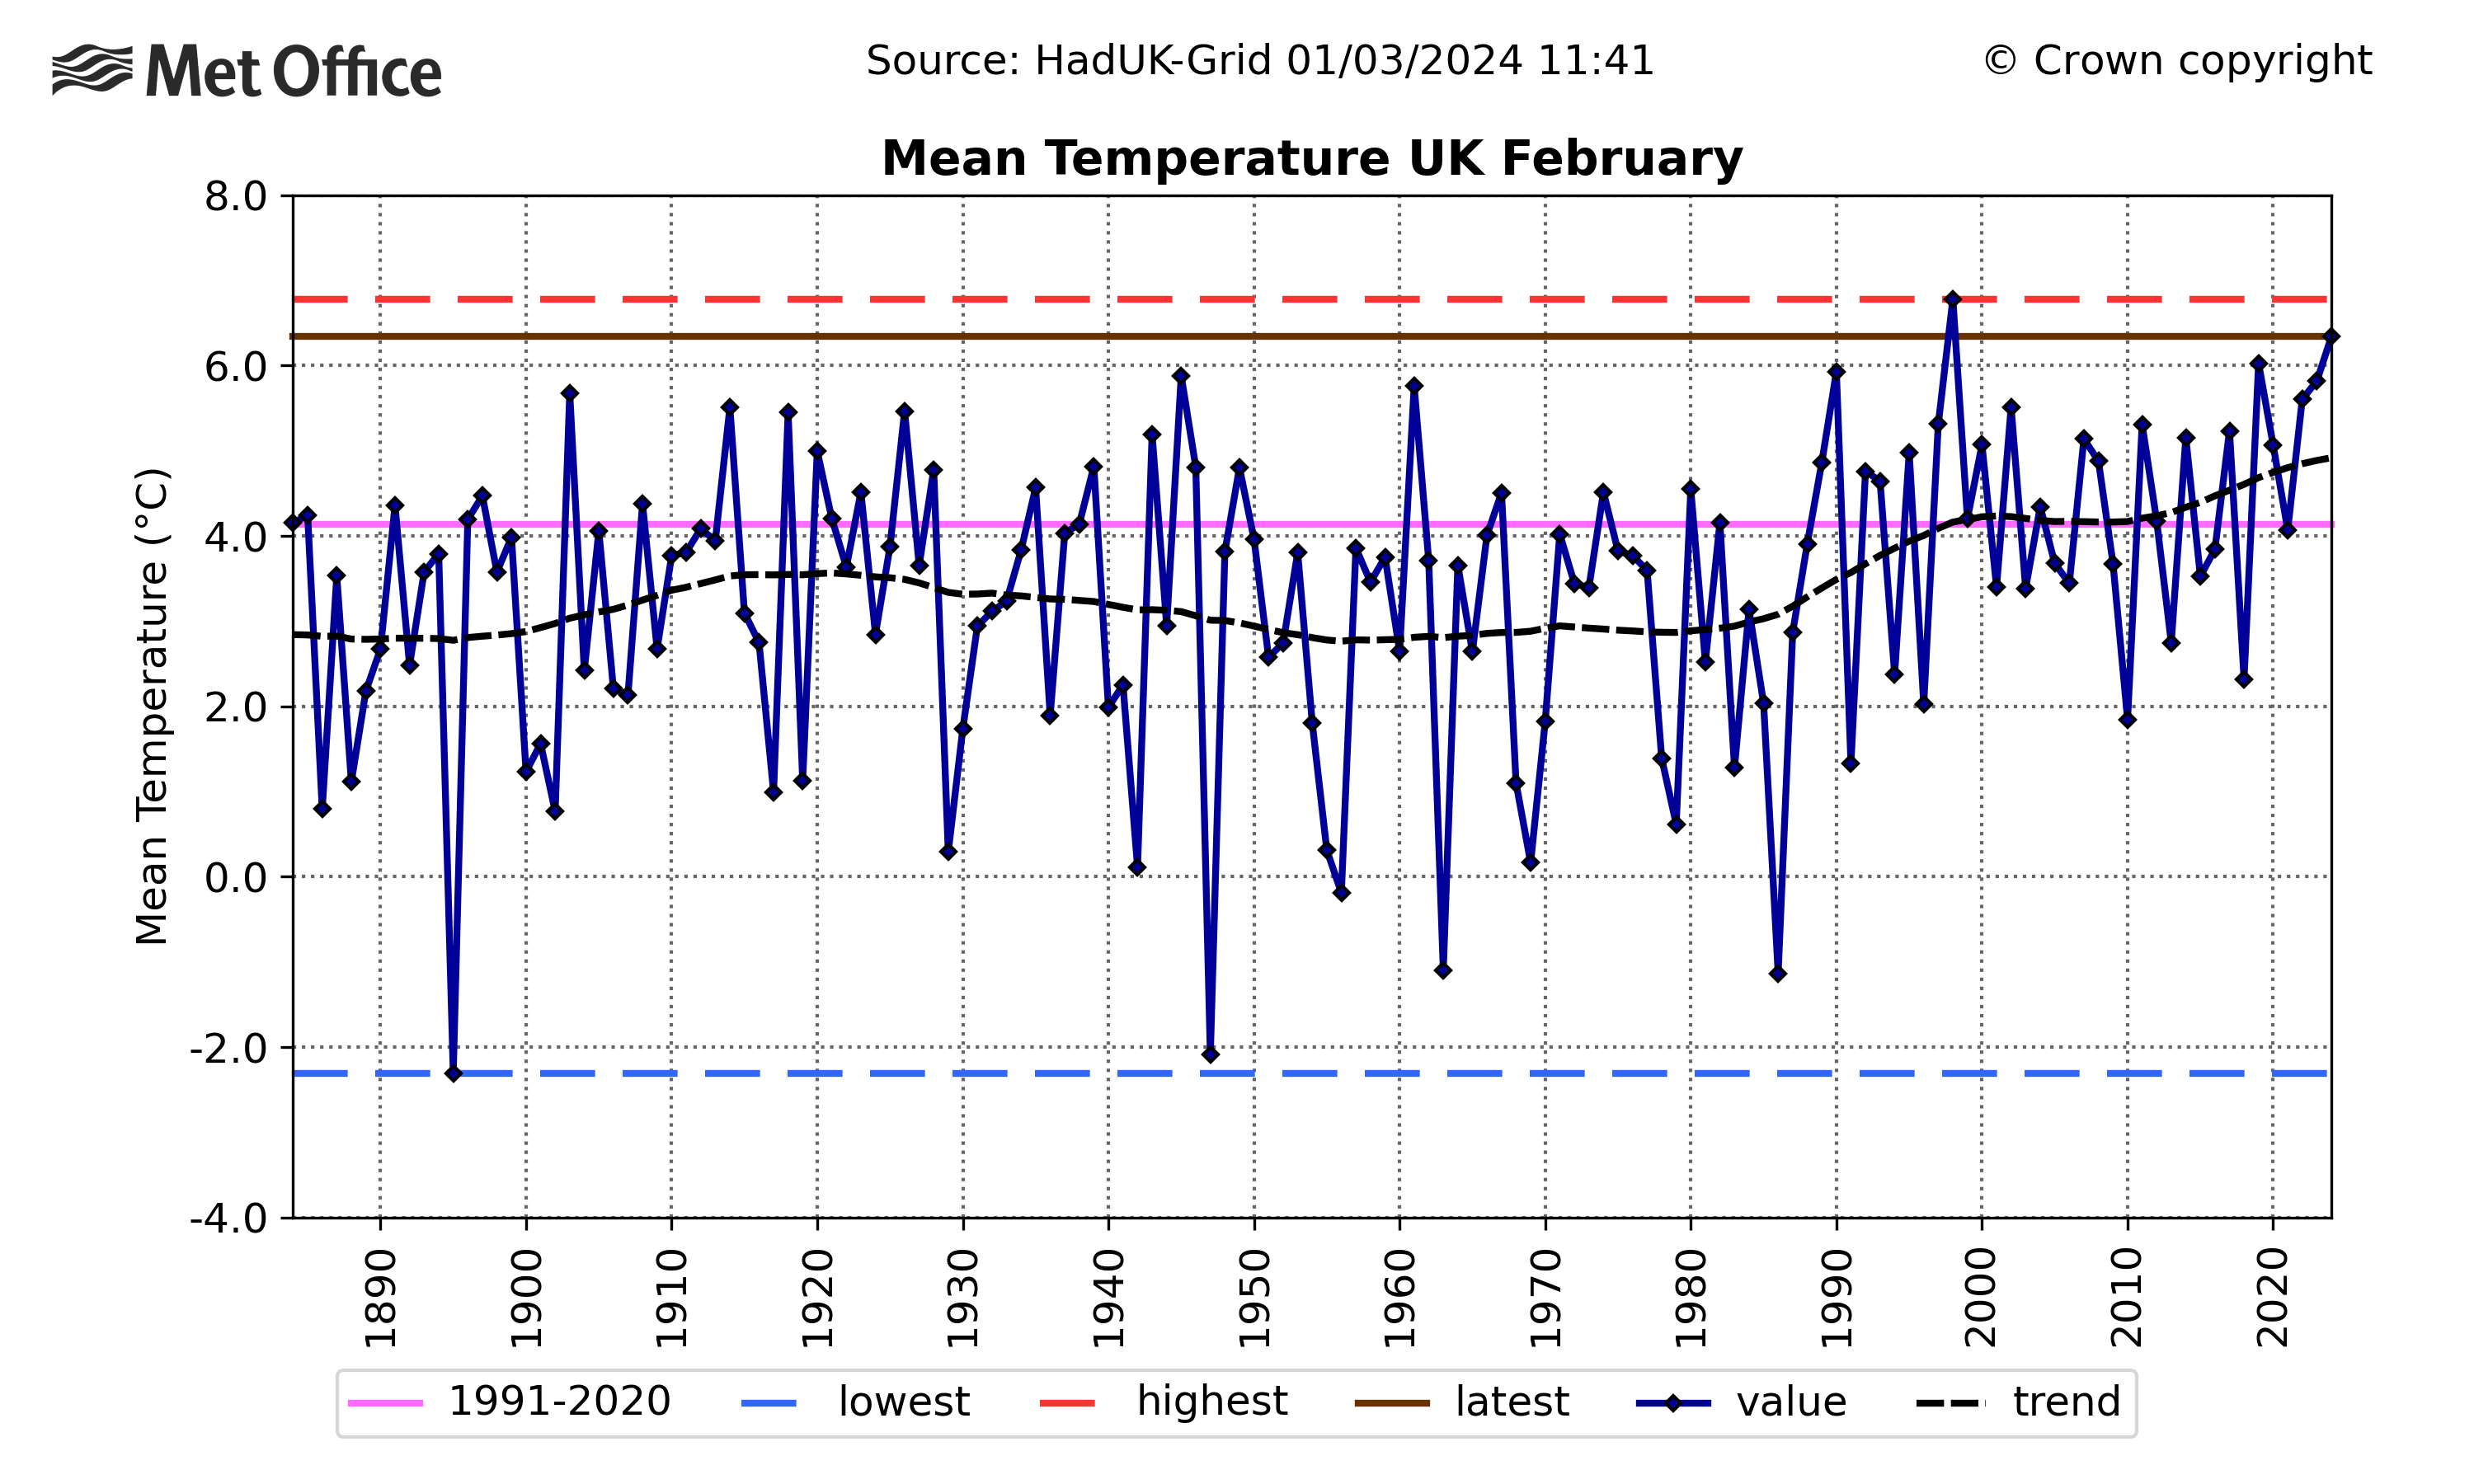
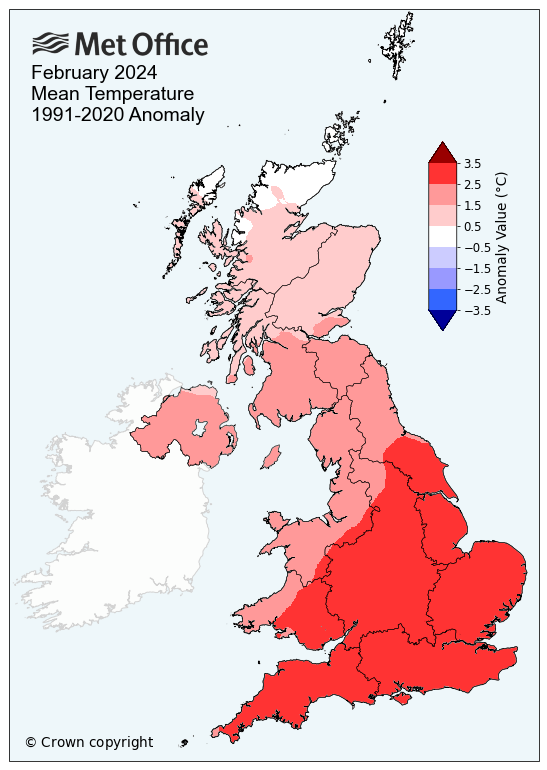
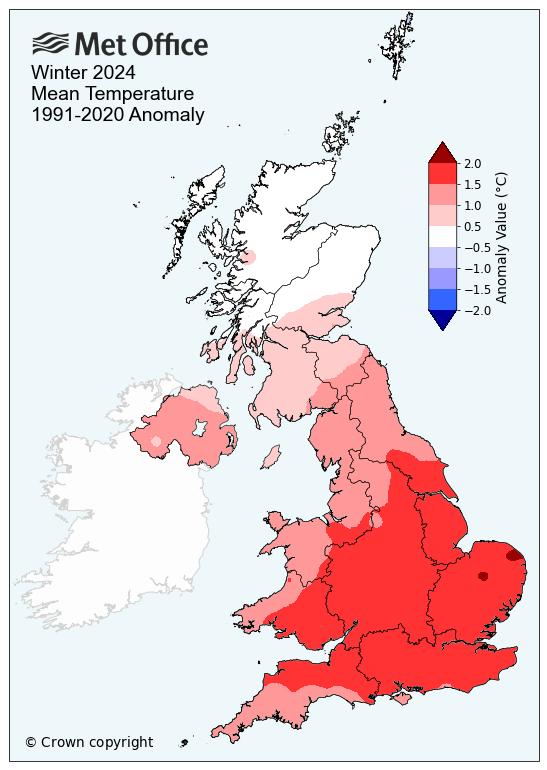
While temperatures were above average throughout the UK, it was a particularly warm month across the southern half of the country, with mean temperatures more than 3°C above the February long-term average for many counties in southern England. Over 30 counties recorded their highest February mean temperature, chiefly in southern areas of the UK, though many areas further north were also warmer than average.
Met Office Senior Scientist Mike Kendon said: “February has perhaps been the quietest month of the winter, without any further named storms, whereas Gerrit in December and Henk and Isha in January all caused significant weather impacts.
“Despite a cold spell in the north in the first half of the month, the main theme of February is how persistently mild and wet it has been, particularly in the south and this is largely due to the influence of Atlantic low-pressure systems bringing a predominant mild, south-westerly flow. This mild, wet theme is also true of winter overall.”
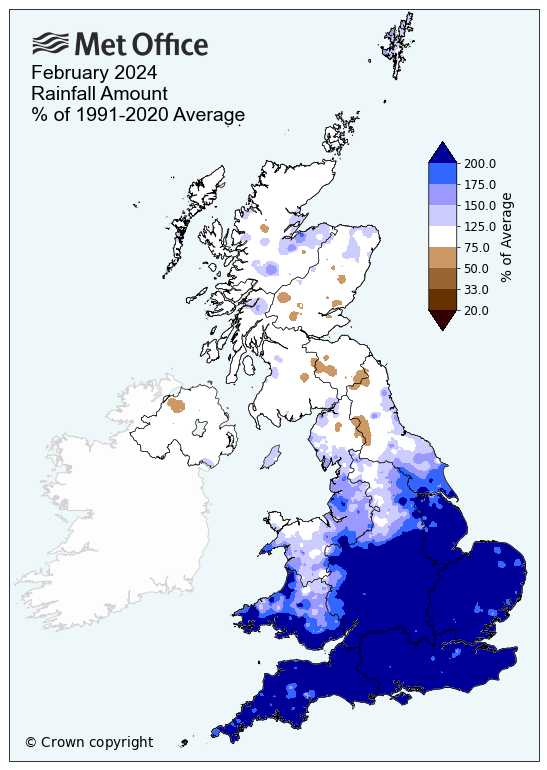
How wet has February been?
It was also a wetter than average month, with the south of England experiencing its wettest February since the series began in 1836. Many parts of southern England recorded well over twice the average rainfall.
Remarkably, East Anglia has had both its warmest and wettest February on record. It saw 106.4mm of rainfall across the month and had a mean temperature of 8.2C. England recorded its fourth wettest February on record although February 2020 was much wetter.
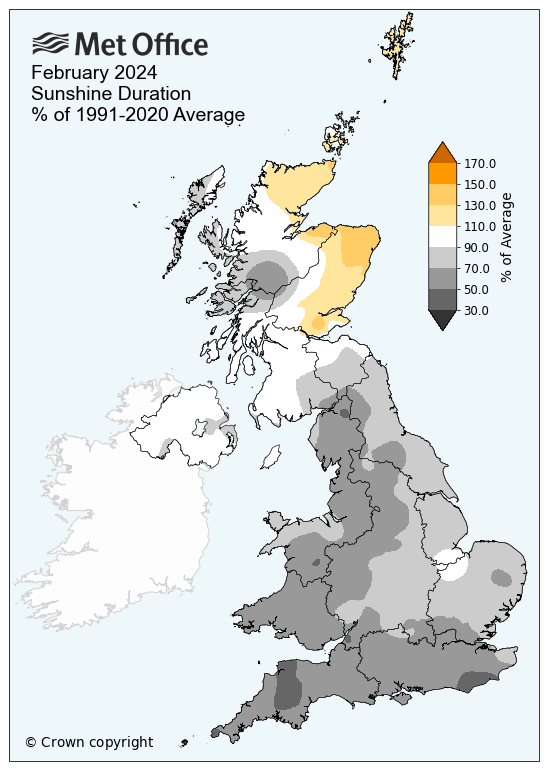
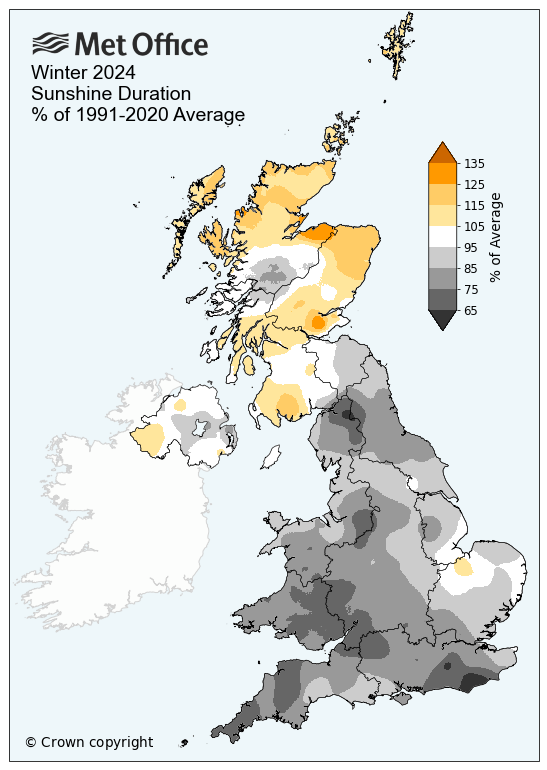
It was also a duller than average month for much of the UK, with Wales and parts of the south of England particularly dull, though not record-breaking.
|
Provisional February 2024 stats |
Max temp (°C) |
Min temp (°C) |
Mean temp (°C) |
Rainfall (mm/%) |
Sunshine (hours/ %) |
|||||
|
Actual |
91/20 anom |
Actual |
91/20 anom |
Actual |
91/20 anom |
Actual |
91/20 anom |
Actual |
91/20 anom |
|
|
UK |
9.2 |
2.1 |
3.5 |
2.3 |
6.3 |
2.2 |
139.8 |
145 |
56.7 |
79 |
|
England |
10.5 |
2.7 |
4.5 |
3.0 |
7.5 |
2.9 |
129.5 |
196 |
53.1 |
68 |
|
Wales |
9.4 |
2.1 |
4.4 |
2.8 |
6.9 |
2.4 |
205.8 |
171 |
44.2 |
64 |
|
Scotland |
7.0 |
1.1 |
1.4 |
1.1 |
4.2 |
1.1 |
149.2 |
106 |
64.7 |
102 |
|
Northern Ireland |
9.5 |
1.6 |
3.4 |
1.8 |
6.4 |
1.7 |
84.5 |
92 |
64.1 |
96 |
Winter 2024
Meteorological winter 2023/24 follows this warm and wet pattern. It’s been milder than average overall, but with some cold spells with wintry hazards, most notably in early December and mid-January. This contrasts with the often mild, wet and stormy weather through much of the season.
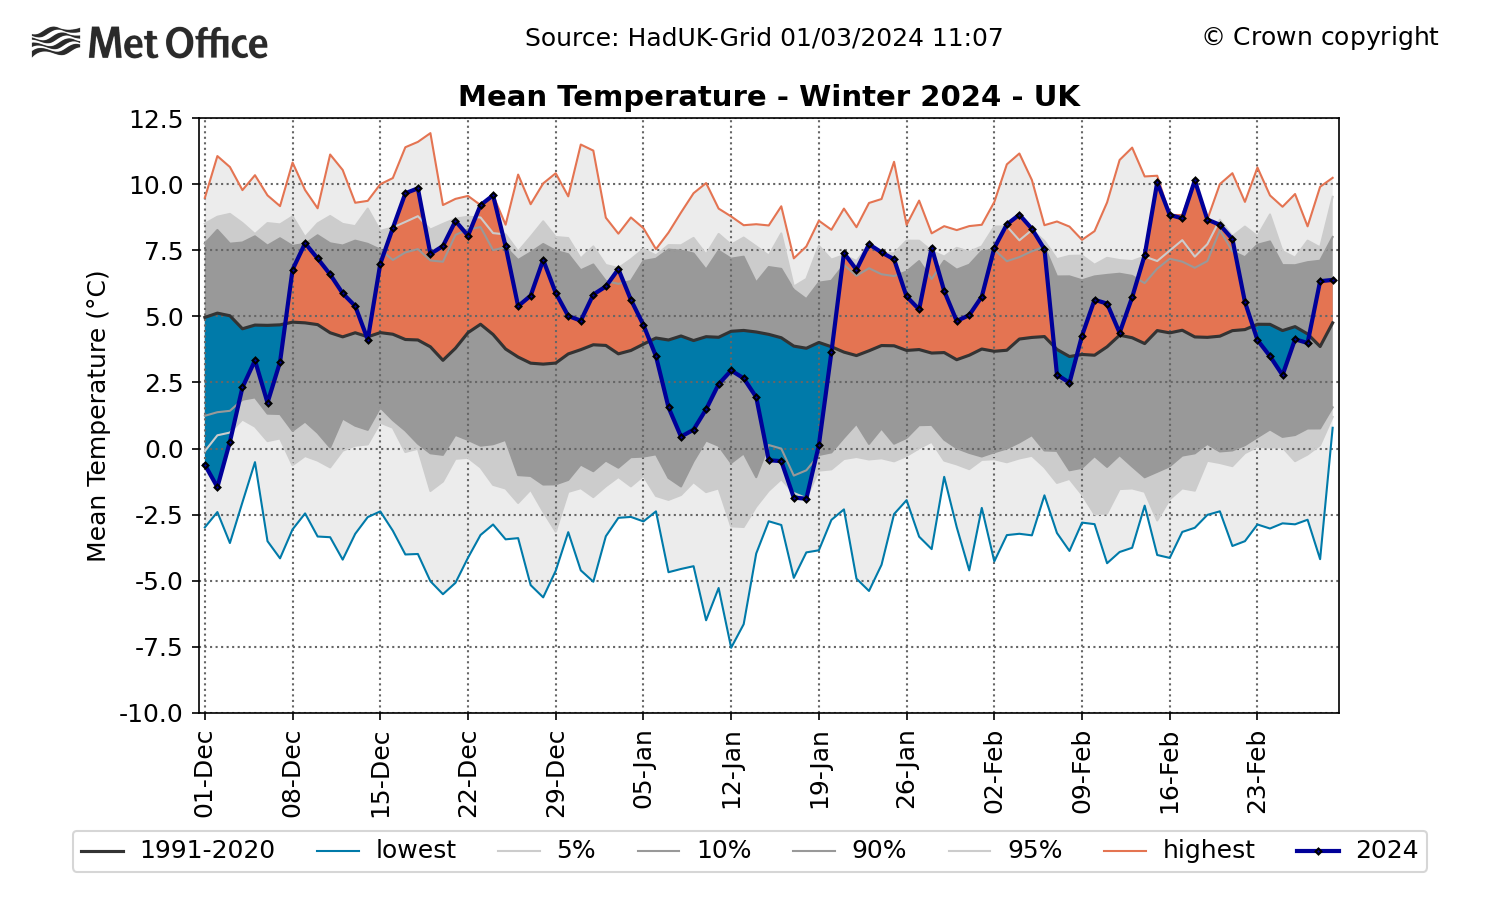
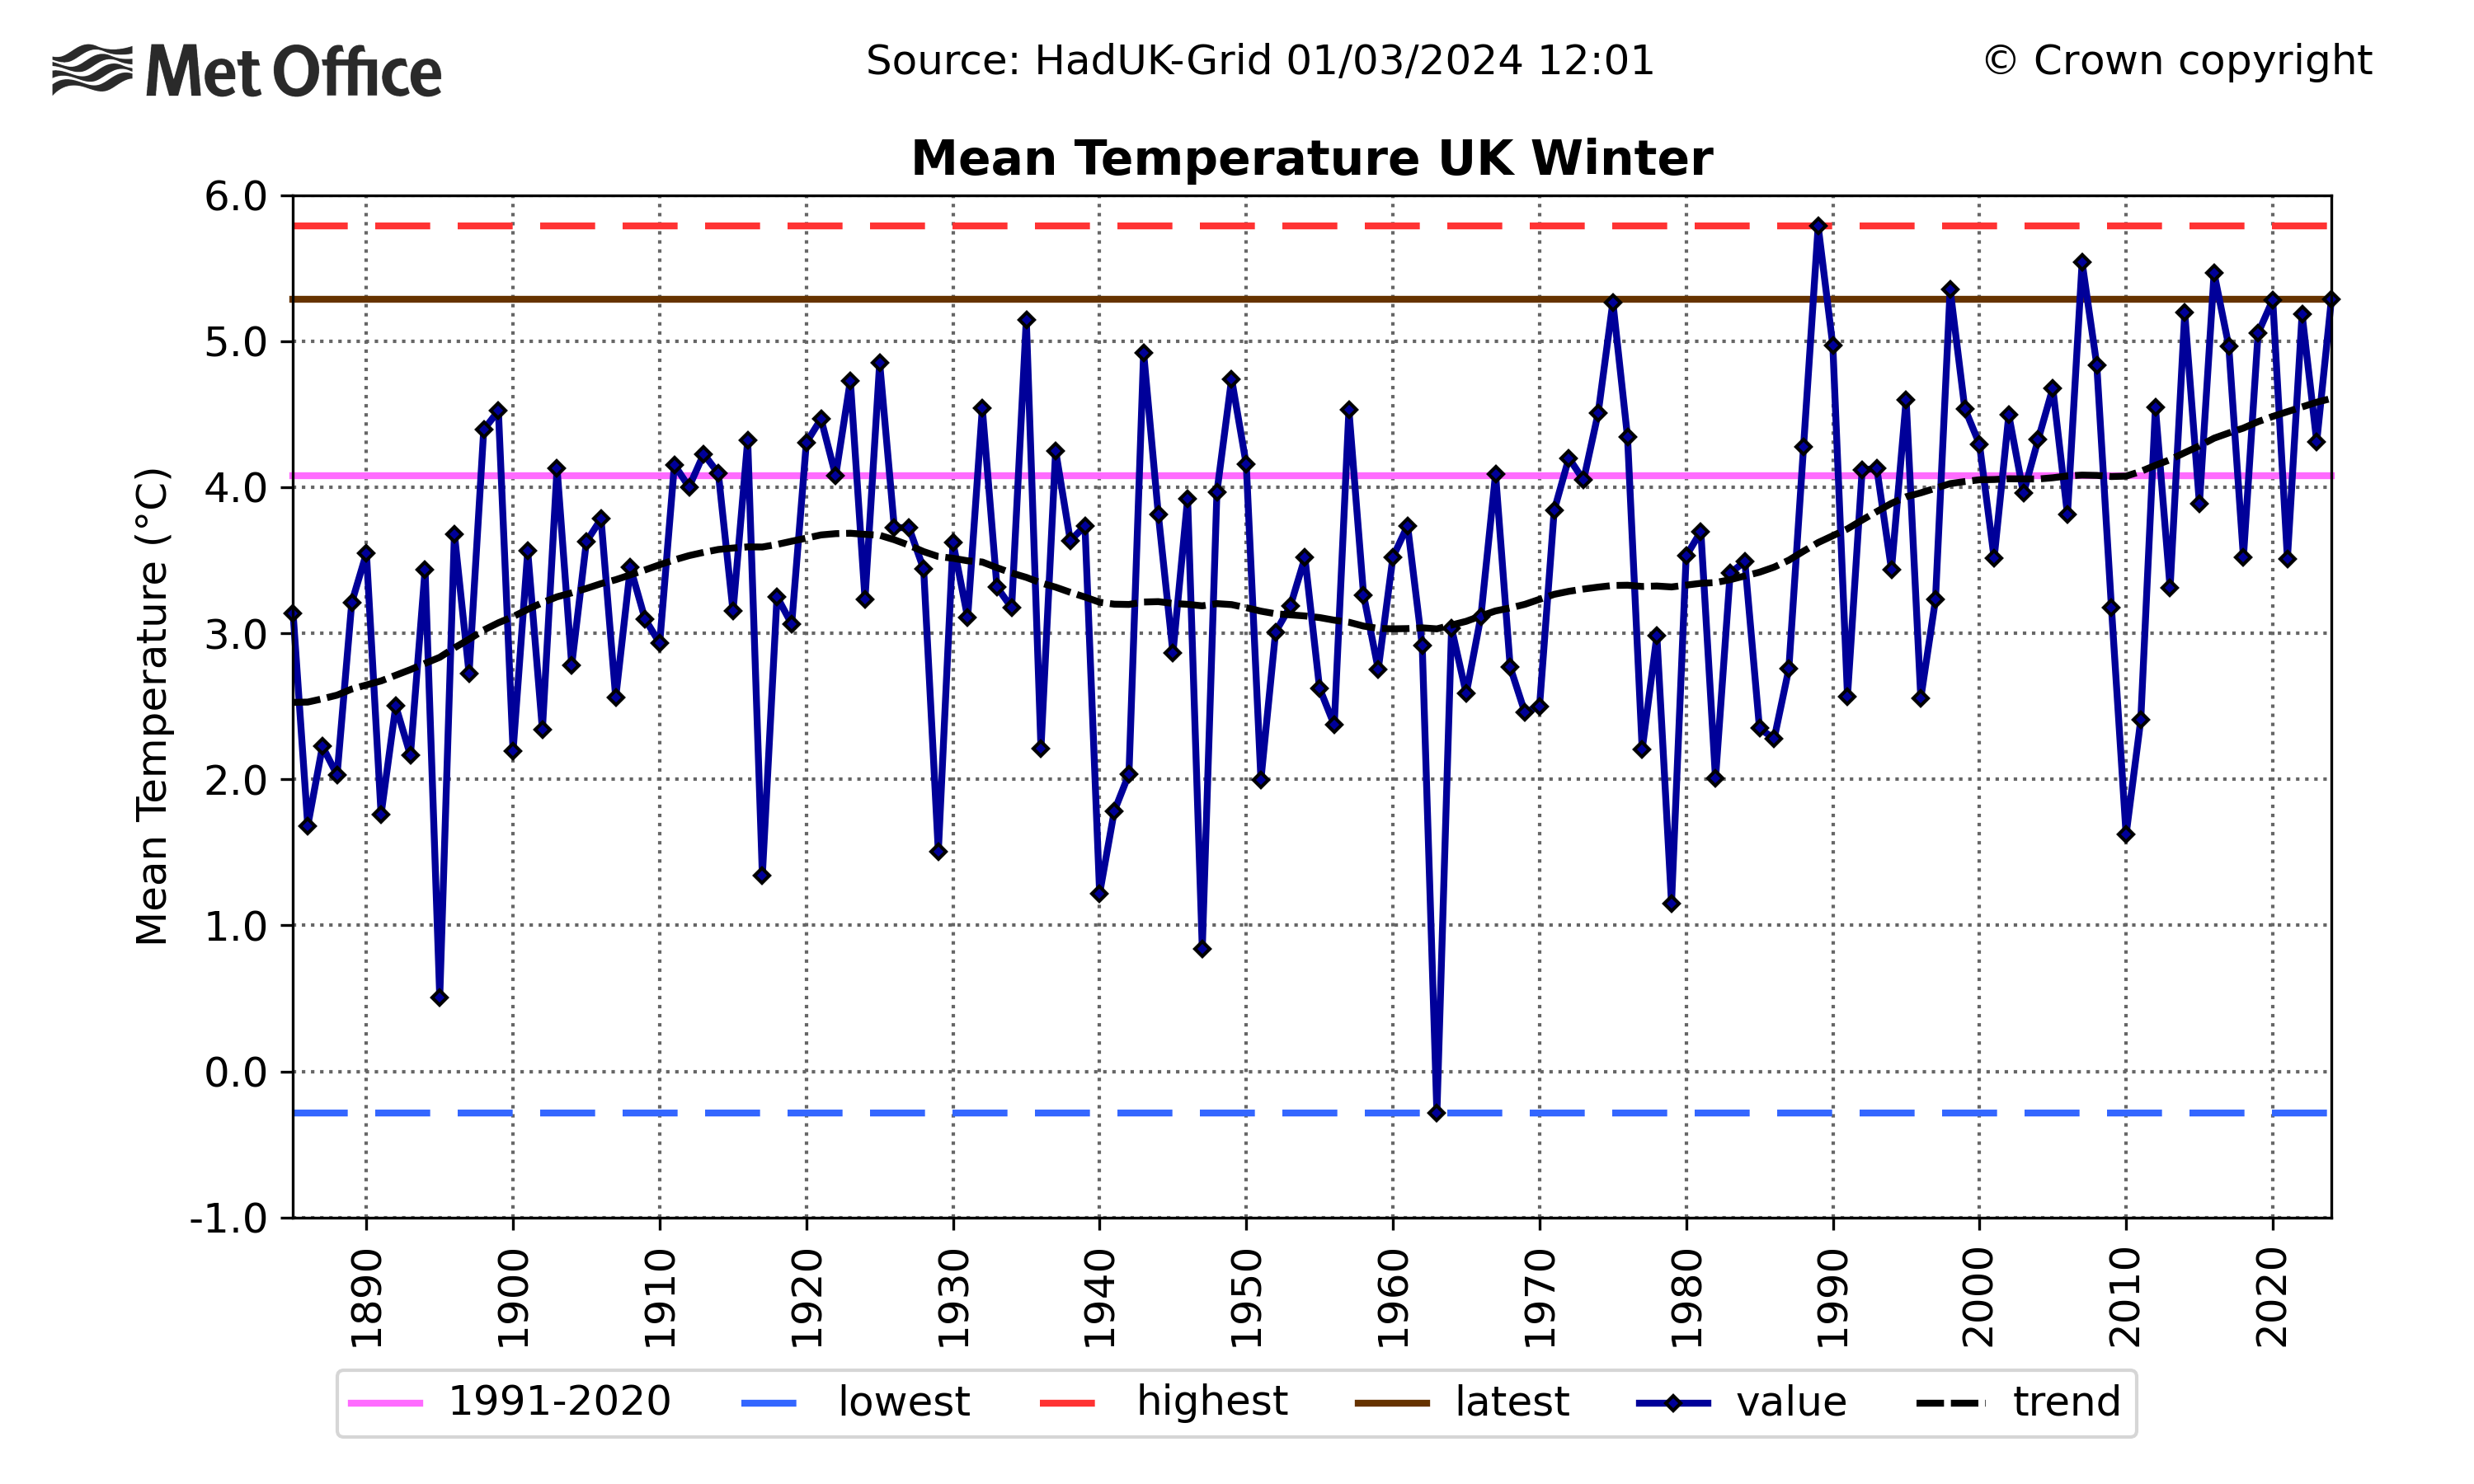
This winter is in the top 10 warmest and top 10 wettest for the UK. The UK recorded a mean average temperature of 5.29°C across the three months, making it provisionally the fifth warmest winter on record.
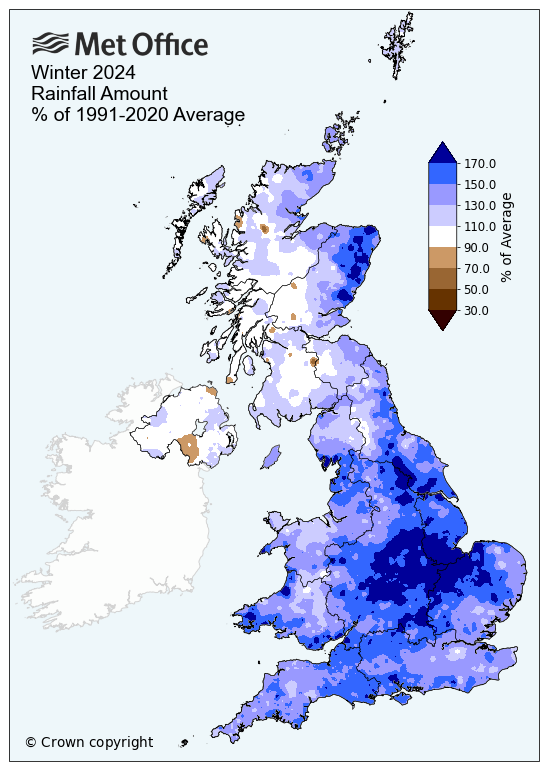
445.8mm of rainfall fell within the season, 29% more than the long-term average and the eighth wettest winter on record. The wettest areas have been across central and eastern England and Scotland, receiving more than one and a half the average rainfall amount very widely.
The Met Office’s Mike Kendon continued: “The UK’s observations clearly show winters are getting warmer, and they are also getting wetter since as the atmosphere heats up, it has an increased capacity to hold moisture. The top-ten warmest winters on record for the UK include 2024, 2022, 2020, 2016 and 2014 and the top-ten wettest 2024, 2020, 2016 and 2014 – so very mild winters also show a tendency to be very wet.”
In January, the UK saw another record broken, with the highest daily maximum temperature of 19.9°C recorded on the 28th at Achfary in Scotland. This means that since 2011, the UK has recorded its highest daily maximum temperature record for six of the 12 months of the year (January (2024), February (2019), July (2022), October (2011), November (2015), December (2019).
It was however, a slightly duller than average winter, with the UK experiencing just 145.6 hours of sunshine; 90% of the long-term average.
Five named storms
Winter 2023/4 saw five named storms – Elin, Fergus, Gerritt, Henk, Isha, Jocelyn. Storm Jocelyn was the 10th named storm and only the second time in a UK storm season that the letter J has been reached in the alphabet.
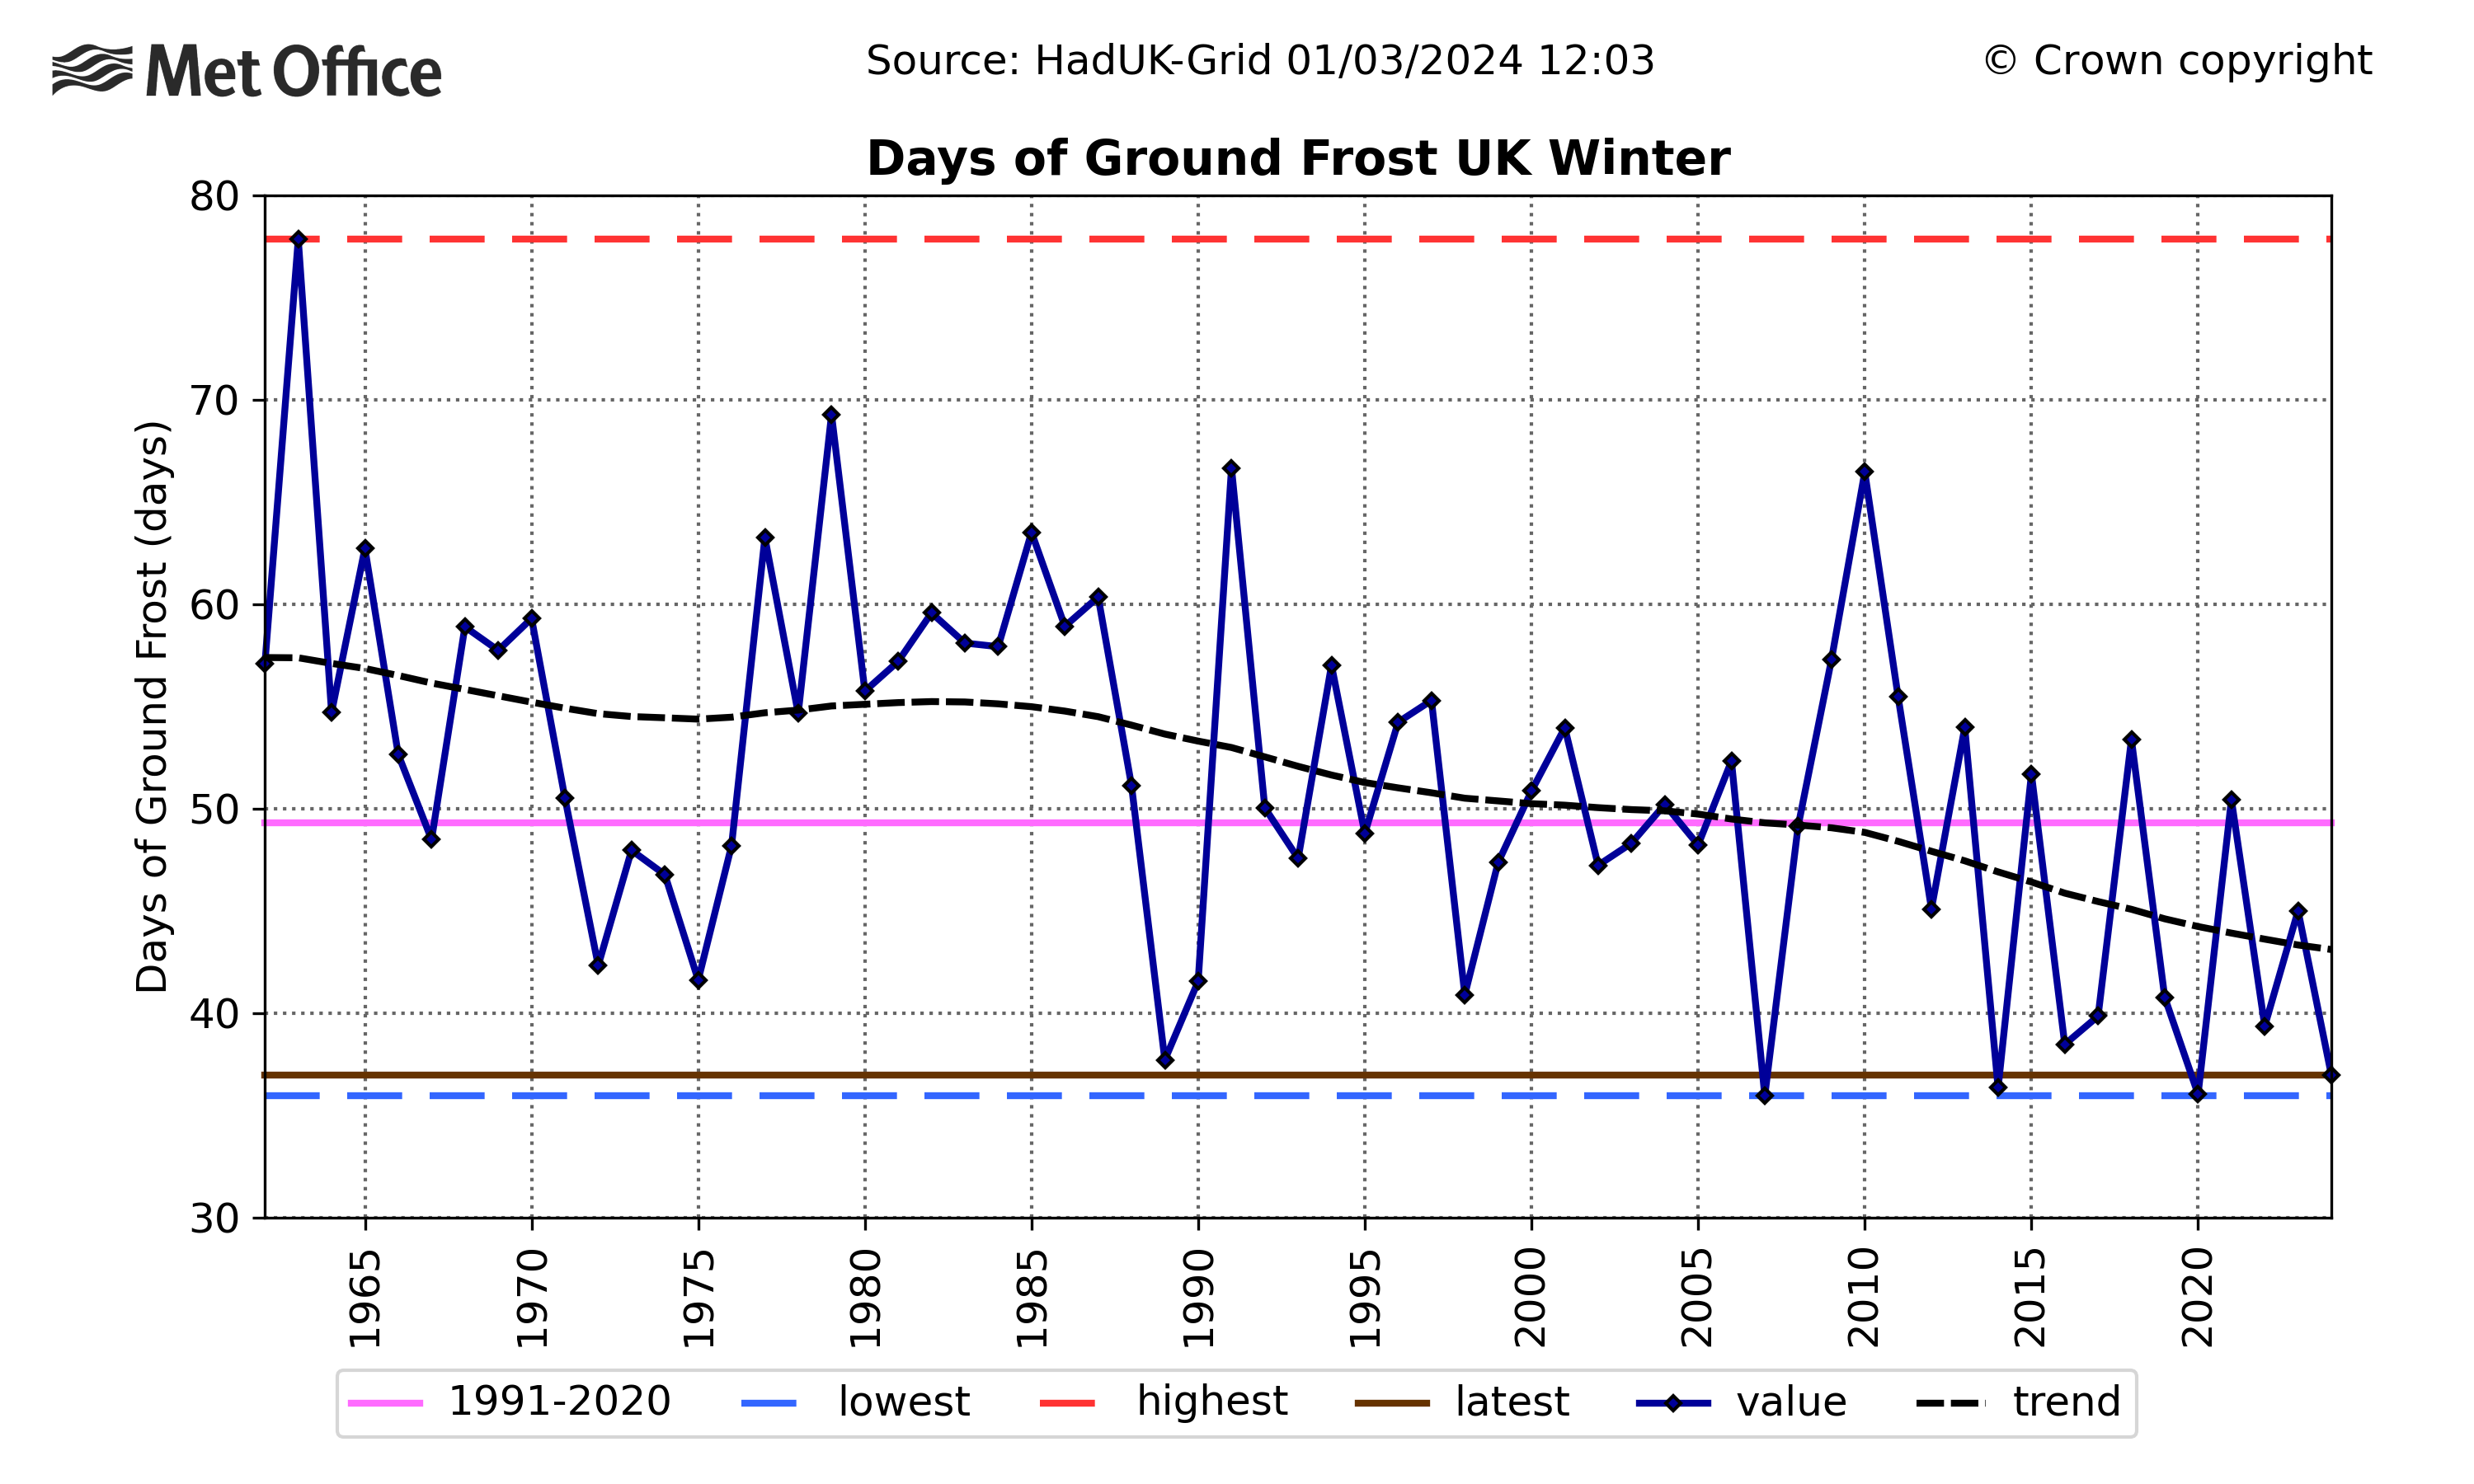
Declining ground frosts in a changing climate
With a warmer than average season, a declining number of ground frosts was again evident for the UK, with significantly fewer ground frosts than average, though it doesn’t trouble any records. If you want to learn more about the reduction in frosts and why it matters, we worked with the BBC to explain.
The UK's changing climate
Observations show a clear warming trend for average UK winter temperature, and this trend is projected to continue in the future due to human induced climate change. This doesn’t mean the UK will no longer see cold spells, like we did this year during the first half of January, however cold spells are projected to become less frequent and less severe.
Although rainfall observations show large variability in annual, seasonal and decadal rainfall, it has generally become wetter, particularly during winter. Climate projections indicate that on average, winters will continue to become wetter and summers drier, though natural variability will mean we will continue to see individual years that don’t follow this trend. As our atmosphere warms it can hold more moisture, roughly 7% more per 1°C of warming. This brings a risk of increased frequency and longevity of heavy rainfall events in the future, particularly during winter, if greenhouse gas emissions continue to rise.
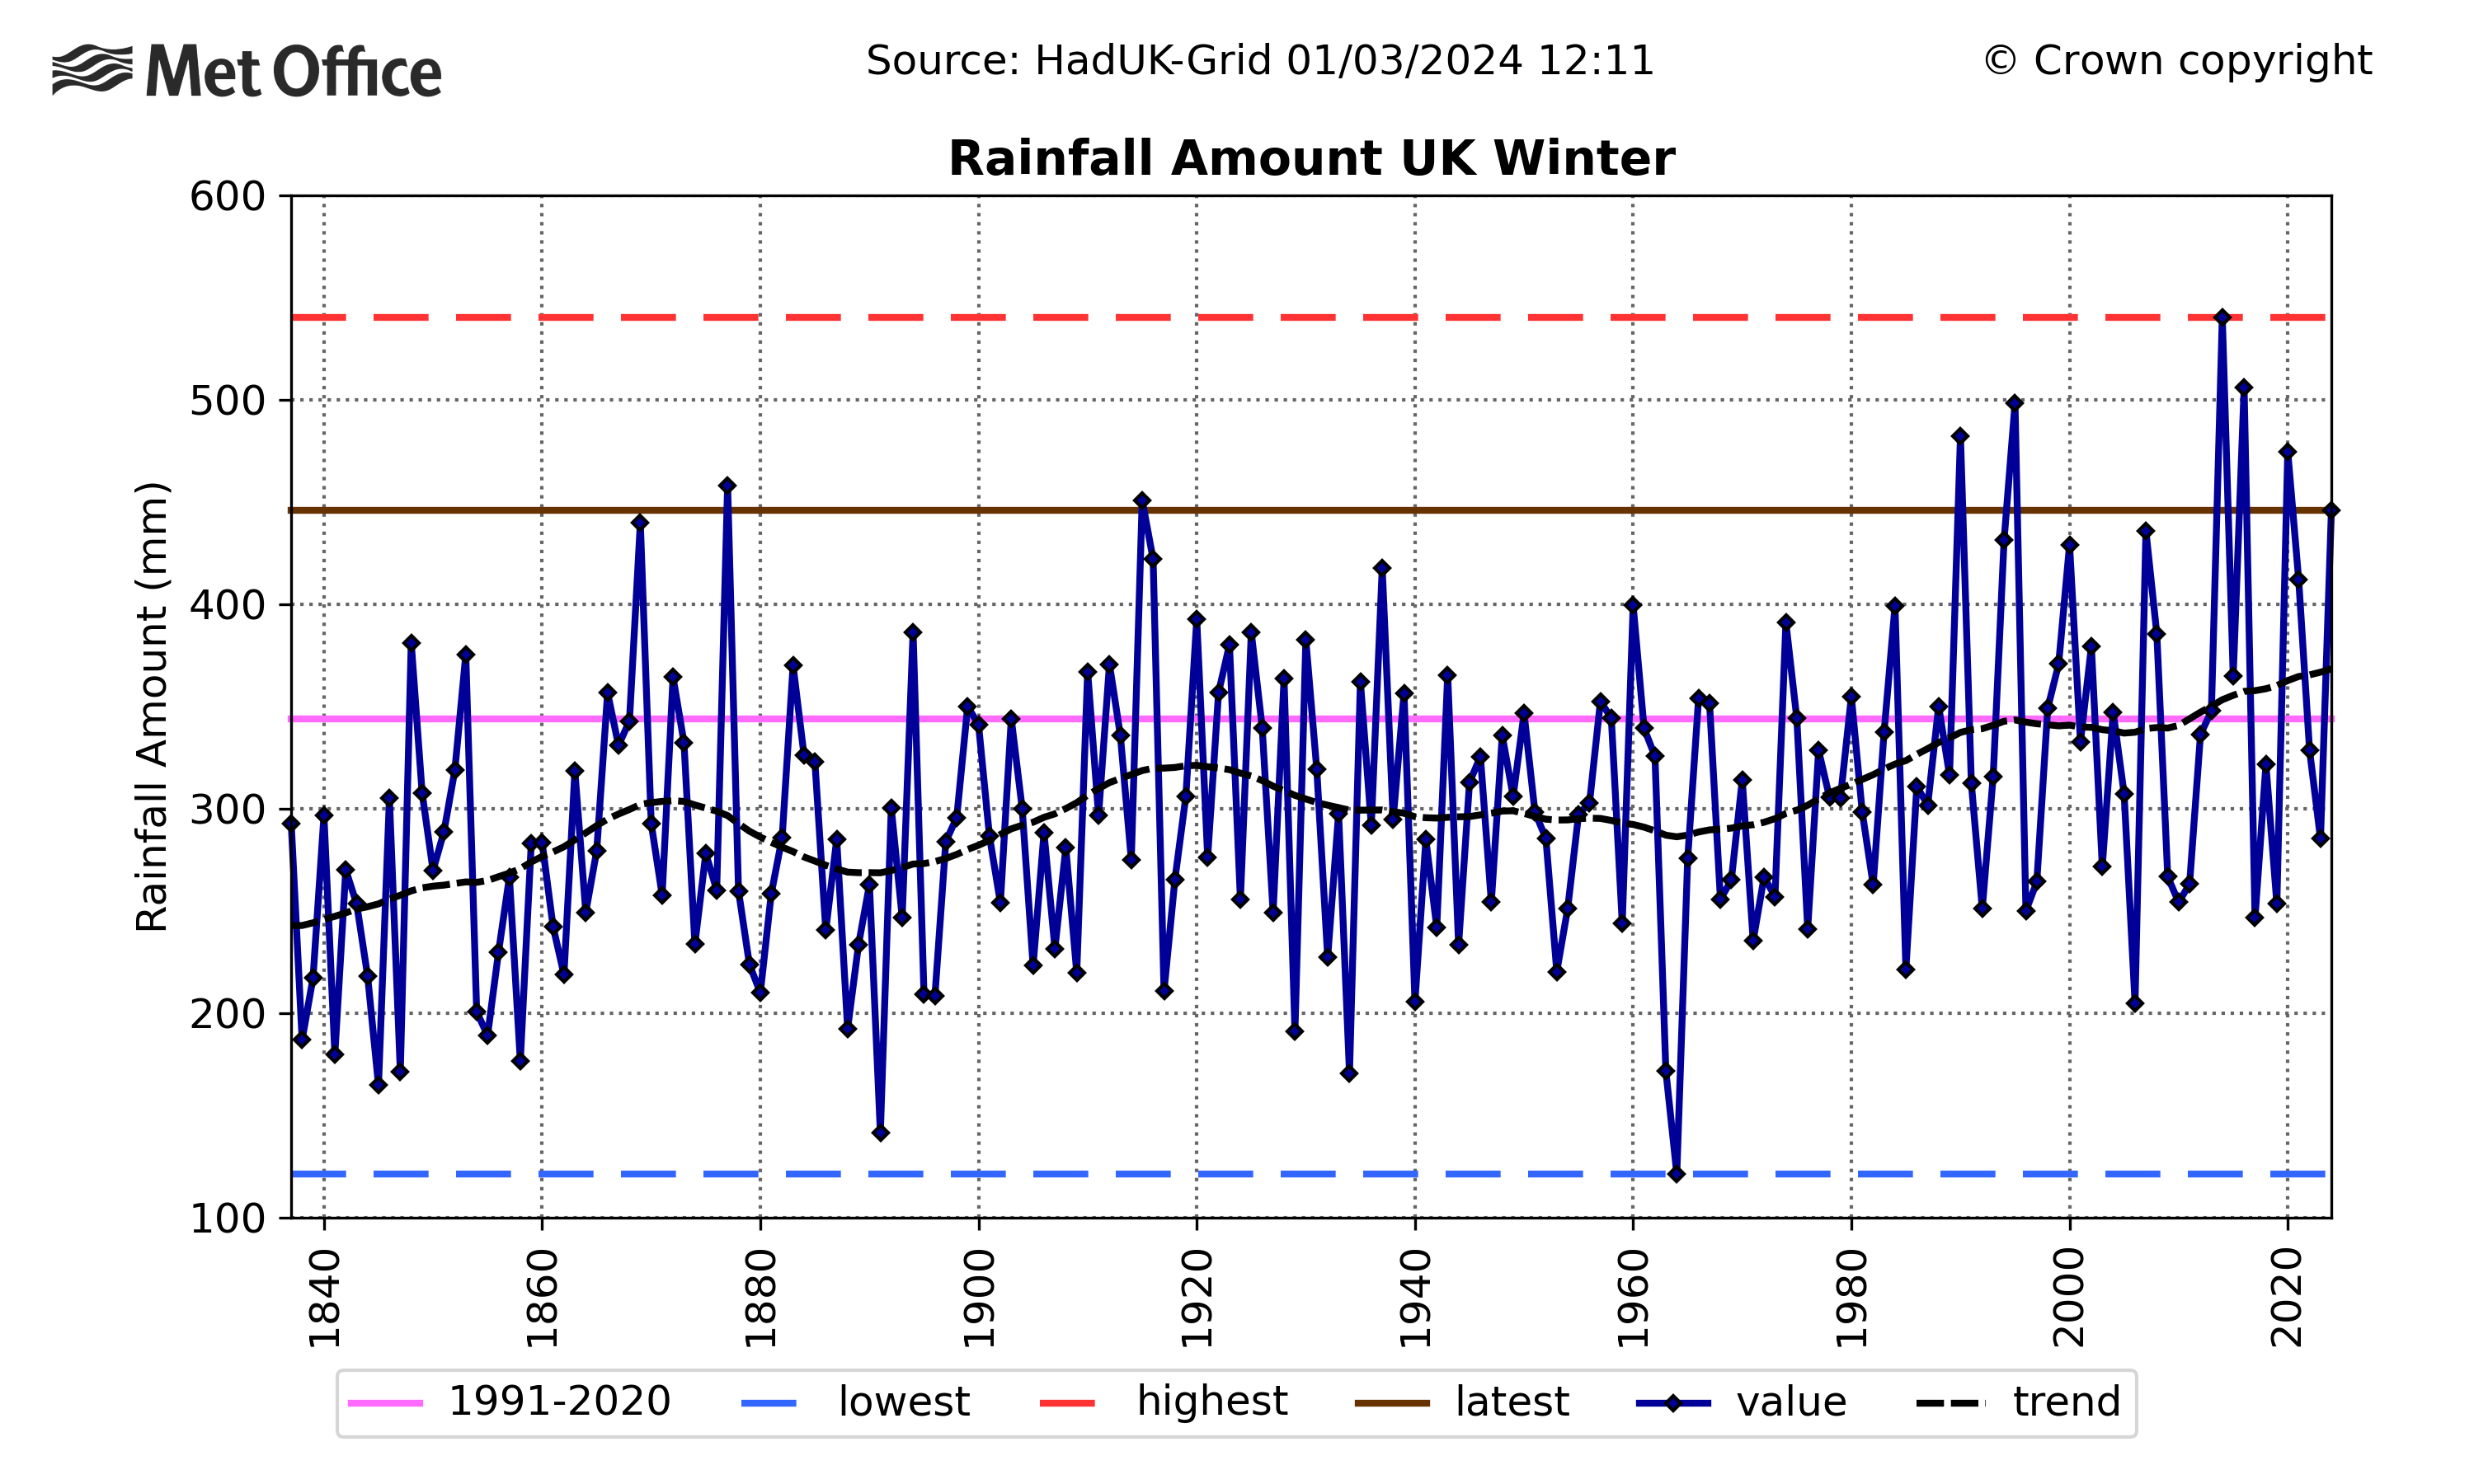
An attribution study was conducted by Met Office scientists on the UK monthly rainfall recorded in February 2020, the wettest February on record in a series back to 1836. It found that extreme rainfall events like February 2020 may have become about 3 times more likely in the current climate and projections under a medium emissions scenario (SSP2-4.5) suggest they may become about 9 times more likely by 2100 due to human induced climate change.
|
Provisional Winter 2023/4 stats |
Max temp (°C) |
Min temp (°C) |
Mean temp (°C) |
Rainfall (mm/%) |
Sunshine (hours/ %) |
|||||
|
Actual |
91/20 anom |
Actual |
91/20 anom |
Actual |
91/20 anom |
Actual |
91/20 anom |
Actual |
91/20 anom |
|
|
UK |
8.0 |
1.1 |
2.5 |
1.3 |
5.3 |
1.2 |
445.8 |
129 |
145.6 |
90 |
|
England |
9.0 |
1.5 |
3.5 |
1.8 |
6.2 |
1.7 |
359.6 |
149 |
153.3 |
83 |
|
Wales |
8.5 |
1.2 |
3.6 |
1.7 |
6.1 |
1.5 |
625.8 |
139 |
122.7 |
78 |
|
Scotland |
6.2 |
0.4 |
0.6 |
0.3 |
3.4 |
0.4 |
560.3 |
114 |
138.4 |
108 |
|
Northern Ireland |
8.5 |
1.0 |
2.9 |
1.2 |
5.7 |
1.1 |
340.0 |
104 |
144.8 |
98 |