
Arctic and Antarctic end-of-season report – October 2021
Alex West, Ed Blockley and Holly Titchner
Summary
- Sea ice extent for September 2021 was the 12th lowest on record.
- Extent was well below average north of Siberia, but closer to average north of Alaska.
- Summer 2021 was warmer than average in the Arctic but cooler than the summers of 2019 and 2020. It was also an extremely stormy Arctic summer.
- Ice melting was faster than average for the first half of the summer but slowed during the second half.
- Predictions of September ice extent tended to underestimate the eventual extent.
- Antarctic sea ice extent has likely reached its seasonal maximum and has been declining since 1st September.
September Arctic sea ice extent
Sea ice extent for September 2021 was 4.87 million sq km according to the HadISST1.2 dataset (Rayner et al., 2003). This was the 12th lowest September extent recorded in the satellite era (since 1979). It was 1.51 million sq km below the 1981-2010 average, and 0.66 million sq km above the long-term linear trend (Figure 1).
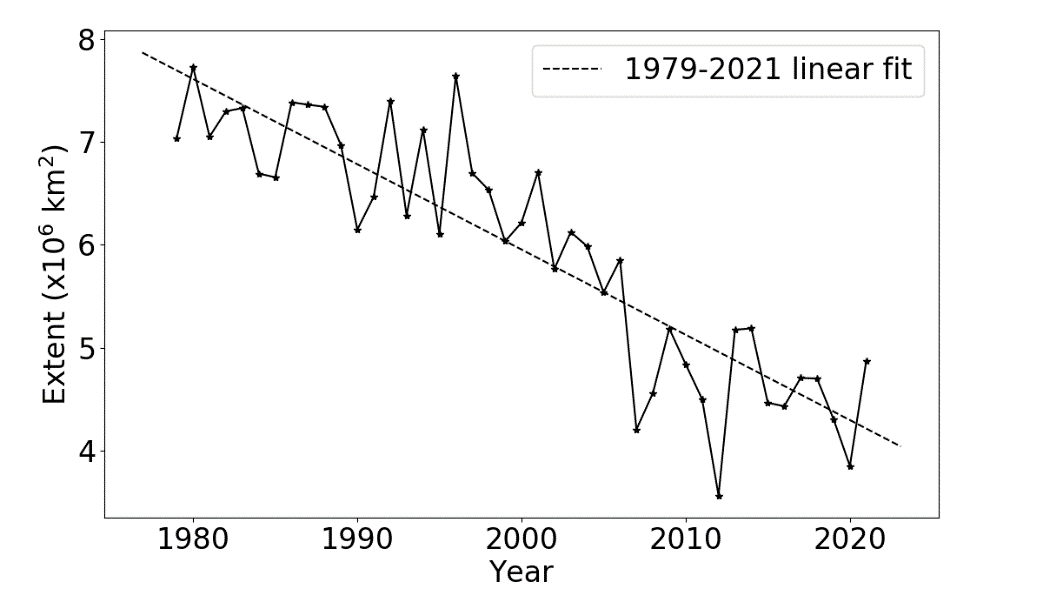 Figure 1. September Arctic sea ice extent during the satellite era, according to HadISST1.2, with linear trend indicated.
Extent at minimum was well below average in the Barents, Kara, Laptev and East Siberian Seas north of Siberia (Figure 2). While it was nearer average in the Beaufort and Chukchi Seas north of Alaska, much of the ice surviving in these regions was rather dispersed, and in an advanced state of melting.
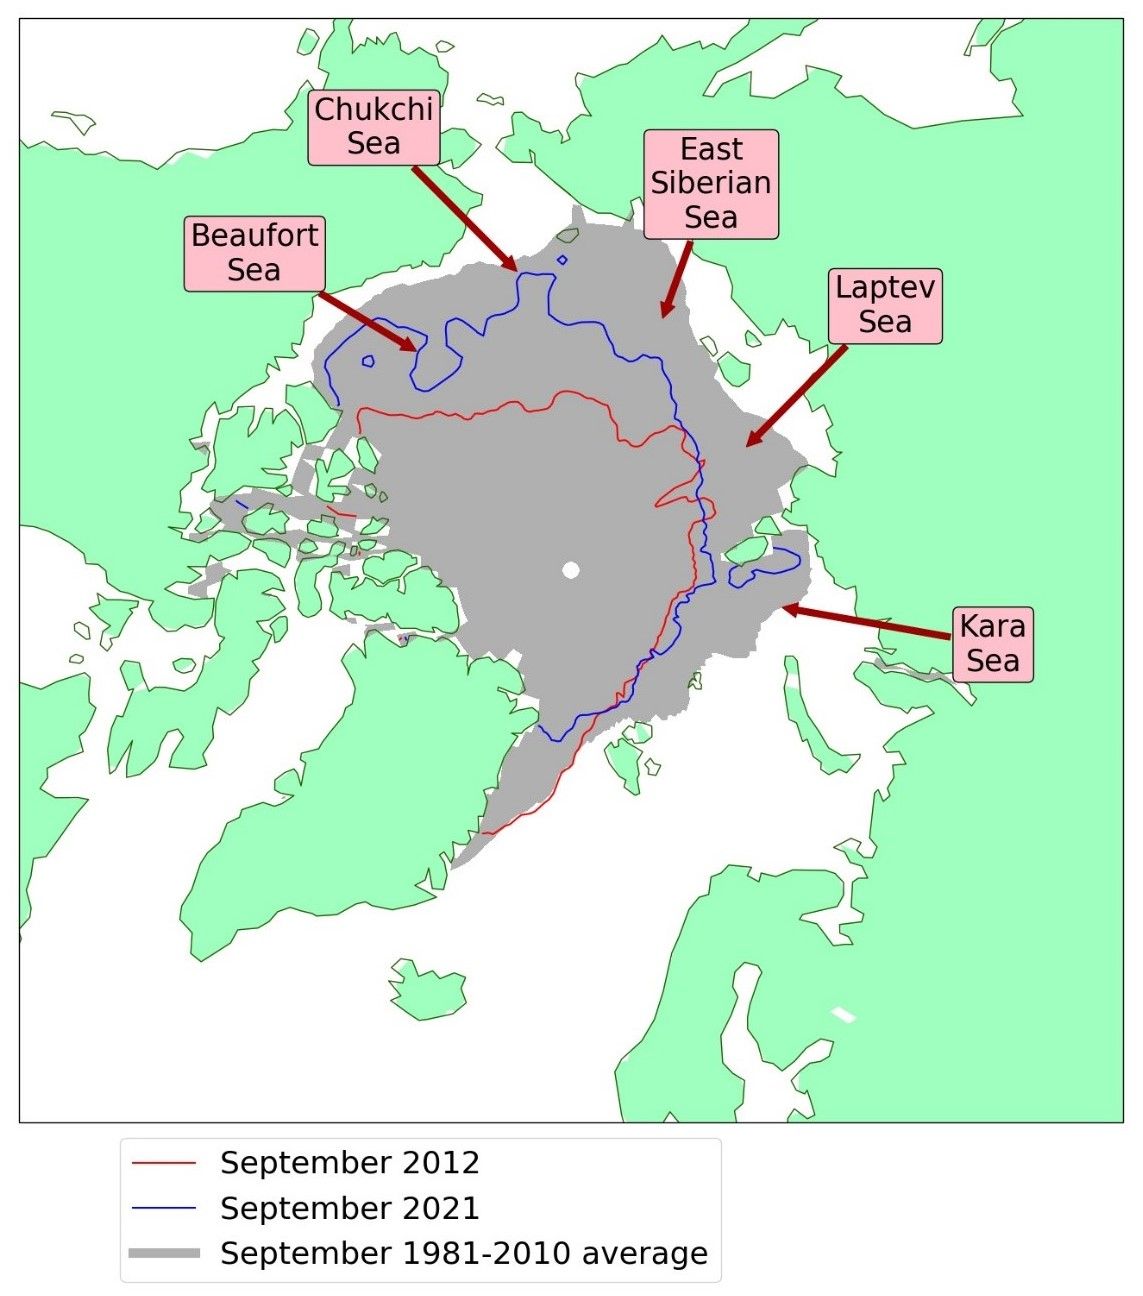
Figure 2. Arctic sea ice extent in September 2021, compared to the record low year of 2012 and the 1981-2010 average, with regions named in the text labelled. Data are from HadISST1.2.
Melt season review
Summer 2021 was warmer than the 1981-2010 average, but substantially cooler than those of 2019 and 2020, which were successive record warm summers (Figure 3). The summer was consistently stormy throughout most of the Arctic, with mean sea level pressure lower than average everywhere except in the East Siberian Sea (Figure 4a). The Laptev Sea saw the highest temperature anomalies (Figure 4b), with a small region exceeding +3°C relative to the 1981-2010 average, partly due to very warm conditions from late June to early July associated with a heatwave in Eastern Siberia. On the other hand, parts of the Beaufort Sea saw below-average temperatures.
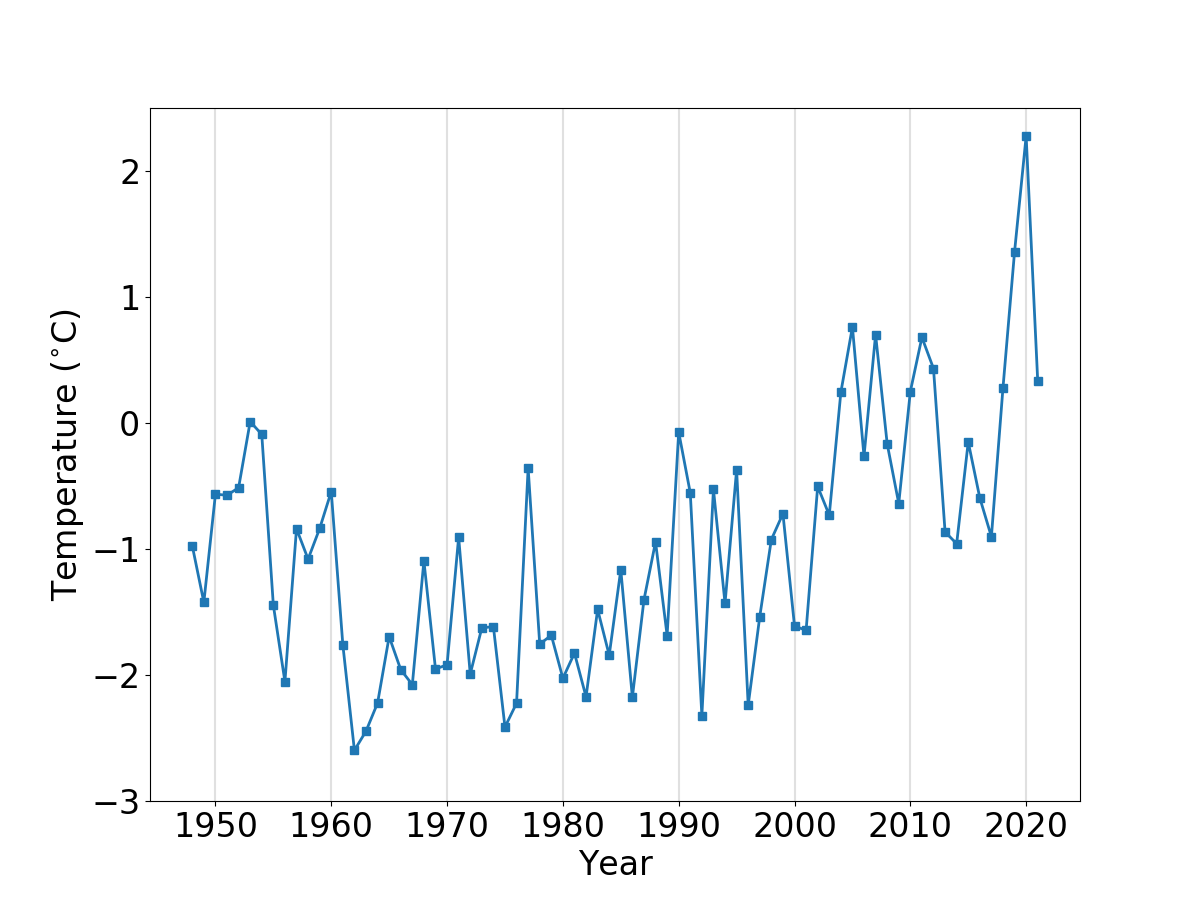
Figure 3. Average May-August temperature anomaly at 925 hPa over the Arctic Ocean region (°C), for the years 1948-2021, relative to the 1981-2010 average. Data are from the NCEP reanalysis.
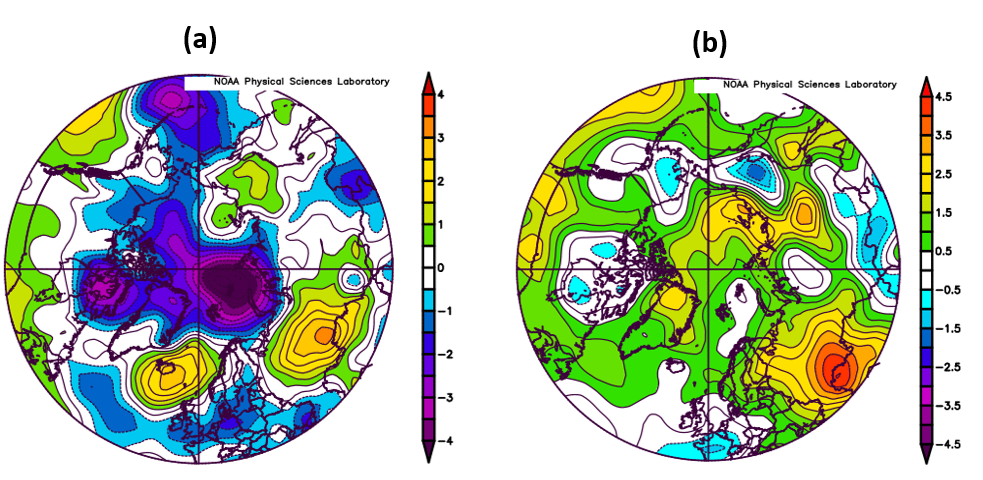
Figure 4.Anomaly in (a) mean sea level pressure (hPa); (b) air temperature (°C) at 925 hPa (about 1km above mean sea level) for May-August 2021, relative to the 1981-2010 average. Data are from the NCEP reanalysis (Kalnay et al., 1996).
The rate of sea ice melt relative to average varied throughout the season, although less dramatically than during Summer 2020. Faster than average sea ice melt mainly occurred during the first half of the melt season (Figure 5), associated particularly with rapid melting in the Laptev Sea. From mid-July to late August ice melt was somewhat slower than average. This change was associated with an atmospheric circulation shift, with the focus of storms tending to move from the Central Arctic to the Beaufort and Chukchi Seas, causing northerly winds over the Laptev and East Siberian Seas and likely slowing melting. From late August until the minimum sea ice extent in mid-September, melting returned to above-average levels, associated with degradation of the ice in the Beaufort and Chukchi Seas.
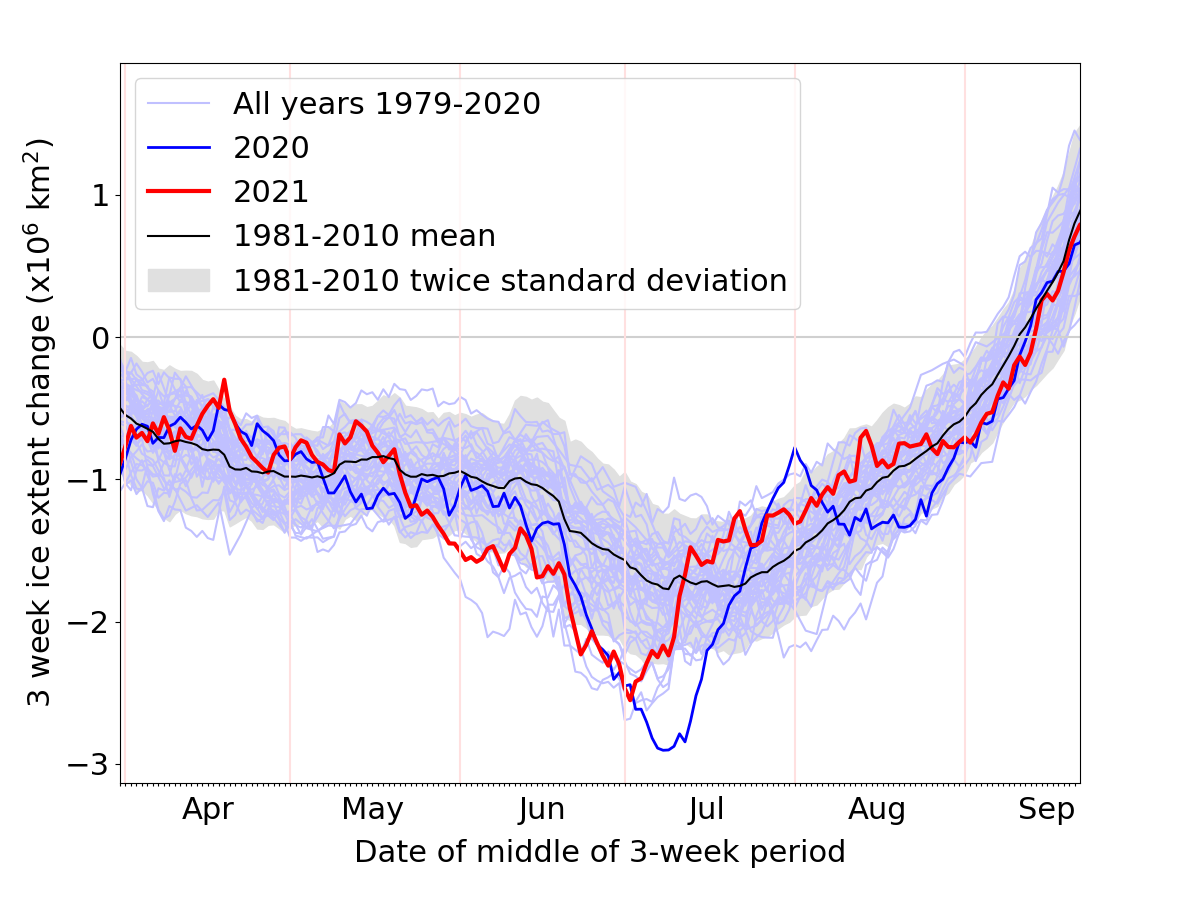
Figure 5. 3-week running mean sea ice extent change for 2021 (red), compared to 2020 (dark blue), previous years from 1979 (light blue) and the 1981-2010 average (black). Data are from NSIDC.
Assessment of September 2021 sea ice predictions
During the summer, the Sea Ice Prediction Network (SIPN) collates predictions of September Arctic sea ice extent from scientific centres around the world and publishes these predictions in a series of Sea Ice Outlooks (SIO), in June, July and August. In 2021, the observed September extent fell towards the higher end of the ranges of predictions for all three outlooks (Figure 6). While the main body of predictions tended to converge as the season progressed (with an interquartile range of 4.17-4.53 in August comparing to 4.07 to 4.69 in June), they converged to a range considerably lower than the eventual September extent. This is a mirror image of the performance of 2020, when predictions converged to a range higher than the eventual extent. It may be partly caused by the timing of melt: the first half of summer 2021 saw well-above average melting rates (Figure 5), but from mid-July to late August the rate of melting was consistently lower than average. Predictions were likely substantially influenced by the earlier fast melting, with little opportunity for the later slow melting to inform even the August predictions.
The reduced performance of the SIPN predictions in 2020 and 2021 is probably also related to these two years displaying quite large departures, in opposite directions, from the linear trend (Figure 1). Stroeve et al. (2014) found that predictions tended to perform more poorly in years when the September extent fell a long way from the linear trend; much larger departures were observed in 2012 and 2013, and predictions performed considerably more poorly in these years than was the case in 2020 and 2021.
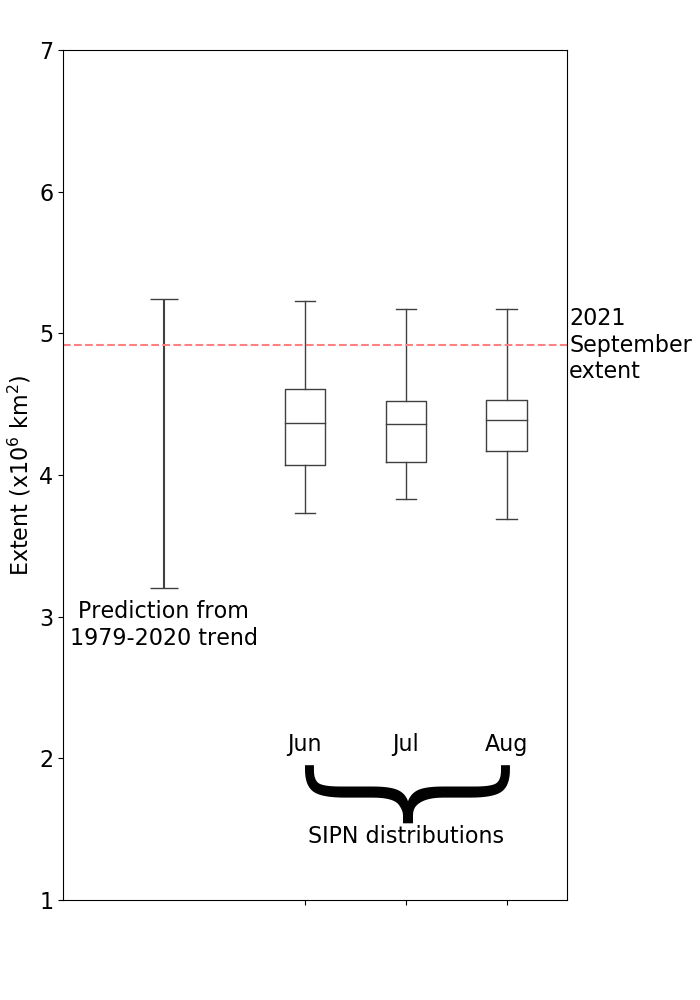
Figure 6. Arctic sea ice extent for September 2021 according to HadISST1.2 (red line), compared to an extrapolation from the long-term linear trend (left) and all the predictions submitted to the three SIO reports (maximum, minimum, median and quartiles from each distribution shown).
Antarctic sea ice extent
Antarctic sea ice reached a maximum extent (to date) of 18.75 million sq km on 1st September 2021 (Figure 7), which is very close to the 1981-2010 average maximum extent of 18.70 million sq km. If not subsequently exceeded, this would represent the second-earliest maximum extent in the satellite record after 2016, in which a maximum extent of 18.53 million sq km was recorded on 30th August. Extent has fallen sharply since, reaching 17.85 million sq km by 10th October. From this time of year onwards Antarctic sea ice extent tends to fall rapidly as the sun rises towards its peak in the Southern Hemisphere, hence it is very likely that the extent of 1st September will not be exceeded.
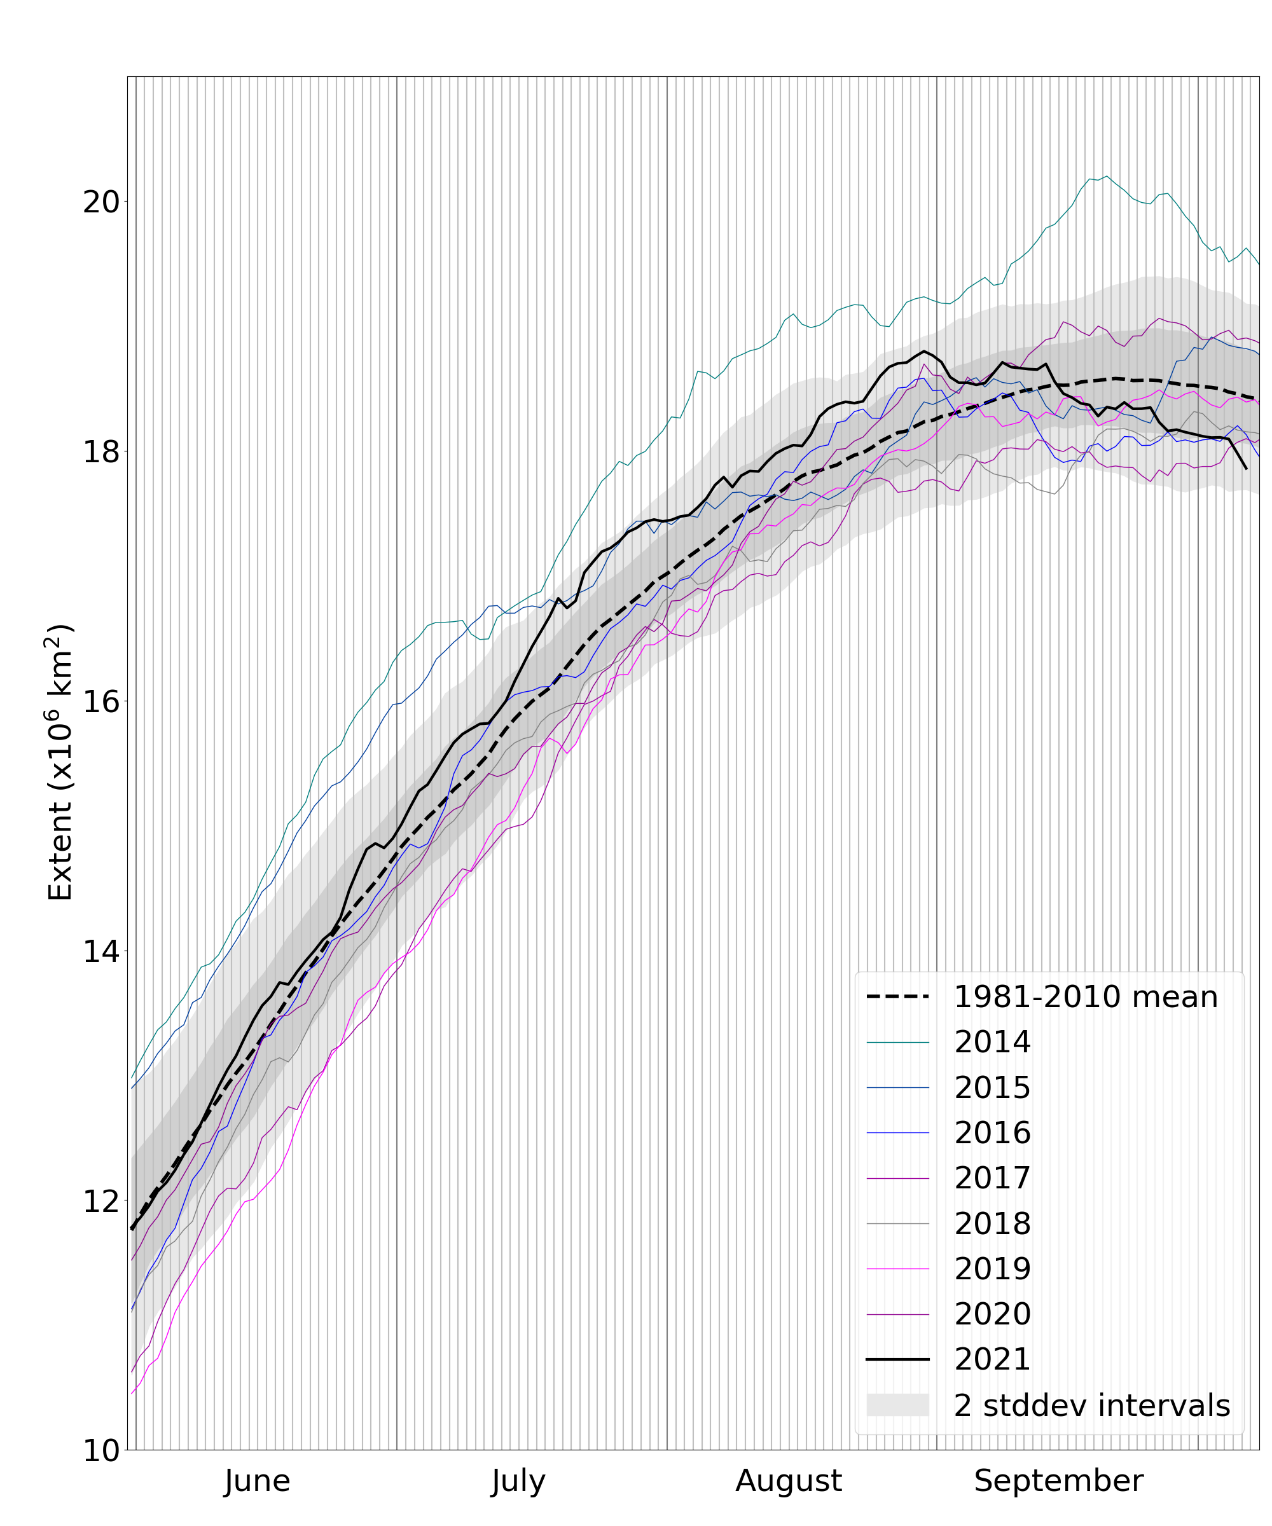
Figure 7. Antarctic sea ice extent for 2021 and other recent years, compared to the 1981-2010 average, with 1 and 2 standard deviation intervals indicated. Data are from NSIDC.
Antarctic sea ice has been at relatively high levels for most of the summer but fell to well-below average levels during September. On 10th October, extent was particularly low in the Bellingshausen and Weddell Seas, and in the eastern Indian Ocean sector, countered by an area of higher-than-average ice extent in the western Indian Ocean sector (Figure 8).
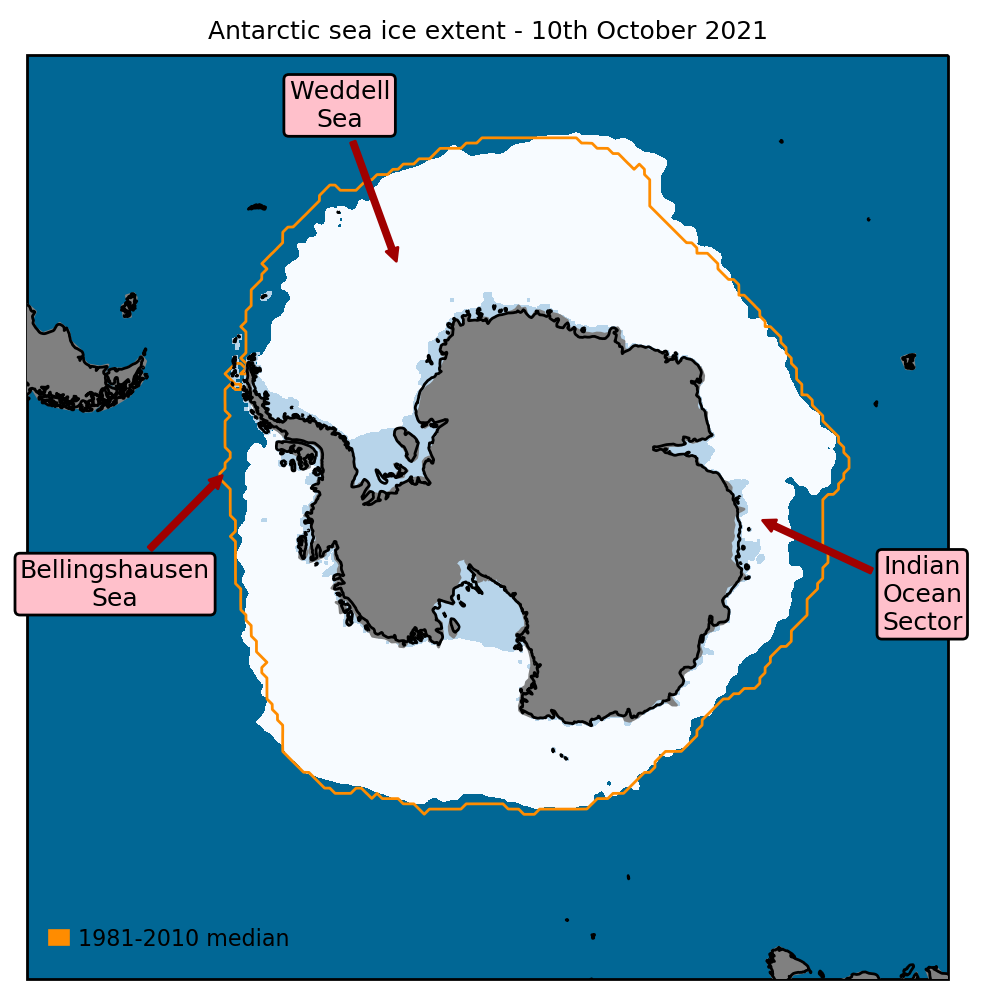
Figure 8. Antarctic sea ice coverage on 10th October 2021, with average September sea ice extent from 1981-2010 indicated in orange and regions referred to in the text labelled. Data are from EUMETSAT OSI-SAF.
References
Kalnay, E., and Coauthors (1996) The NCEP/NCAR 40-Year Reanalysis Project. Bull. Amer. Meteor. Soc., 77, 437–472, https://doi.org/10.1175/1520-0477(1996)077<0437:TNYRP>2.0.CO;2
Rayner, N.A., Parker, D.E., Horton, E.B., Folland, C.K., Alexander, L.V., Rowell, D.P., Kent, E.C. and Kaplan, A. (2003) Global analyses of sea surface temperature, sea ice, and night marine air temperature since the late nineteenth century. J. Geophys. Res., 108, D14, 4407, https://doi.org/10.1029/2002JD002670
Stroeve, J.C., Hamilton, L.C., Bitz, C.M. and Blanchard-Wrigglesworth E. (2014) Predicting September sea ice: Ensemble skill of the SEARCH Sea Ice Outlook 2008-2013. Geophys. Res. Lett., 41, 2411–2418, https://doi.org/10.1002/2014GL059388