
Briefing on Arctic and Antarctic sea ice – August 2022
Alex West and Ed Blockley
Summary
- As of 14th August, Arctic sea ice extent was 14th lowest on record for the date.
- Extent is below average in the Laptev, Kara and Chukchi Seas, but near-average in the Beaufort and East Siberian Seas.
- July Arctic sea ice extent was low but not exceptionally so, with near-average rate of loss.
- As in June, the two halves of July saw contrasting weather, with a stormy first half but a settled second half in the Central Arctic.
- A new record low September extent in 2022 is now very unlikely; a September extent between 3rd – 17th lowest is most likely.
- As of 14th August, Antarctic sea ice extent was lowest on record for the date.
Current Arctic sea ice extent
Arctic sea ice extent on 14th August 2022 was 6.08 million sq km (Figure 1). This was 1.15 million sq km below the 1981-2010 average and was the 14th lowest extent on record for this date (although the highest since 2014). It was 1.36 million sq km above the lowest value for this date, which occurred in 2012.
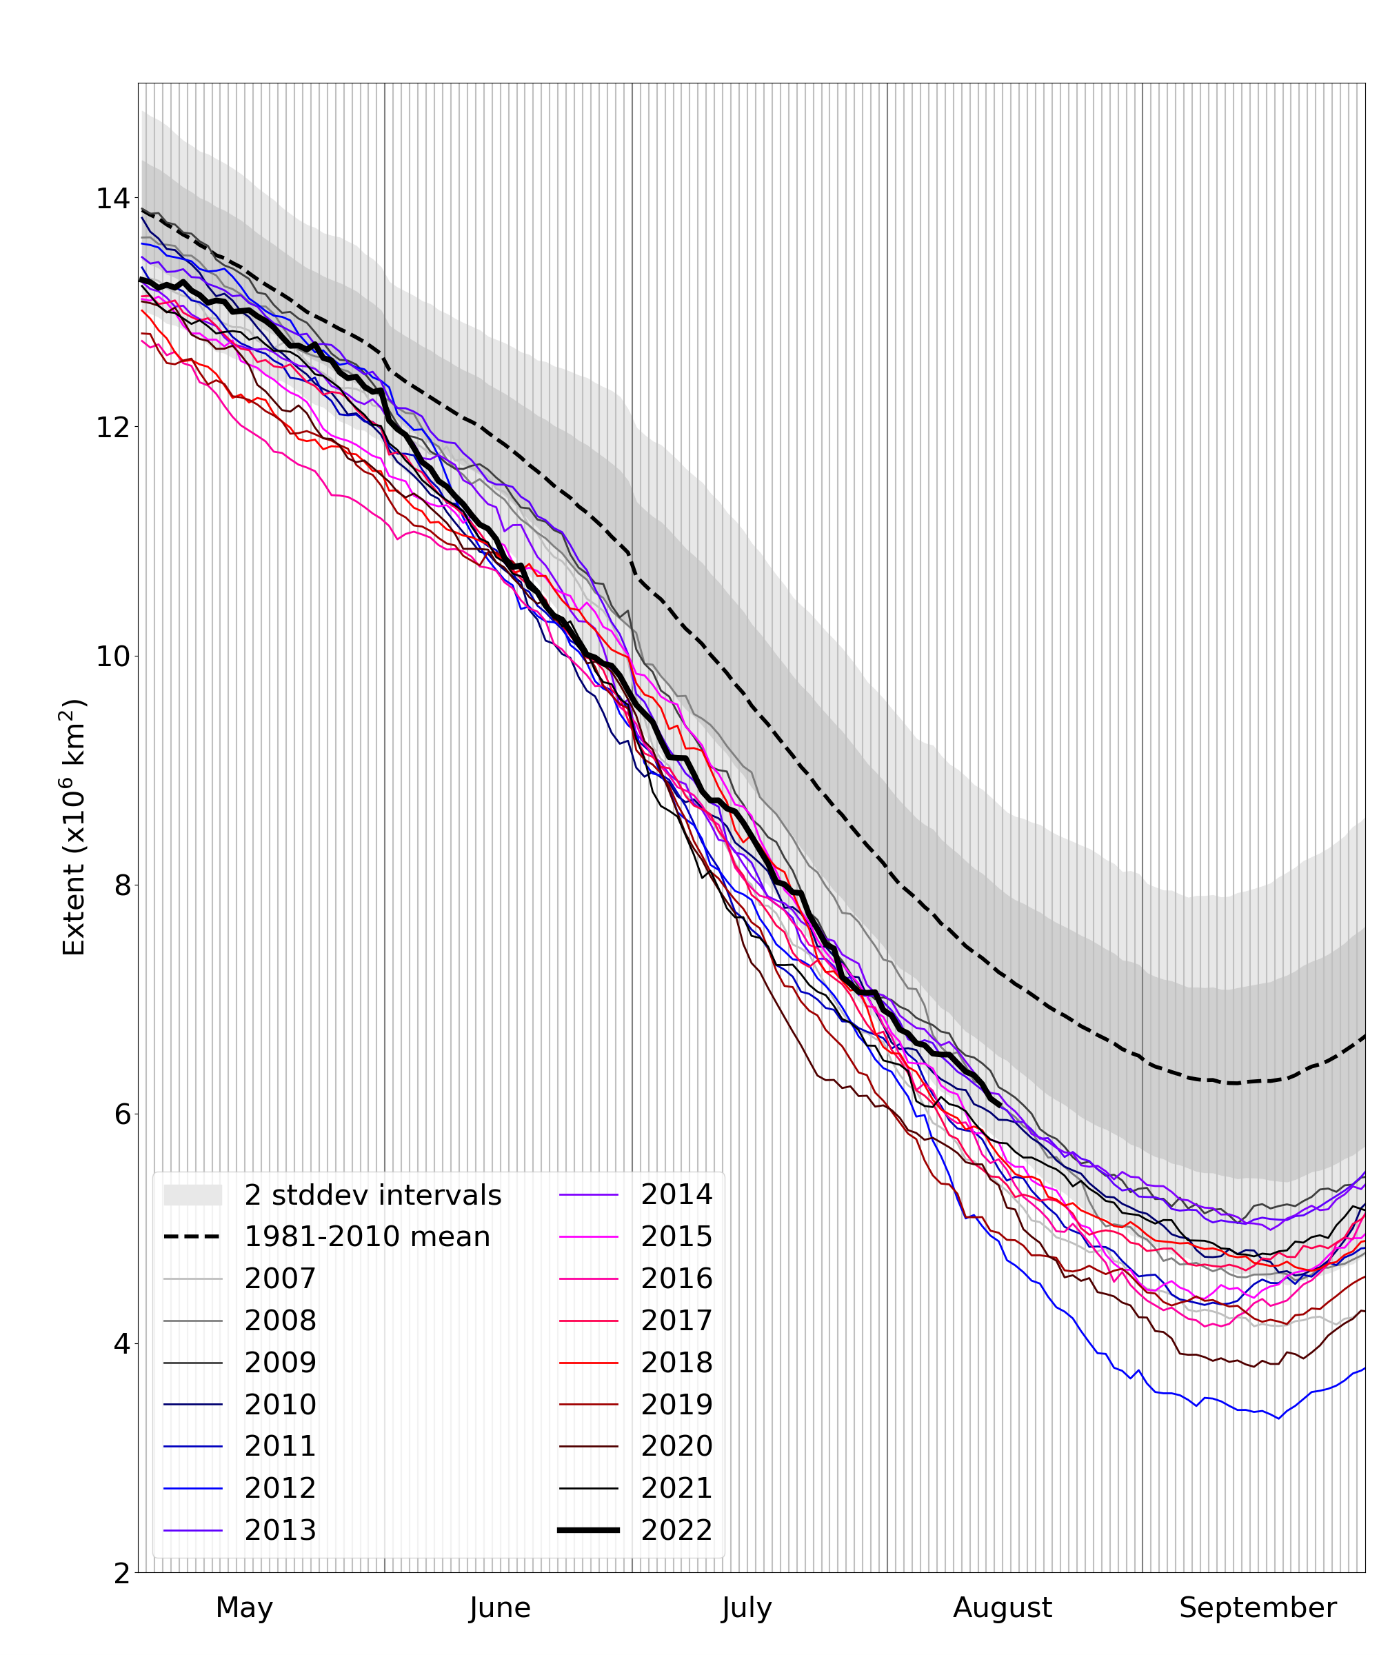
Figure 1. Daily Arctic sea ice extent for 2022, compared with recent years and the 1981-2010 average with ± 1 and 2 standard deviation intervals indicated by the shaded areas. Data are from the National Snow and Ice Data Center (NSIDC).
Extent was well below average in the Kara, Laptev and Chukchi seas, but was near-average in the Beaufort and East Siberian Seas.
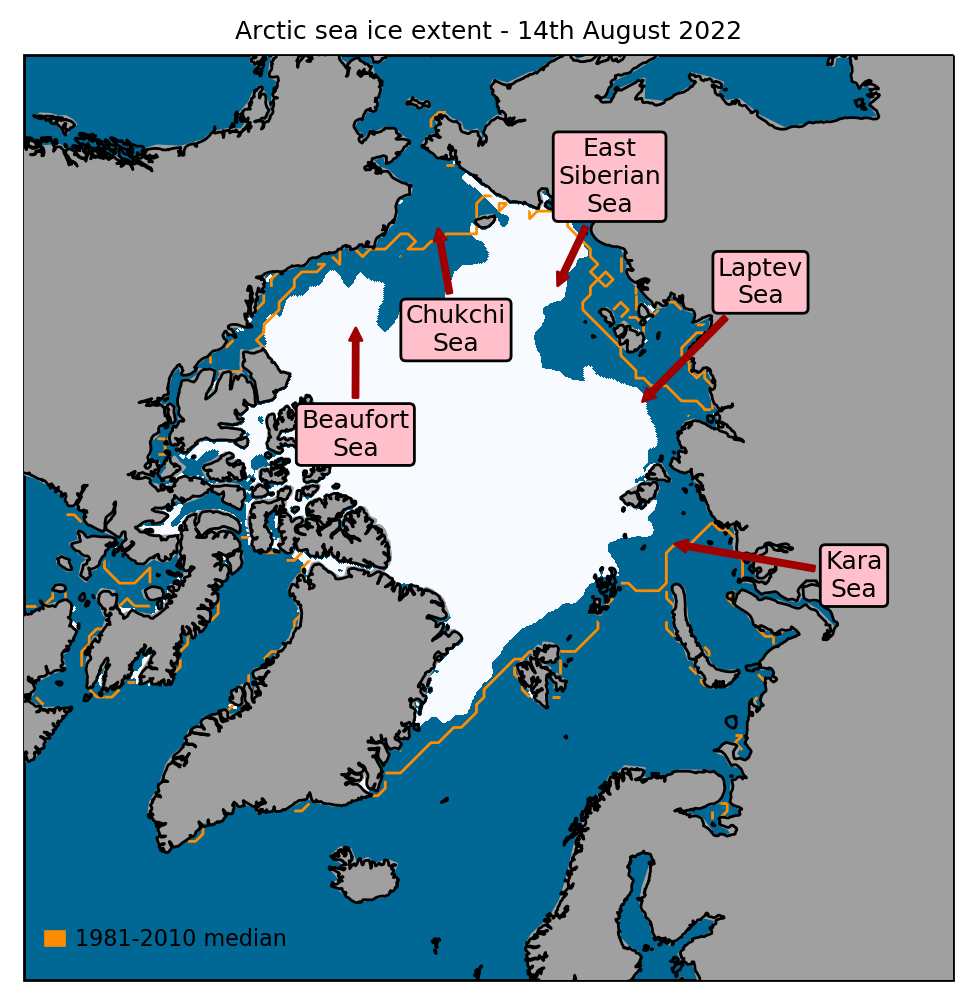
Figure 2. Arctic sea ice extent on 14th August 2022, with 1981-2010 average extent indicated in orange, and the regions referred to in the text labelled. Data are from EUMETSAT OSI SAF (Tonboe et al., 2017).
Arctic: July 2022 in context
Average Arctic sea ice extent for July 2022 was 8.32 million sq km (Figure 3). This was 1.23 million sq km below the 1981-2010 average but was 0.76 million sq km above the long-term linear trend. The average rate of sea ice loss for July 2022 was 89,000 sq km per day, near the 1981-2010 average of 86,000 sq km per day.
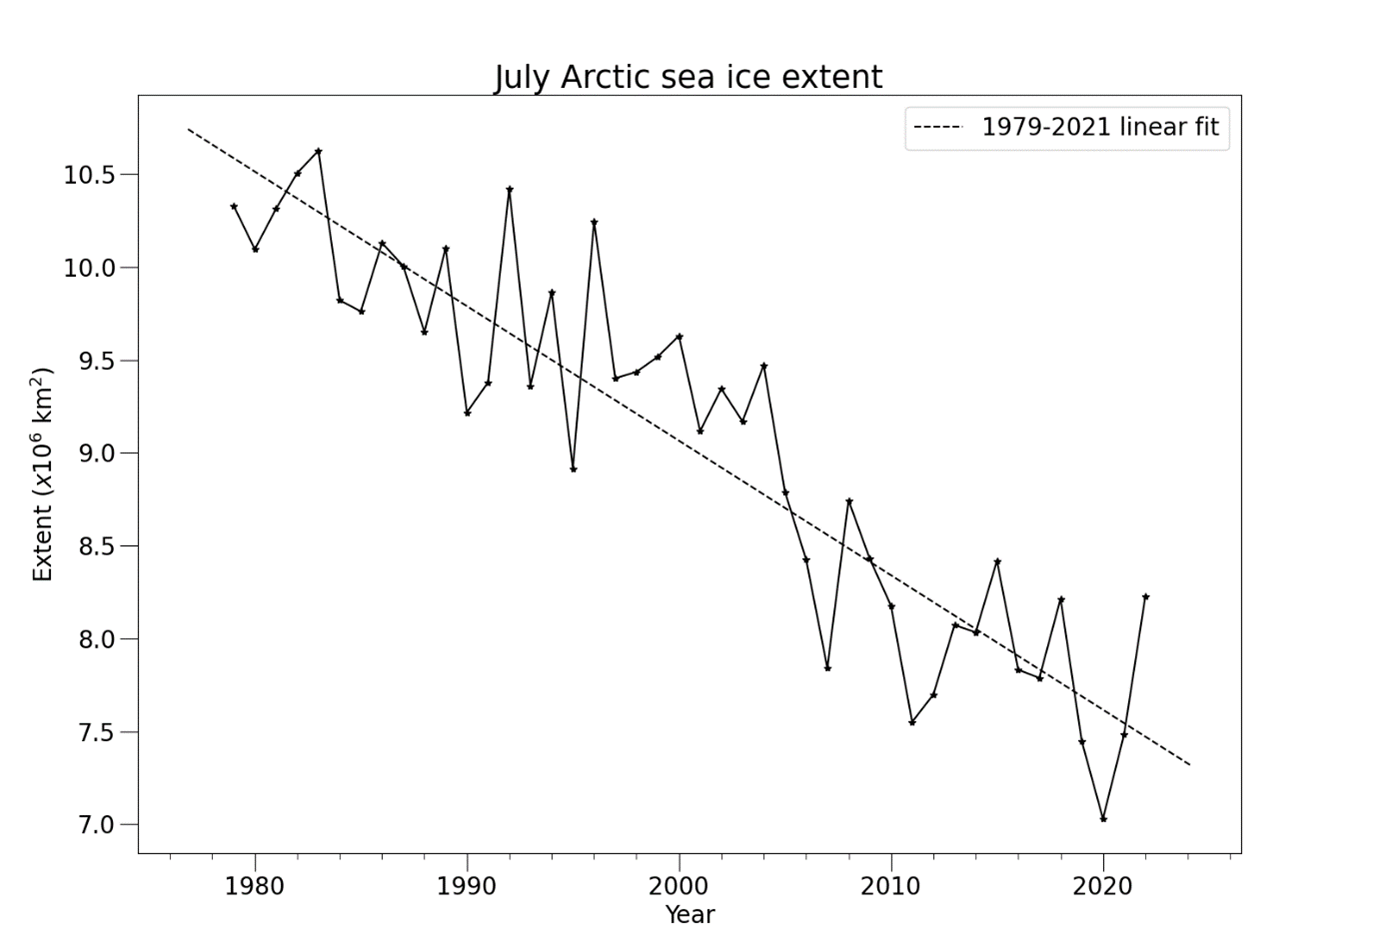
Figure 3. Average July Arctic sea ice extent according to the Hadley Centre Sea Ice and Sea Surface Temperature (HadISST) 1.2 dataset (Rayner et al., 2003).
The first half of July was marked by the continuation of a stormy spell of weather in the central Arctic that began in mid-June (Figure 4a). With relatively little warm air from lower latitudes entering the Arctic, upper air temperatures were near or below-average throughout the whole Arctic Ocean except the Beaufort and Barents Seas (Figure 4b). Around mid-month another pronounced change took place as a ridge of high pressure built into the Arctic from Western Siberia, settling the weather down (Figure 4c). Upper air temperatures were then well above average throughout the Atlantic sector (Figure 4d), associated with southerly winds to the west of the high pressure. However, conditions were colder than average in the East Siberian Sea, which saw persistent northerlies throughout the second half of the month. The cold weather, and direct spreading of the ice by the winds, likely explains the near-average extent in this region.
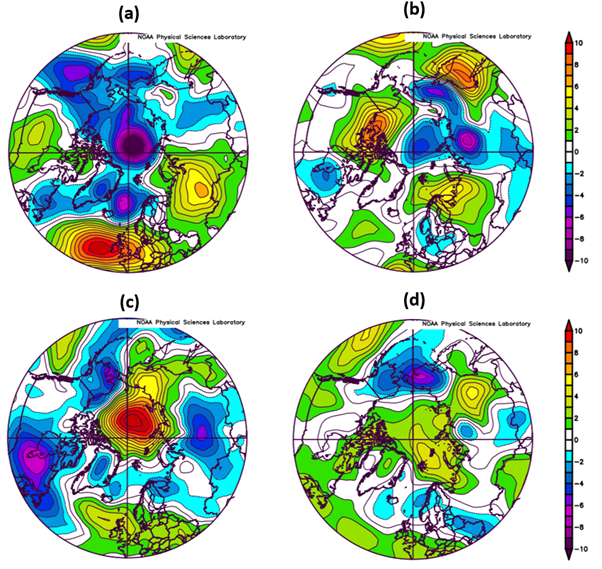
Figure 4. (a, c) Mean sea level pressure anomaly (hPa); (b, d) air temperature anomaly (°C) at 925 hPa, for 1st-15th July 2022 (top row) and 16th-31st July 2022 (bottom row). Anomalies are relative to the 1981-2010 average. Data are from the NCEP reanalysis (Kalnay et al., 1996).
Outlook for September
A new record low September average Arctic sea ice extent is now unlikely to occur this year. This would require, for the remainder of the summer, an average melt rate far in excess of the fastest rate observed over the satellite era since 1979. However, it is likely that 2022 will see another well below average September sea ice extent, between 3rd – 17th lowest.
Each year the Sea Ice Prediction Network (SIPN) compiles predictions of September Arctic sea ice extent from scientific centres around the world in a series of reports published throughout the summer (known as the Sea Ice Outlook, SIO). The July report comprises 30 predictions of 2022 September extent ranging from 3.96 to 5.26 million sq km (equivalent to 3rd and 16th lowest respectively), with a median estimate of 4.65 million sq km and an interquartile range of 4.49 to 4.76 million sq km (Figure 5, purple box-plot). None of the July SIO predictions would represent a new record low extent.
To complement the SIO estimates, three predictions of September sea ice extent are made using basic statistical methods (also shown on Figure 5):
- A prediction based on extrapolating the long-term linear trend gives a predicted September sea ice extent of 4.15 ± 1.05 million sq km, indicated in black on Figure 5.
- There is a good correlation between mean September ice extent and the extent for 31st July – 14th August (the most recent 15 days of data available at the time of writing). Applying simple statistical methods to the anomalies for these dates gives a prediction of September mean extent of 5.01 ± 0.51 million sq km, indicated in blue on Figure 5. This encompasses ice extents that would range from 7th to 17th lowest.
- Finally, applying the trajectories of melting observed over August and September from each of the last 15 years (2007 onward) to the current Arctic sea ice extent provides an estimate of the September sea ice extents that remain likely this year, which ranges from 4.68 to 5.47 million sq km (Figure 5, red box-plot). A sea ice extent of 4.68 million sq km would represent the joint-9th lowest September extent on record (equal to 2017 and 2018), whilst 5.47 million sq km would represent the 16th lowest, and the highest of the post-2007 era.
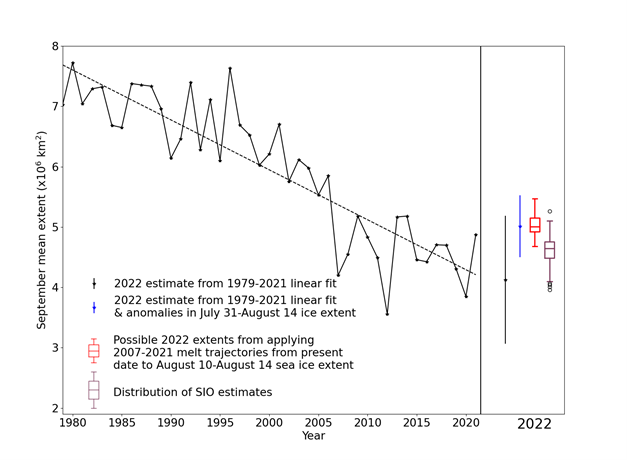
Figure 5. September median Arctic sea ice extent since satellite records began in 1979 from the HadISST1.2 dataset (Rayner et al., 2003), with SIPN Sea Ice Outlook and statistical predictions for September 2022. For the statistical predictions derived from linear fit, error bars represent twice the standard deviation of September mean ice extent about the trend lines with respect to which the estimates are taken. The range of predictions derived from past melting trajectories is shown as a red boxplot indicating range, median and quartiles of estimates derived from each trajectory in the 2007-2021 period. The Sea Ice Outlook is shown as a purple boxplot indicating range, median and quartiles of the 30 predictions submitted.
Current Antarctic sea ice extent
Antarctic sea ice extent on 14th August 2022 was 16.86 million sq km (Figure 6). This was the lowest extent on record for this date, the previous lowest having been 16.89 million sq km in 2002. It was 0.84 million sq km below the 1981-2010 average.
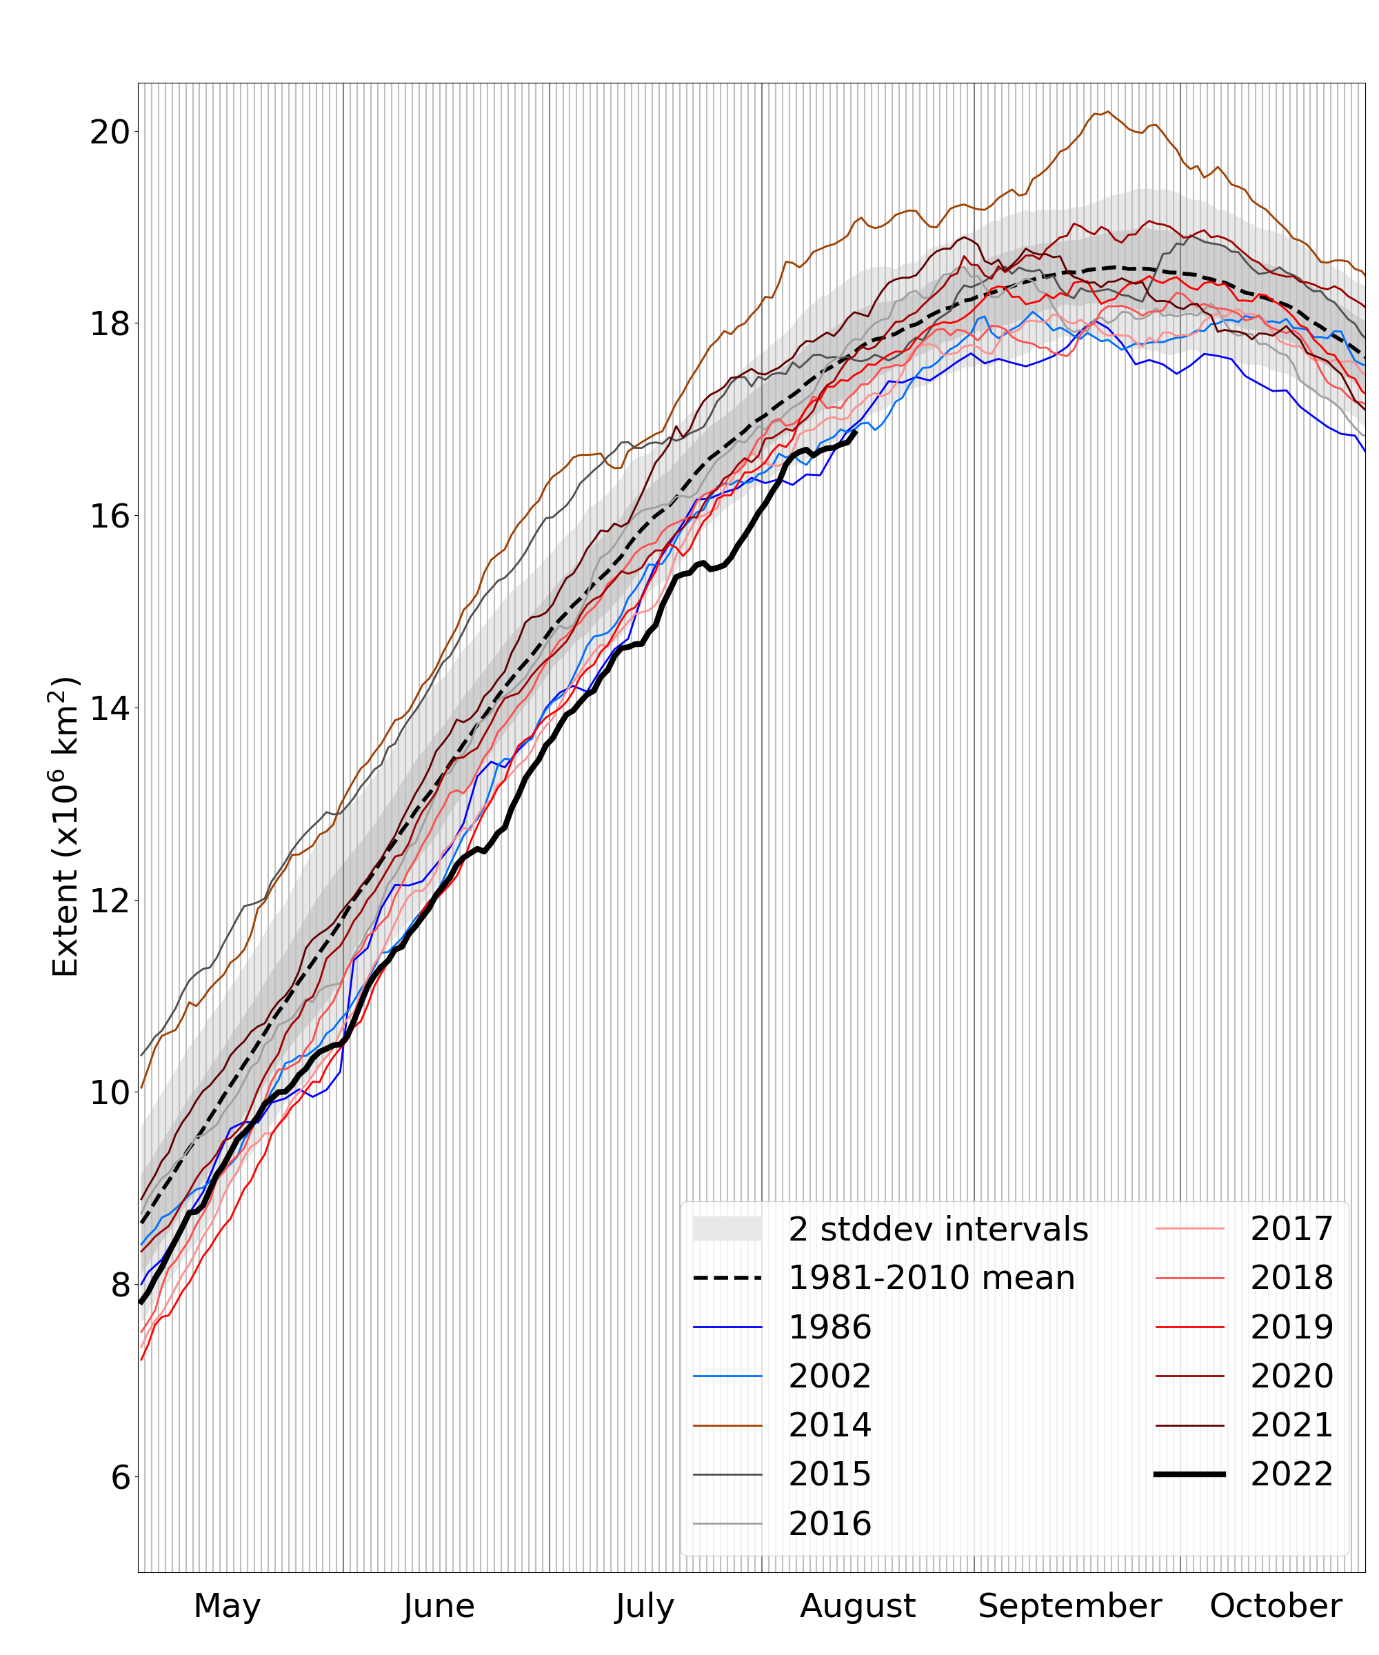
Figure 6. Daily Antarctic sea ice extent for 2022, compared with recent years, the low ice years of 1986 and 2002, and the 1981-2010 average, with ± 1 and 2 standard deviation intervals indicated by the shaded areas. Data are from NSIDC.
Extent was below average in the Bellingshausen and Weddell Seas on either side of the Antarctic Peninsula and was also below average in the Indian Ocean sector off East Antarctica. However, this was partially countered by well-above average extent in the Ross Sea (Figure 7).
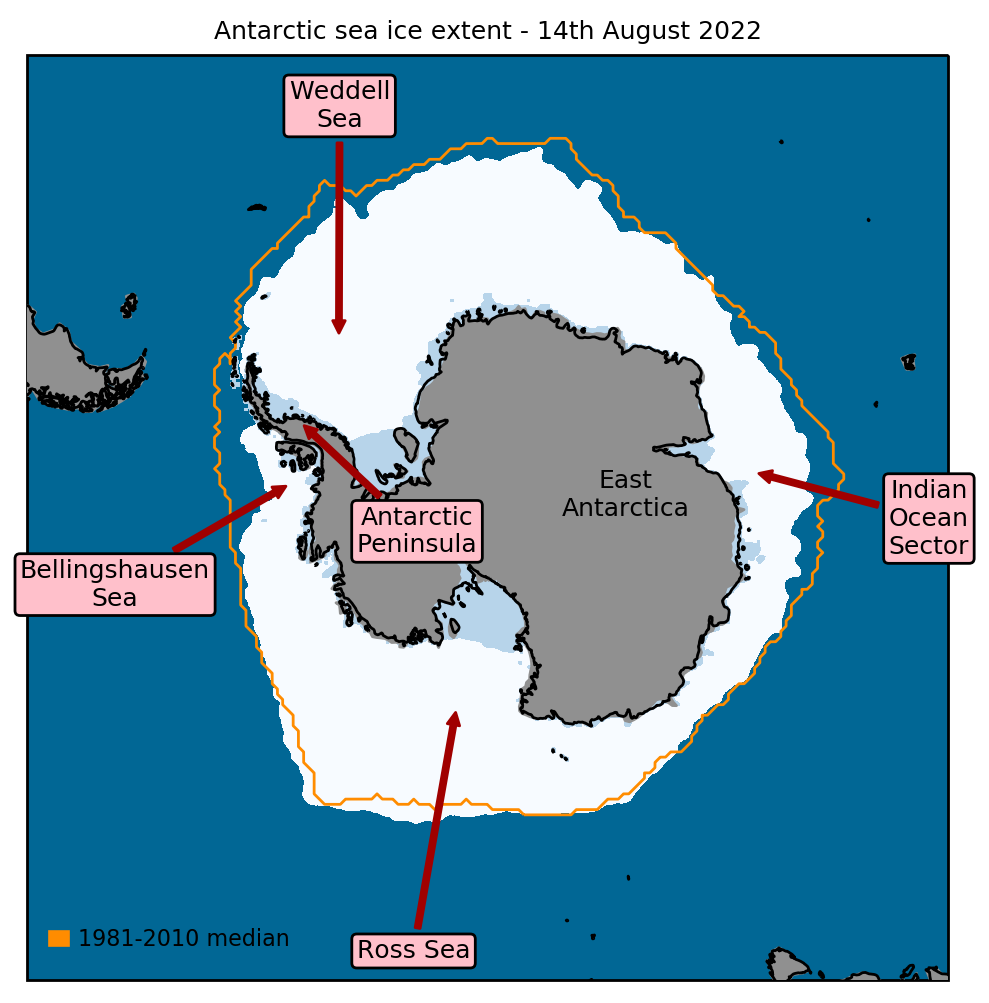
Figure 7. Antarctic sea ice extent on 14th August 2022, with 1981-2010 average extent indicated in orange, and regions referred to in the text labelled. Data are from EUMETSAT OSI SAF (Tonboe et al., 2017).
References
Kalnay, E., and Coauthors (1996) The NCEP/NCAR 40-Year Reanalysis Project. Bull. Amer. Meteor. Soc., 77, 437–472, https://doi.org/10.1175/1520-0477(1996)077<0437:TNYRP>2.0.CO;2
Rayner, N.A., Parker, D.E., Horton, E.B., Folland, C.K., Alexander, L.V., Rowell, D.P., Kent, E.C. and Kaplan, A. (2003) Global analyses of sea surface temperature, sea ice, and night marine air temperature since the late nineteenth century. J. Geophys. Res. Atmos., 108, D14, 4407, https://doi.org/10.1029/2002JD002670
Tonboe, R., Lavelle, J., Pfeiffer, R.-H. and Howe, E. (2017) OSI SAF Global Sea Ice Concentration. Product OSI-401-b. Version 1.6. September 2017, Available at: https://osi-saf.eumetsat.int/products/osi-401-b