
Briefing on Arctic and Antarctic sea ice - July 2022
Alex West and Ed Blockley
Summary
- Arctic sea ice extent on 10th July 2022 was notably but not exceptionally low at 8.74 million sq km. It was the 12th lowest on record for this date.
- Extent was well below average in regions of the Arctic Ocean north of Siberia, but in other regions substantial ice-free areas had not yet developed.
- June saw the 4th fastest rate of Arctic sea ice loss observed on record for this month, with average extent well below average.
- While a new record low September sea ice extent remains possible at this stage, there are currently no heightened indications of such an event happening this year. Predictions of September sea ice extent submitted to the Sea Ice Outlook, and basic statistical methods, nevertheless suggest that this September’s ice extent is likely to be among the 16 lowest on record.
- Antarctic sea ice extent remains lowest on record for this date, as of 10th July; areas of below-average extent are concentrated in the seas bordering West Antarctica.
Current Arctic sea ice extent
Arctic sea ice extent on 10th July 2022 was 8.74 million sq km. This was 1.27 million sq km below the 1981-2010 average and the 12th lowest on record for this date.
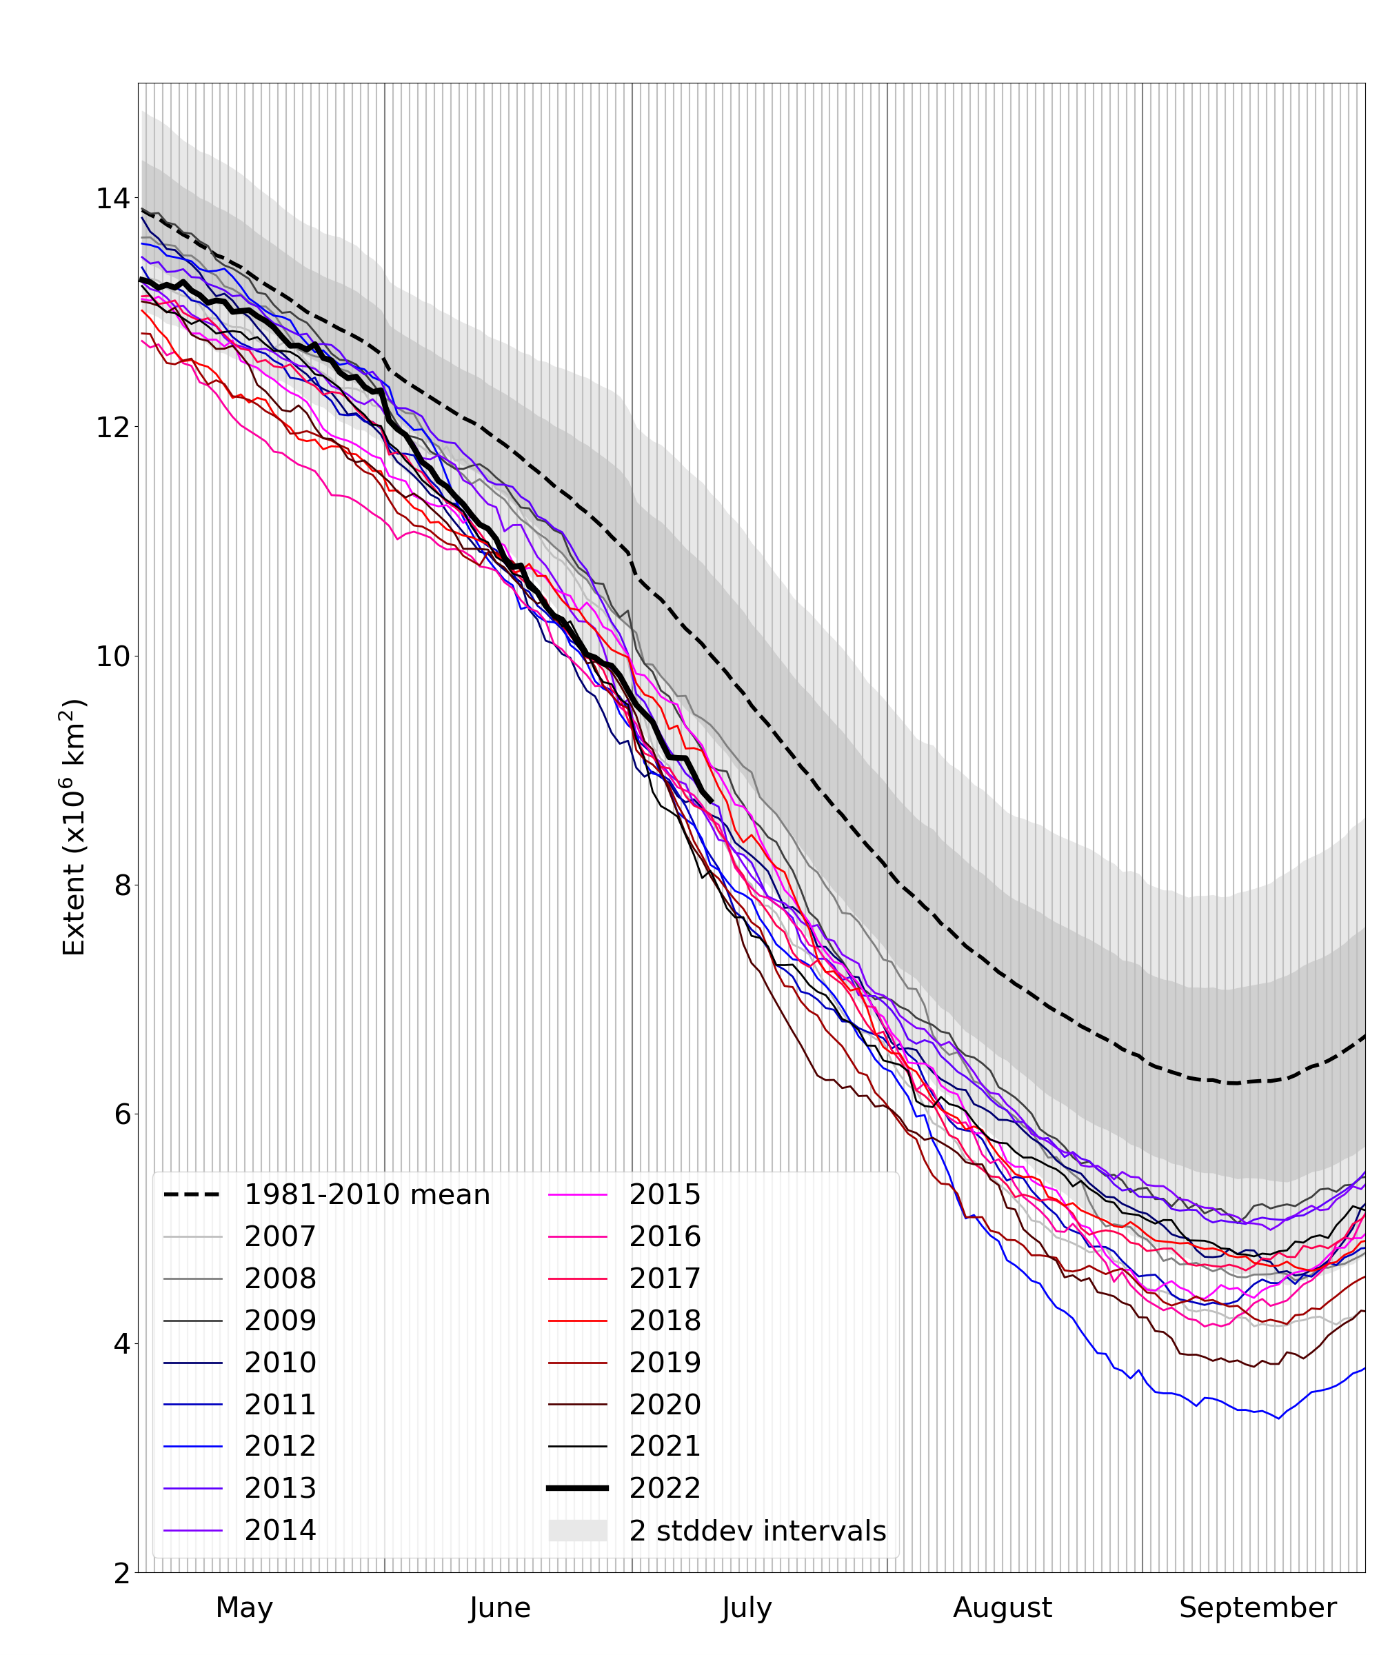
Figure 1. Daily Arctic sea ice extent for 2022, compared with recent years and the 1981-2010 average with ± 1 and 2 standard deviation intervals indicated by the shaded areas. Data are from the National Snow and Ice Data Center (NSIDC).
Extent was well below average in the Barents, Kara and Laptev Seas, and somewhat below average in the Chukchi Sea, but in other regions of the Arctic Ocean substantial ice-free areas had not yet developed as of 10th July.
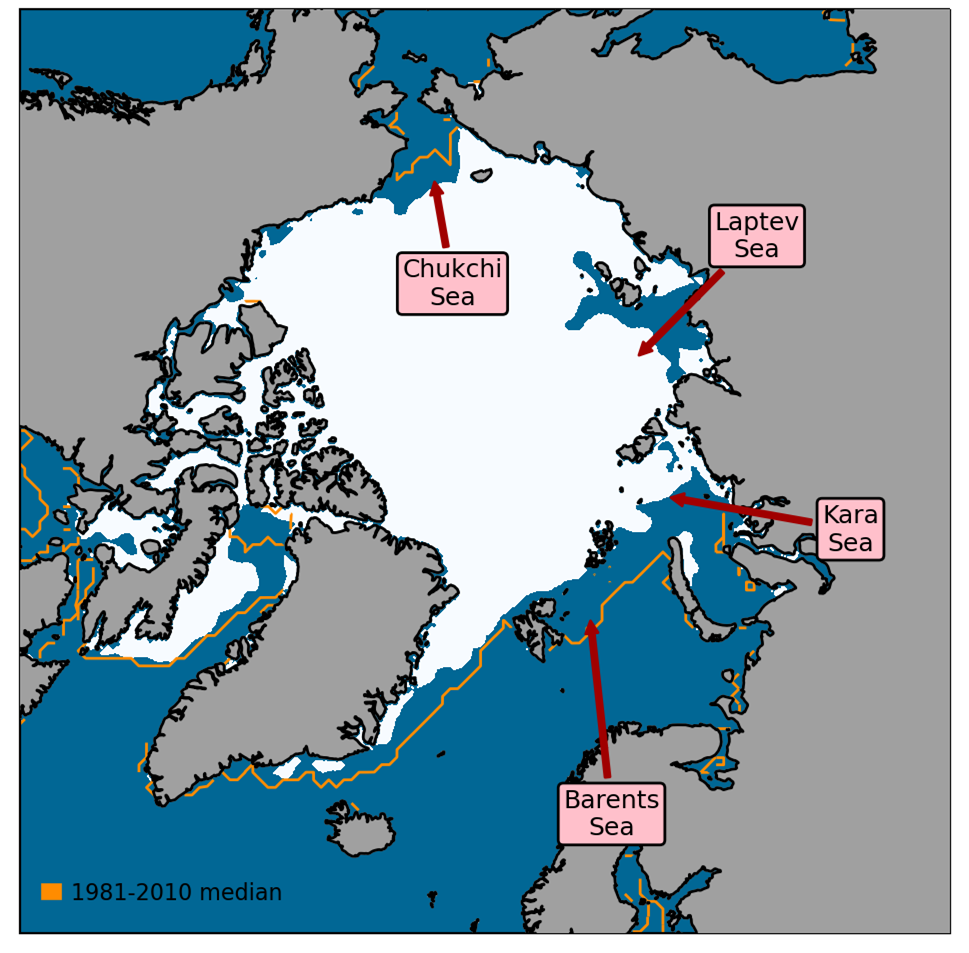
Figure 2. Arctic sea ice extent on 10th July 2022, with 1981-2010 average extent indicated in orange, and the regions referred to in the text labelled. Data are from EUMETSAT OSI SAF (Tonboe et al., 2017).
Arctic: June in context
The average Arctic sea ice extent for June 2022 was 10.92 million sq km. This was 0.93 million sq km below the 1981-2010 average and 0.17 million sq km above the long-term linear trend (Figure 3).
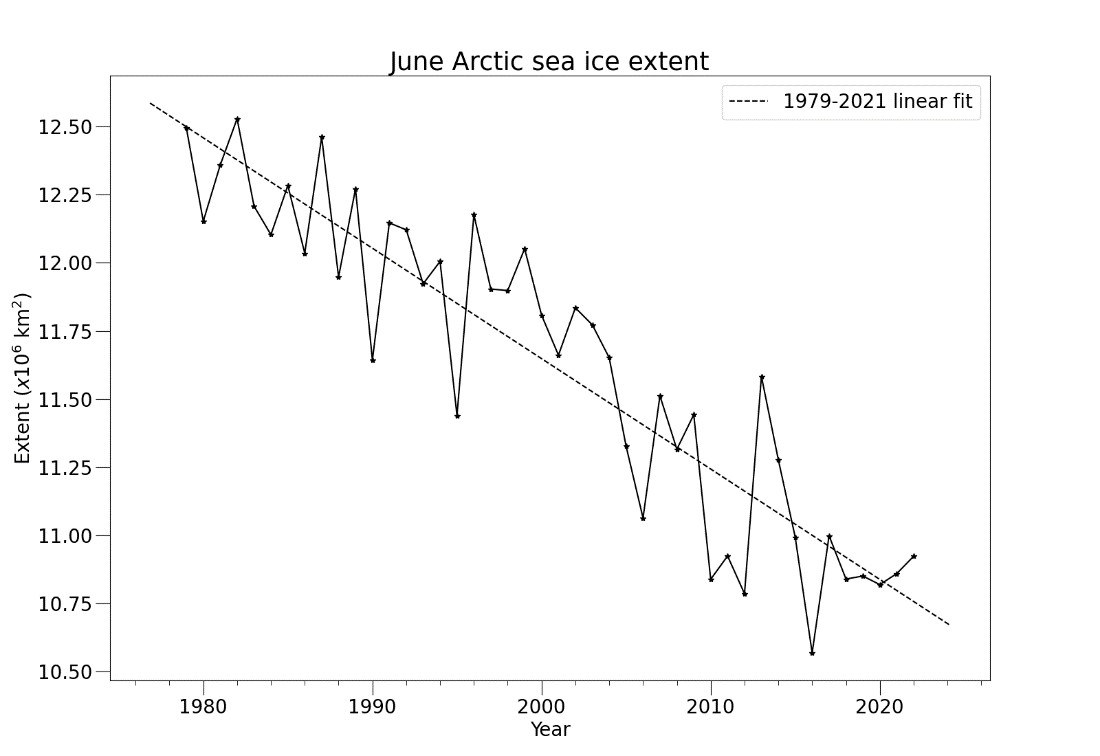
Figure 3. Average June Arctic sea ice extent according to the Hadley Centre Sea Ice and Sea Surface Temperature (HadISST) 1.2 dataset (Rayner et al., 2003).
The average rate of ice loss for June 2022 was 85,000 sq km per day. This was the 4th fastest rate of ice loss on record for this month (since 1979), substantially faster than the 1981-2010 average of 59,000 sq km per day, with only 2010, 2012 and 2014 having been faster.
Arctic weather during June saw strong contrasts between the first and second half of the month (Figure 4). The first half of June was dominated by a powerful high-pressure system, producing largely settled weather, across the Central Arctic and the Siberian coastal seas, with storms largely restricted to the Atlantic sector and the Beaufort Sea north of Alaska. This produced southerly winds, and higher than average temperatures, in the Siberian seas, but northerly winds, and colder than average temperatures in the Beaufort Sea. Consistent with this, ice loss during the first half of the month was concentrated in the seas north of Siberia.
In the second half of June, conditions became much stormier in the Central Arctic and the coastal Siberian seas, while a high pressure ridge built over the North American side of the Arctic. This effectively switched the temperature pattern, with the Beaufort Sea seeing warmer than average weather and development of melt ponds as seen in satellite images, while the Siberian coastal seas saw cooler temperatures and a slow-down in ice loss.
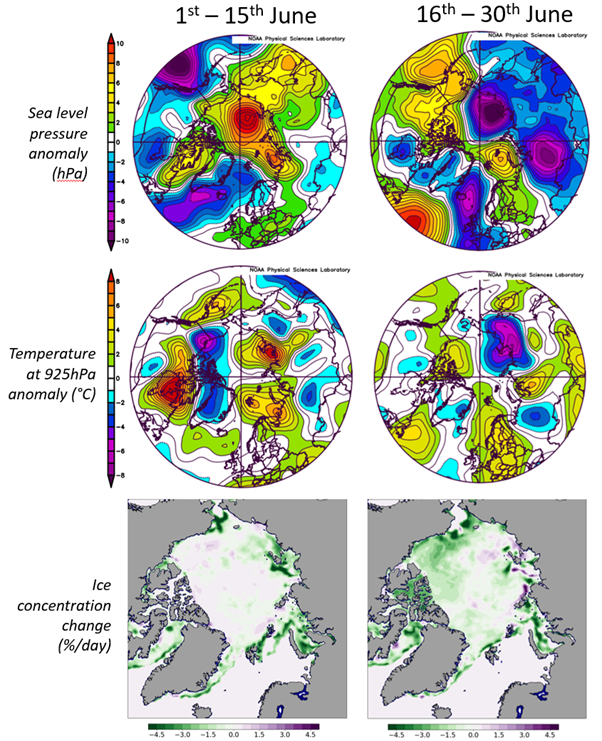
Figure 4. Arctic sea level pressure anomaly (top row), 925hPa temperature anomaly (middle row) and average daily ice loss (bottom row) from 1st-15th June (left column) and from 16th-30th June (right column). Anomalies are relative to the 1981-2010 average. Sea level pressure and temperature data are from the NCEP reanalysis (Kalnay et al., 1996). Ice concentration data are from EUMETSAT OSI SAF (Tonboe et al., 2017). Ice loss may be exaggerated at this time of year due to the formation of melt-ponds on the ice surface, which satellite sensors struggle to distinguish from open water.
Outlook for September
There is currently no heightened indication that 2022 will see a new record low Arctic sea ice extent at the seasonal minimum in September. However, uncertainty is considerable at this stage of the melt season and so a new record low remains possible. Indications are that this year’s September extent will nevertheless be well below the 1981-2010 average, likely among the 16 lowest recorded.
Each year, scientific centres around the world submit predictions of September Arctic sea ice extent to the Sea Ice Outlook (SIO), a series of reports published in June, July and August by the Sea Ice Prediction Network (SIPN). The first report of the summer was published on 27th June and comprises 37 predictions of September sea ice extent with a median of 4.57 million sq km, ranging from 3.41 to 5.20 million sq km (Figure 5). Only the lowest two predictions would represent new record lows for September sea ice extent, although for plenty of predictions the uncertainty ranges allow for the possibility of a new record low.
To supplement the SIO predictions, we use three different statistical methods to illustrate the range of September average sea ice extents that are likely given current data, also illustrated in Figure 5:
- An extrapolation of the 1979-2021 linear trend produces a September average extent of 4.13 ± 1.06 million sq km.
- There is some correlation between September average ice extent and average ice extent from 26th June – 10th July (the most recent 15 days of available data at the time of writing). Applying standard statistical methods to this relationship produces a September average extent of 4.64 ± 0.83 million sq km.
- Finally, we extrapolate the sea ice extent on 10th July by subtracting the daily melting rates observed in the years 2007-2021 from now until September. This method produces a range of September sea ice extents from 4.07 to 5.54 million sq km.
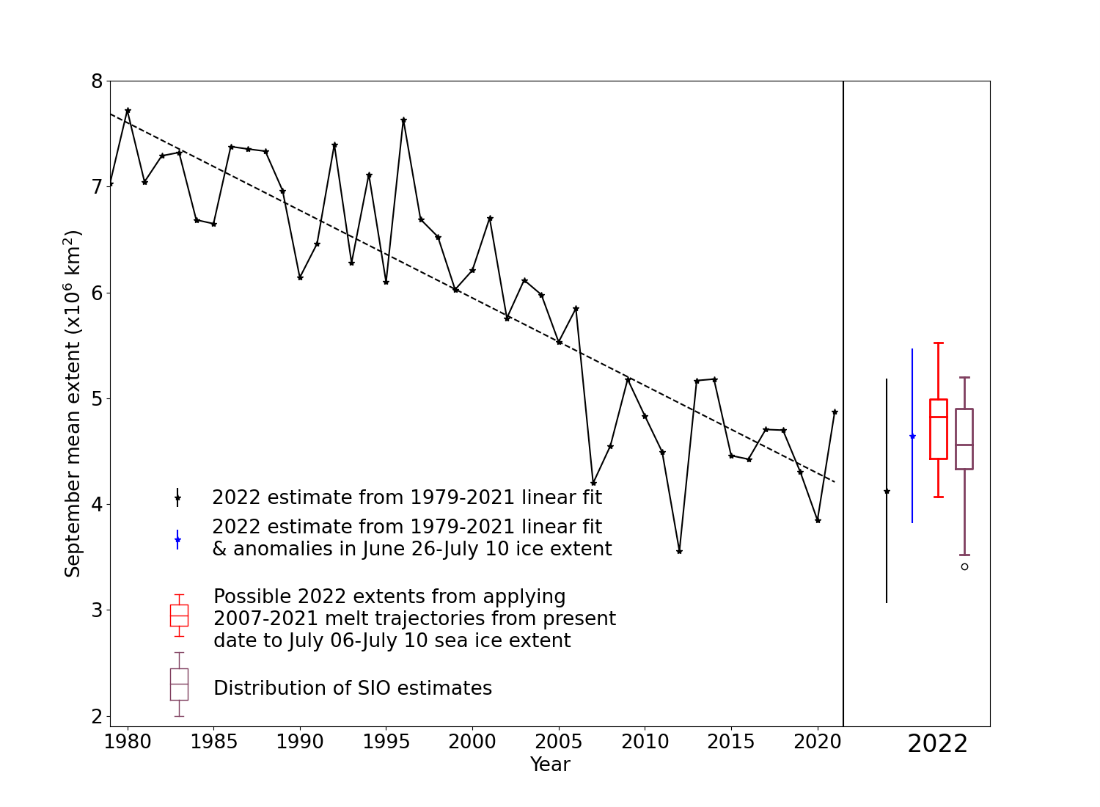
Figure 5. September Arctic sea ice extent since satellite records began in 1979 from the HadISST1.2 dataset (Rayner et al., 2003), with SIPN Sea Ice Outlook and statistical predictions for September 2022. For the statistical predictions derived from linear fit, error bars represent twice the standard deviation of September mean ice extent about the trend lines with respect to which the estimates are taken. The range of predictions derived from past melting trajectories is shown as a red boxplot indicating range, median and quartiles of estimates derived from each trajectory in the 2007-2021 period. The Sea Ice Outlook is shown as a purple boxplot indicating range, median and quartiles of the 37 predictions submitted.
Current Antarctic sea ice extent
Antarctic sea ice extent on 10th July 2022 was 14.53 million sq km. This was the lowest value on record for this date (in the satellite era since 1979), the next lowest having been 14.60 million sq km in 1986. It was 0.96 million sq km below the 1981-2010 average.
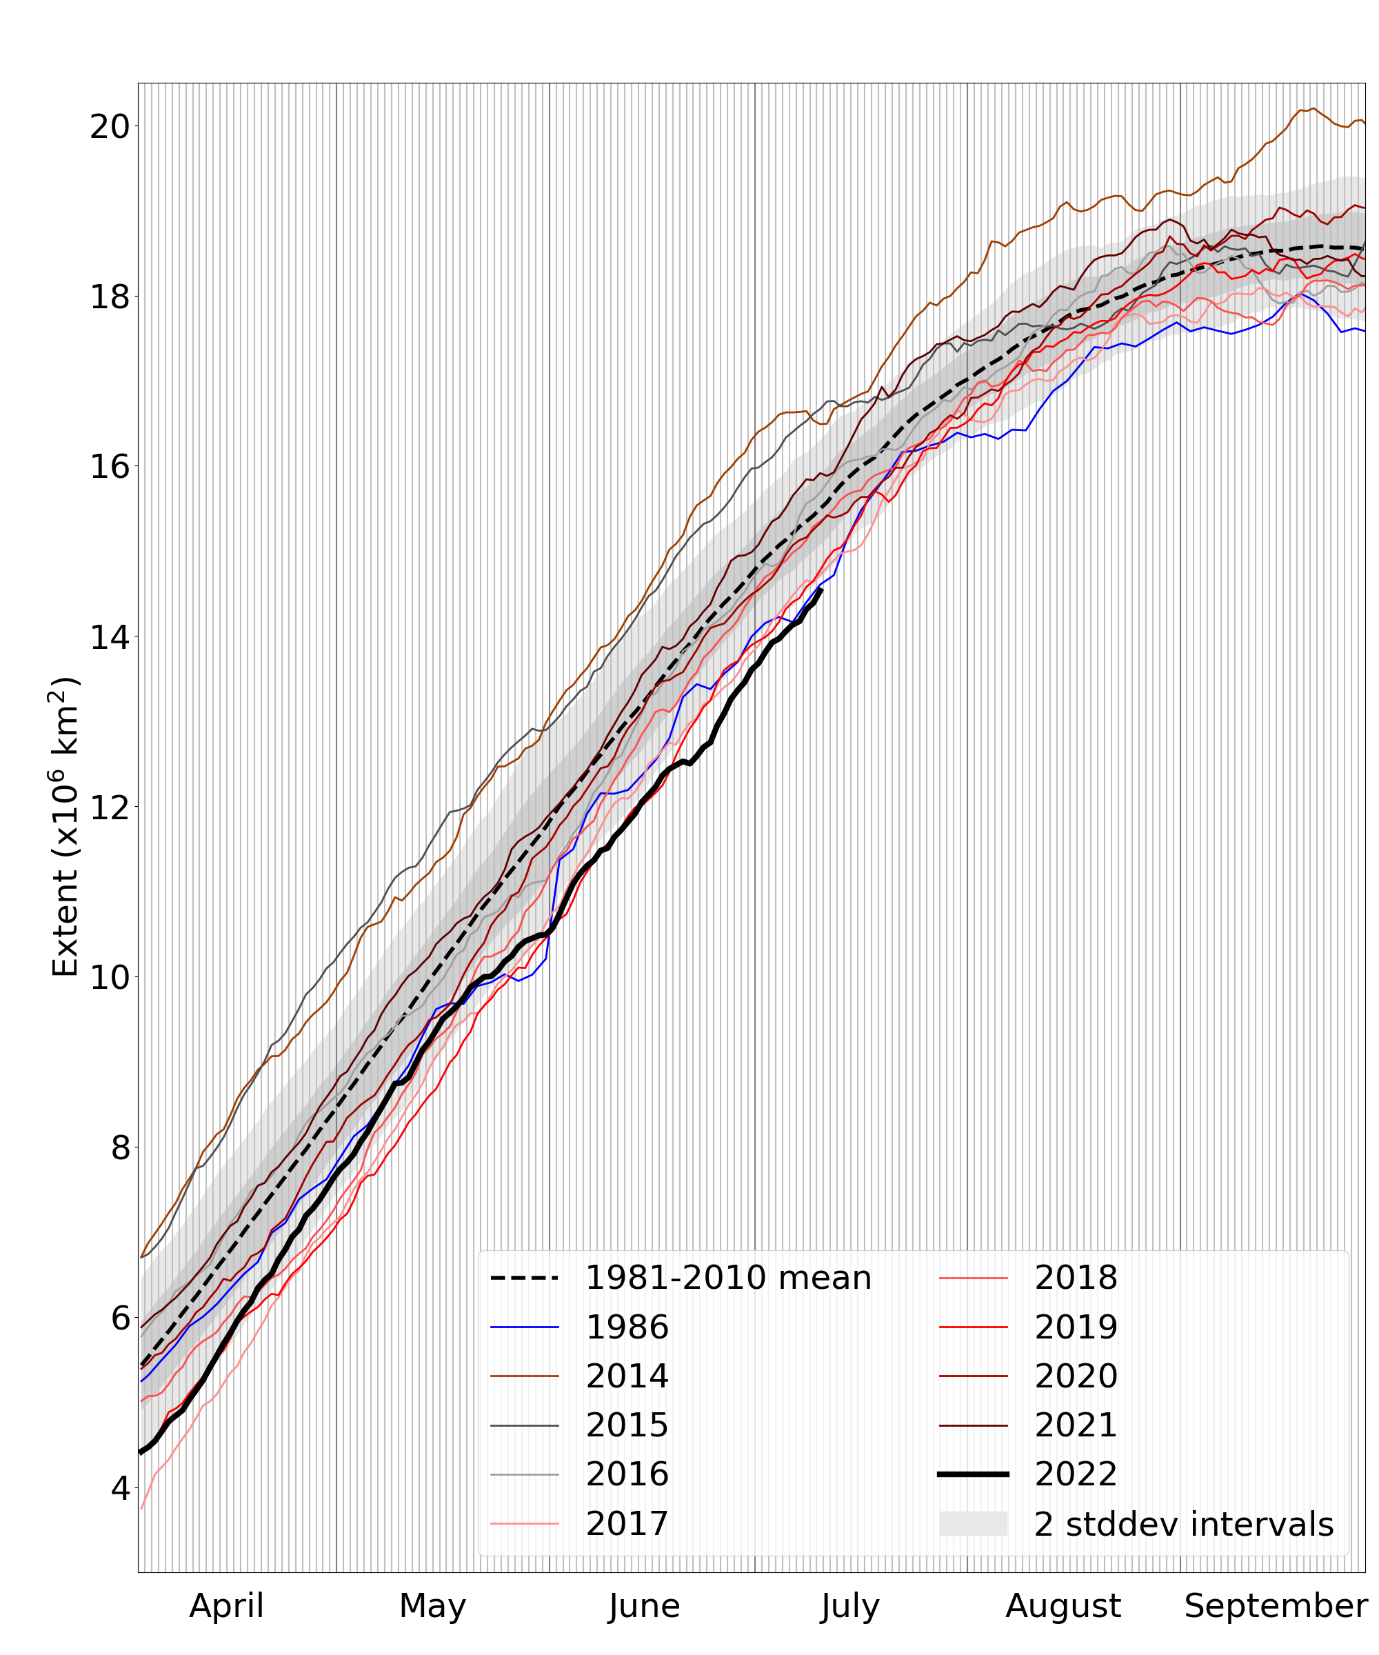
Figure 6. Daily Antarctic sea ice extent for 2022, compared with recent years and the 1981-2010 average, with ± 1 and 2 standard deviation intervals indicated by the shaded areas. Data are from NSIDC.
As was the case throughout June, areas of below-average extent were mainly to be found in the seas off West Antarctica (Amundsen, Bellingshausen and Weddell Seas). Extent was largely near-normal in the seas off East Antarctica, with the exception of a small region of below-average extent in the Indian Ocean sector.
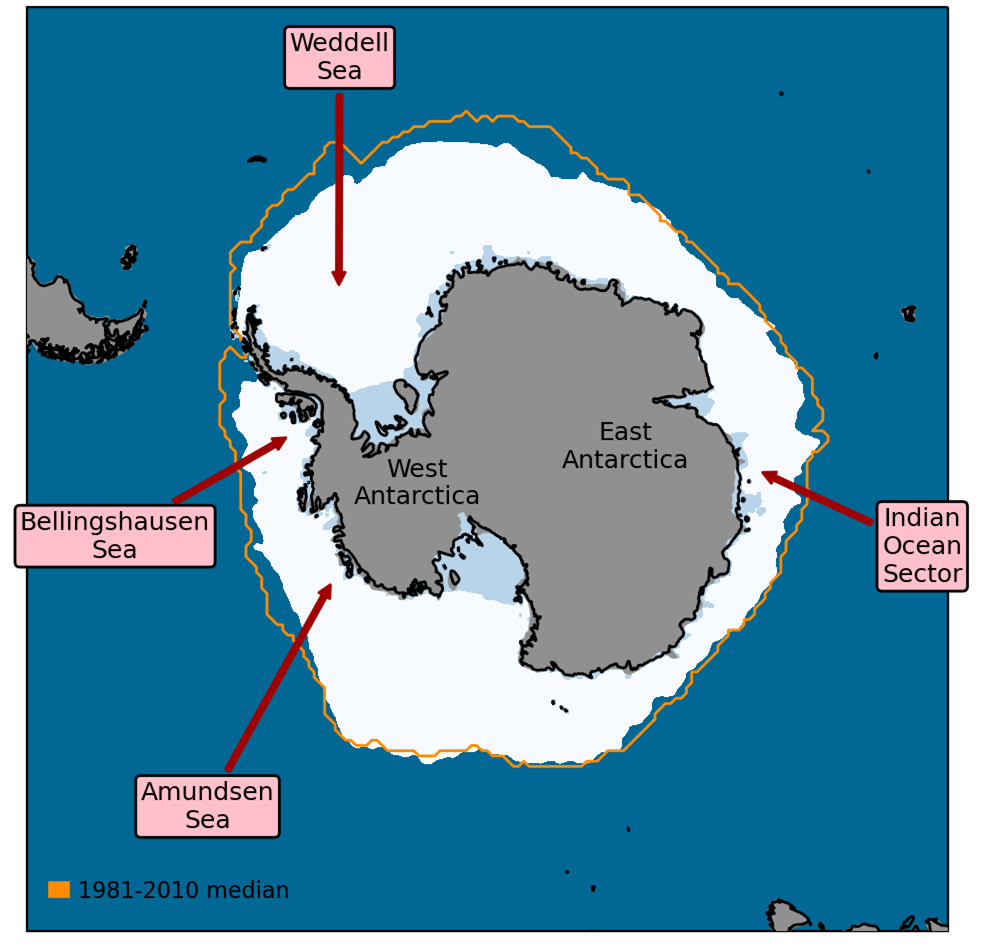
Figure 7. Antarctic sea ice extent on 10th July 2022, with 1981-2010 average extent indicated in orange, and the regions referred to in the text labelled. Data are from EUMETSAT OSI SAF (Tonboe et al., 2017).
References
Kalnay, E., and Coauthors (1996) The NCEP/NCAR 40-Year Reanalysis Project. Bull. Amer. Meteor. Soc., 77, 437–472, https://doi.org/10.1175/1520-0477(1996)077<0437:TNYRP>2.0.CO;2
Rayner, N.A., Parker, D.E., Horton, E.B., Folland, C.K., Alexander, L.V., Rowell, D.P., Kent, E.C. and Kaplan, A. (2003) Global analyses of sea surface temperature, sea ice, and night marine air temperature since the late nineteenth century. J. Geophys. Res. Atmos., 108, D14, 4407, https://doi.org/10.1029/2002JD002670
Tonboe, R., Lavelle, J., Pfeiffer, R.-H. and Howe, E. (2017) OSI SAF Global Sea Ice Concentration. Product OSI-401-b. Version 1.6. September 2017, Available at: https://osi-saf.eumetsat.int/products/osi-401-b