
Briefing on Arctic and Antarctic sea ice - June 2022
Alex West and Ed Blockley
Summary
- Arctic sea ice extent on 10th June was the 11th lowest on record for the time of year, following relatively slow ice loss during May.
- Areas of below average extent included the Barents, Laptev and Chukchi Seas.
- Winter 2021-22 was the joint-3rd mildest on record in the Arctic, with frequent mild southerly winds.
- However, data from CryoSat-2 and PIOMAS suggests that ice thickness is not unusually low by the standards of the past 10 years.
- Reliable predictions of September extent cannot be made at this point in the melt season. Statistical predictions based on daily extent achieve some skill by mid-July.
- Antarctic sea ice set a new record minimum in austral Summer 2021-22, the previous record low having been set in March 2017. This was likely partly caused by unusually low pressure around Antarctica blowing sea ice away from the continent into warmer waters.
- As of 10th June, Antarctic sea ice extent remains very low for the time of year, equal-lowest with 2019.
Current Arctic sea ice state
Arctic sea ice extent on 10th June was 11.32 million sq km. This was 0.75 million sq km below the 1981-2010 average and was the 11th lowest on record for this date (Figure 1).
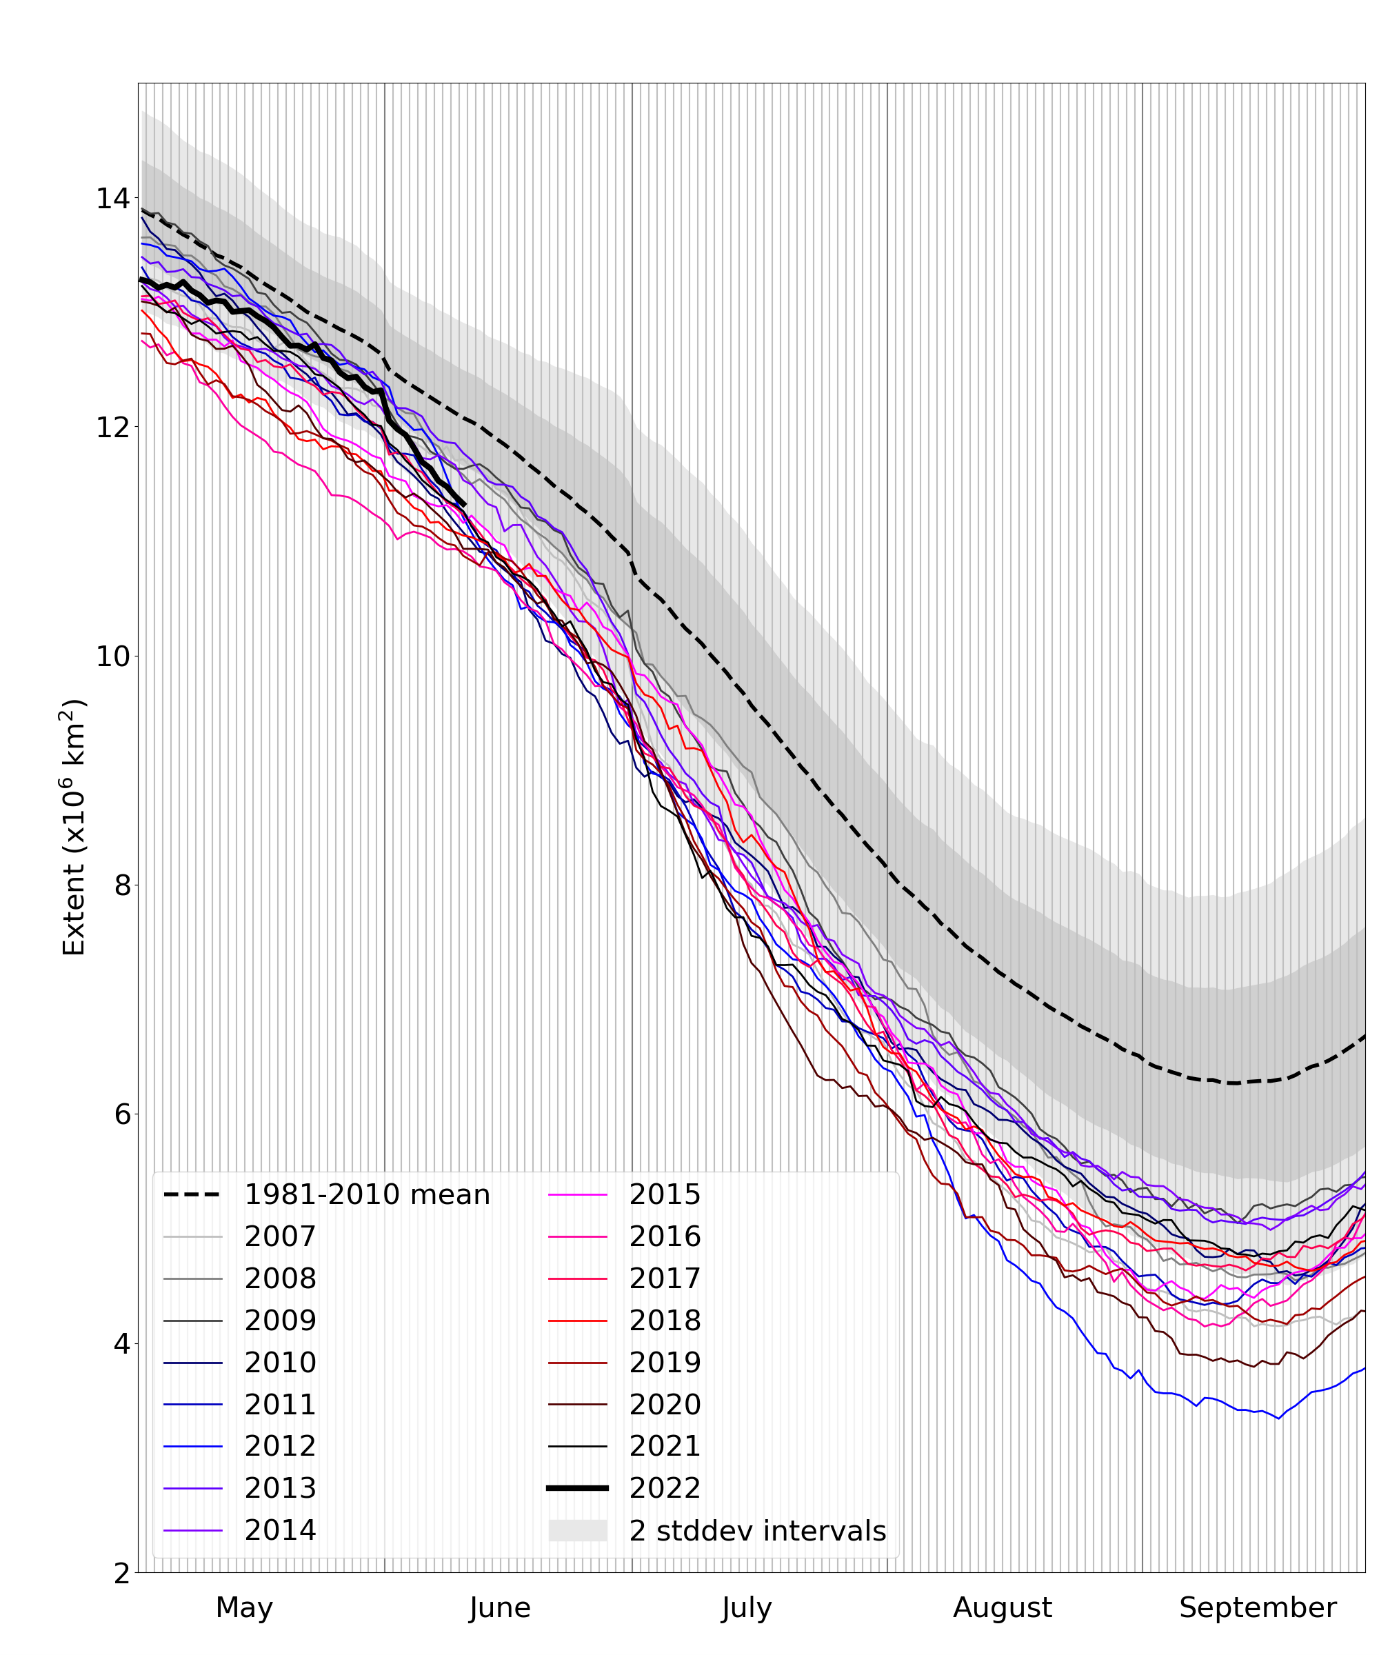
Figure 1. Daily Arctic sea ice extent for 2022, compared with recent years and the 1981-2010 average with ± 1 and 2 standard deviation intervals indicated by the shaded areas. Data are from the National Snow and Ice Data Center (NSIDC).
Extent was well below average in the Barents Sea, and slightly below average in the Laptev and Chukchi Seas, where melting had already commenced (Figure 2).
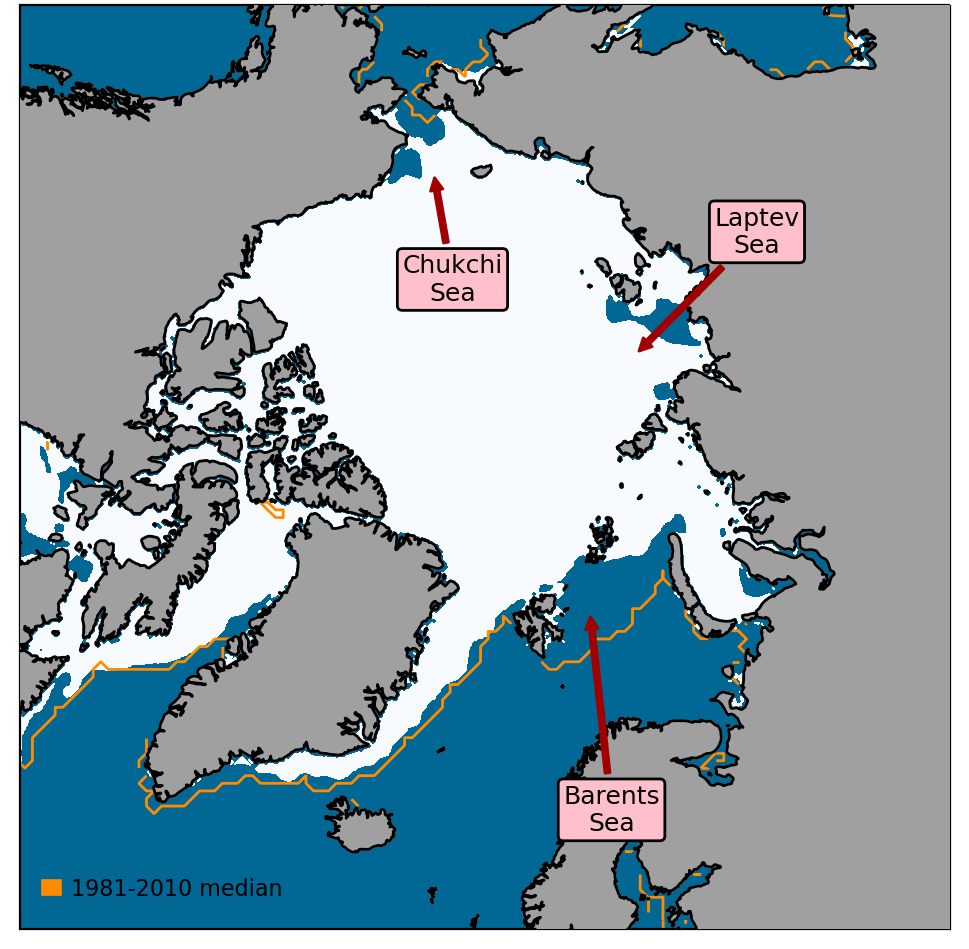
Figure 2. Arctic sea ice extent on 10th June 2022, with 1981-2010 average extent indicated in orange, and the regions referred to in the text labelled. Data are from EUMETSAT OSI SAF (Tonboe et al., 2017).
May 2022 in context
Average Arctic sea ice extent for May 2022 was 13.00 million sq km according to the HadISST 1.2 dataset (Rayner et al., 2003). This was 0.35 million sq km below the 1981-2010 average, but 0.51 million sq km above the long-term linear trend (Figure 3).
The average rate of ice loss during May was 41,000 sq km per day, somewhat slower than the 1981-2010 average of 47,000 sq km per day, and the 10th slowest rate of ice loss observed in May during the satellite era.
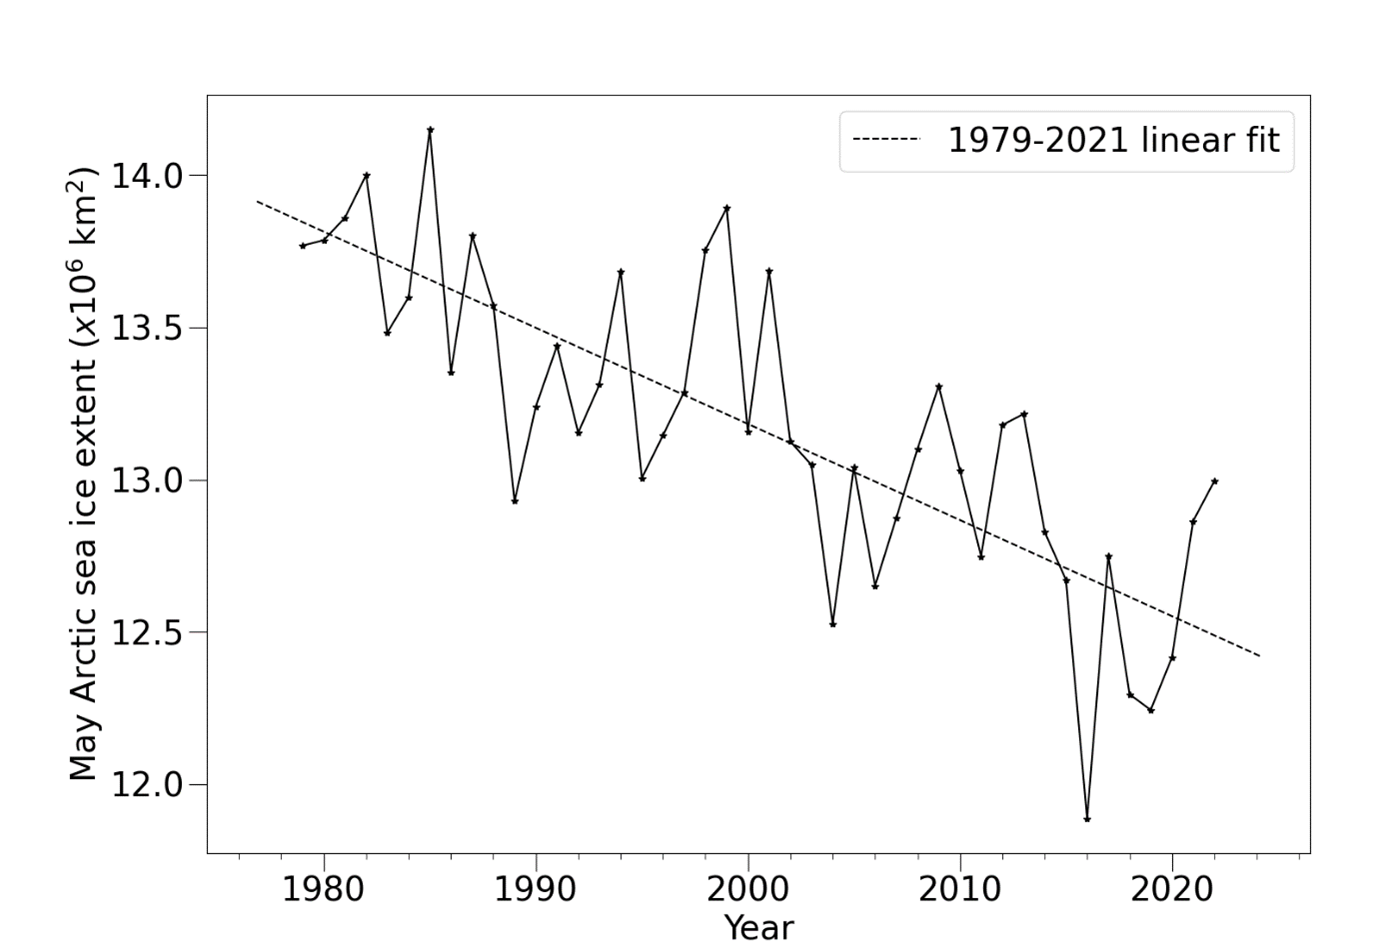
Figure 3. Average May Arctic sea ice extent according to the HadISST 1.2 dataset (Rayner et al., 2003).
Review of sea ice and Arctic weather during winter 2021-22
Winter 2021-22 in the Arctic was relatively very mild. According to average November-March temperatures north of 70°N at 925hPa (about 1km high in the atmosphere), it was the joint-3rd mildest winter on record, with only the winters of 2017-18 and 2015-16 having been warmer (Figure 4). The winter was 2.8°C above the 1981-2010 average. Temperatures were particularly mild relative to normal in a region stretching from the north-eastern Beaufort Sea to the North Pole (Figure 5a). The winter was dominated by meridional circulation patterns, in which air tends to be exchanged north-south, rather than east-west. These circulation patterns are associated with enhanced heat transport into the Arctic from midlatitudes and is consistent with a very mild winter for the Arctic.
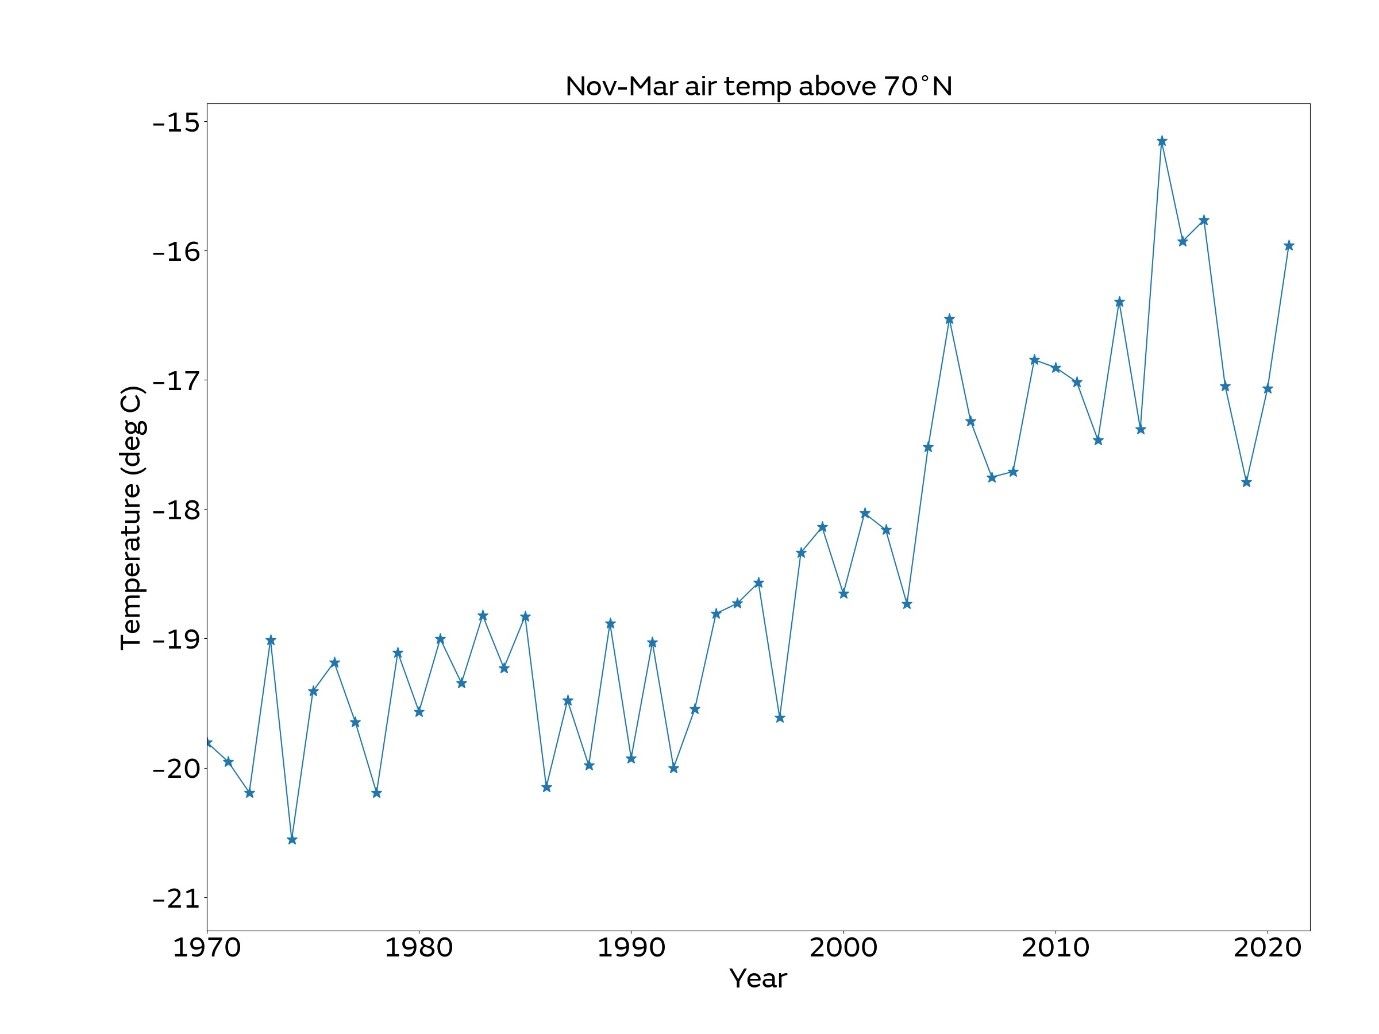
Figure 4. Average November-March air temperature (°C) at 925 hPa for the region north of 70 °N from 1970-present, according to the NCEP reanalysis (Kalnay et al., 1996).
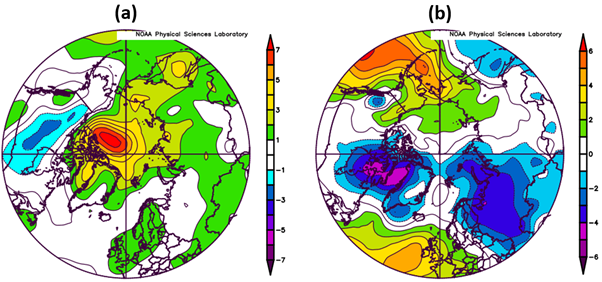
Figure 5. Near-surface meteorological conditions for November 2021 – March 2022 relative to the 1981-2010 long-term average: (a) 925hPa air temperature anomaly (°C); mean sea level pressure anomaly (hPa). Data are from the NCEP reanalysis (Kalnay et al., 1996).
In April, the weather became more anticyclonic (settled) in the Arctic, and circulation patterns became more zonal (less air exchange with lower latitudes), although temperatures remained mild relative to normal. During May however, temperatures were closer to normal across much of the Central Arctic, and Arctic weather became much stormier and more cyclonic. This is consistent with the relatively muted rate of sea ice loss observed in May, and with the current sea ice extent not being notably low.
Sea ice thickness at the end of winter is an important indicator of the state of the ice, as thicker ice is less likely to melt out in the summer. There is no continuous record of Arctic-wide ice thickness data (unlike for ice concentration) but since 2011 the CryoSat-2 radar altimetry sensor has provided estimates of ice thickness throughout the Arctic winter (Tilling et al., 2018). In March 2022, CryoSat-2 estimated ice thickness to be substantially higher than the 2011-2021 average across most of the Central Arctic, Beaufort Sea and East Siberian Sea, with particularly high values between the North Pole and Fram Strait (Figure 6a). However, in the Chukchi Sea and the region north of Greenland, ice thickness was lower than average.
Another useful tool for estimating sea ice thickness is the PIOMAS forced ice-ocean model (Schweiger et al., 2011), which has been found to compare well to satellite measurements of sea ice from CryoSat-2 and a previous satellite sensor, ICESat. PIOMAS gives a more equivocal assessment of sea ice thickness anomaly relative to 2011-2021, with regions of above-average thickness covering a lower area of the Arctic (Figure 6b); the ‘stripe’ of very thick ice between the North Pole and Fram Strait is absent. There is notable disagreement between the two sources north of the Canadian Archipelago and in the Kara Sea, where each exhibits opposite anomalies.
In summary, it is likely that ice thickness at the end of winter 2022 was not particularly low by the standards of recent years and may indeed have been relatively high in parts of the Central Arctic. However, uncertainty is substantial. Given the very mild weather during winter, at least part of the apparently higher ice thickness may be associated with the relatively muted ice melt of the preceding summer.
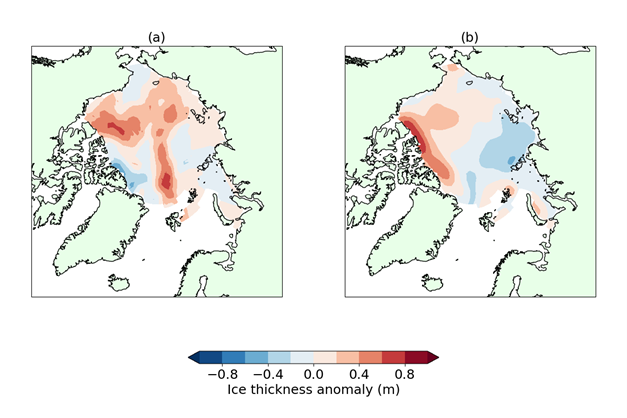
Figure 6. Arctic sea ice thickness anomaly for March 2022, compared to the 2011-2021 average, from (a) CryoSat-2 radar altimetry, (b) PIOMAS forced ice-ocean model.
Outlook for September
There is no significant correlation between ice extent in mid-June and the seasonal minimum extent in September, as the severity of melt is heavily dependent on Arctic weather conditions over the summer. Statistical predictions based on daily ice extent only start to achieve some skill by mid-July. Hence it is not possible to predict September sea ice extent with any confidence at this point in the season.
Antarctic sea ice state
Antarctic sea ice recorded its lowest ever minimum annual ice extent in austral summer 2021-22, at 1.92 million sq km on 25th February 2022 (Figure 7). This was 0.19 million sq km lower than the previous lowest minimum, which occurred in 2017. In contrast, the highest minimum in the satellite era was recorded as recently as 2015, underlining that Antarctic sea ice extent remains highly variable.
The low sea ice extent of summer 2021-22 may have been partly influenced by a strong positive phase of the Southern Annular Mode (SAM), in which pressure was unusually low over the Antarctic continent, causing stronger westerly winds over the Southern Ocean, blowing sea ice away from the coast towards warmer waters.
As of 10th June 2022, Antarctic sea ice extent remained at very low levels for the time of year (Figure 7). Extent was 11.64 million sq km, the joint-lowest on record for this date (equal with 2019), and 1.17 million sq km below the 1981-2010 average. Extent was much lower than average in the Amundsen, Bellingshausen and Weddell Seas around West Antarctica, but near-average in the seas surrounding East Antarctica (Figure 8).
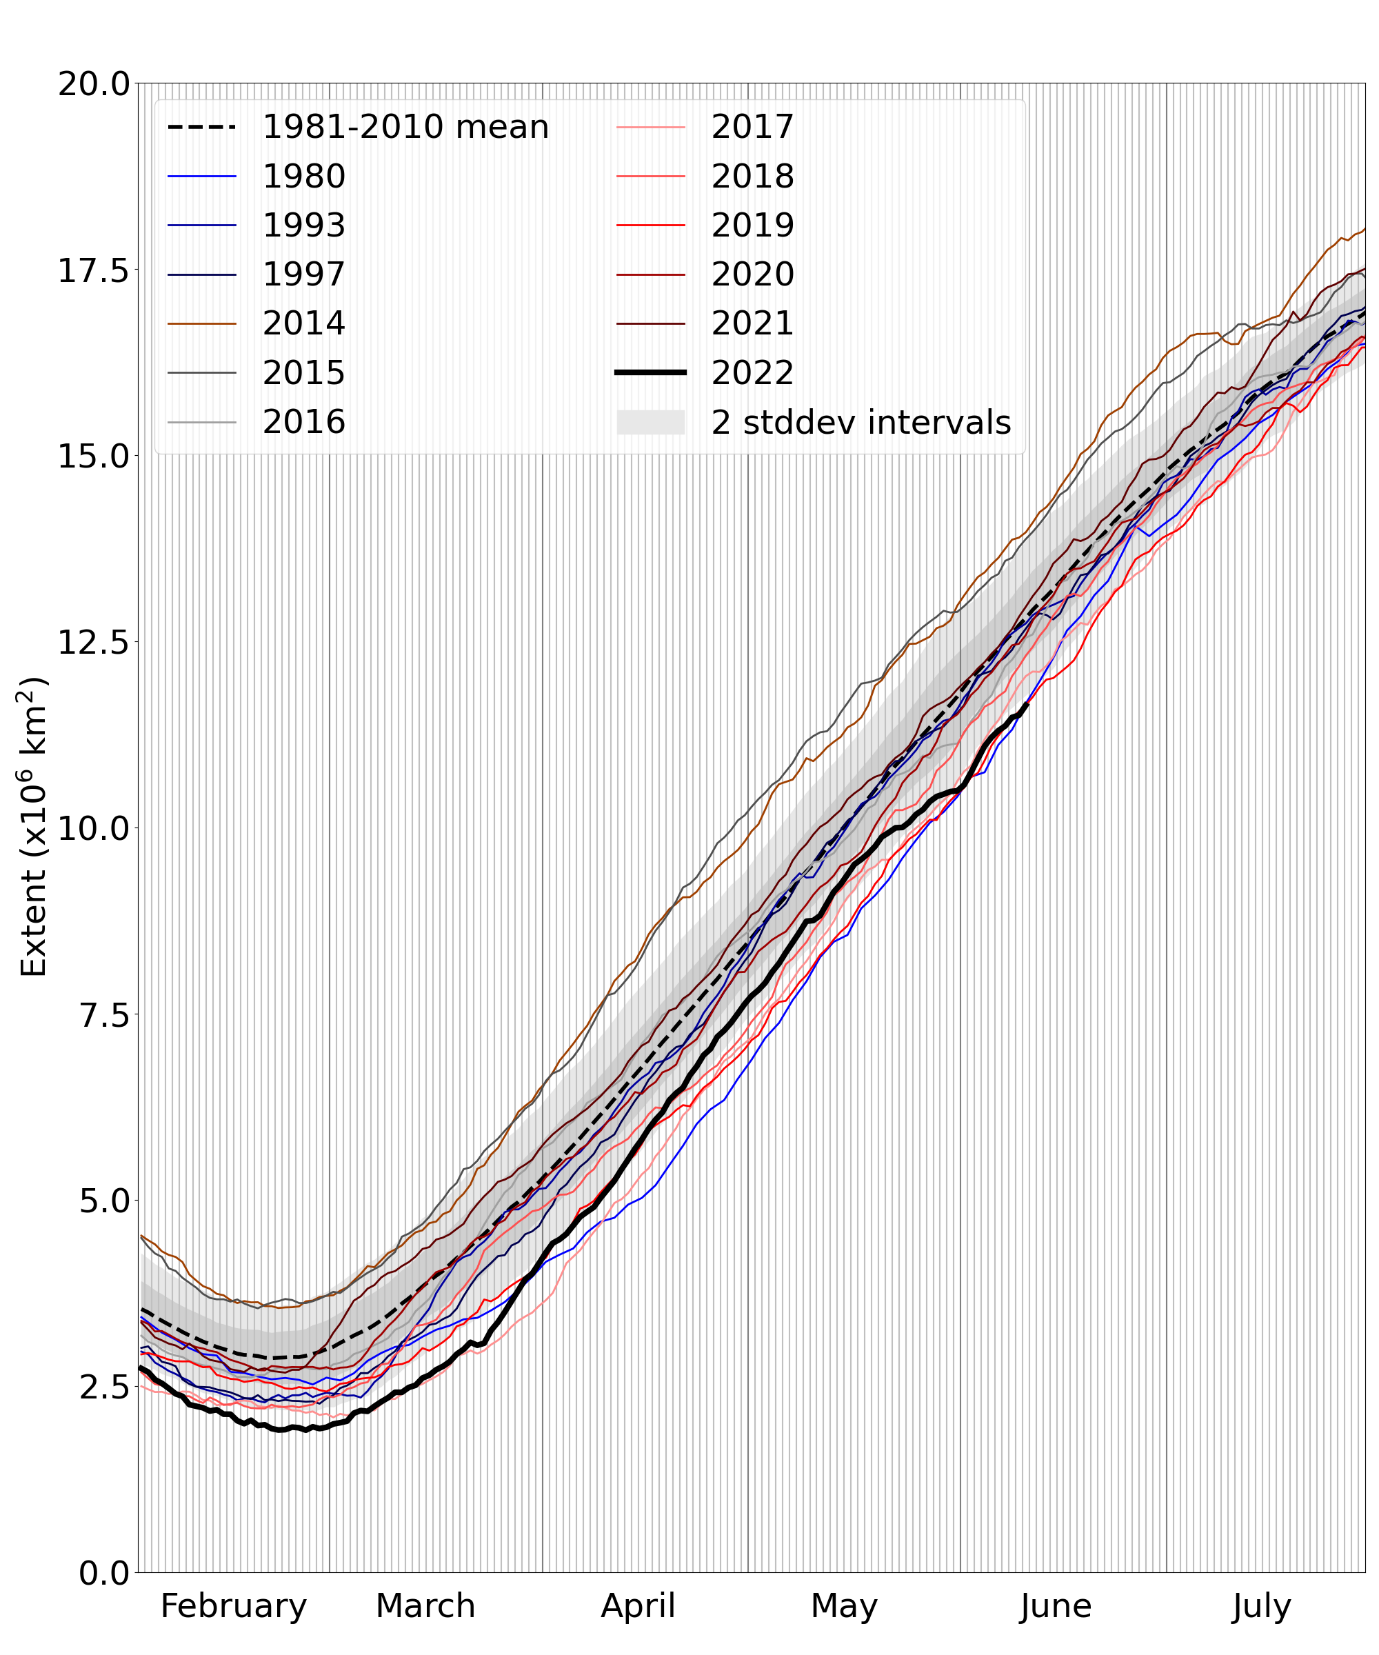
Figure 7. Daily Antarctic sea ice extent for 2022, compared with recent years and the low ice years of 1980, 1993 and 1997. Also shown is the 1981-2010 average with ± 1 and 2 standard deviation intervals indicated by the shaded areas. Data are from the National Snow and Ice Data Center (NSIDC).
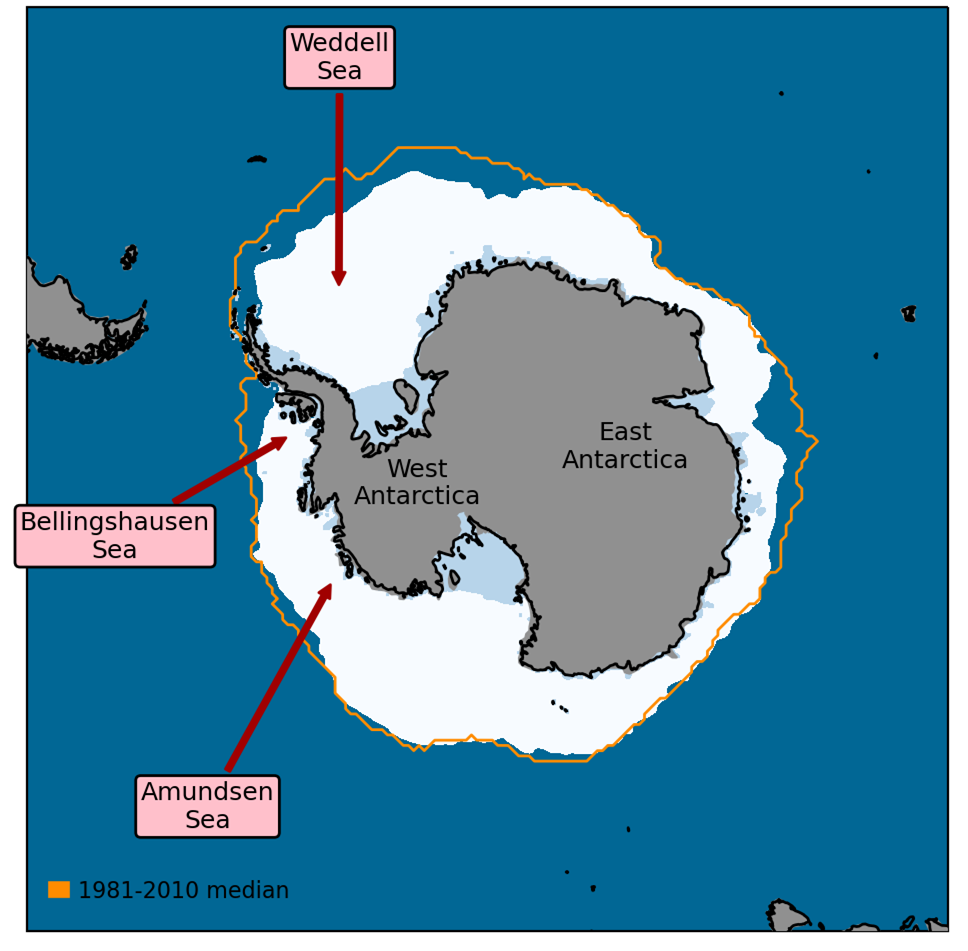
Figure 8. Antarctic sea ice extent on 10th June 2022, with 1981-2010 average extent indicated in orange, and with regions referred to in the text labelled. Data are from EUMETSAT OSI SAF (Tonboe et al., 2017).
References
Kalnay, E., and Coauthors (1996) The NCEP/NCAR 40-Year Reanalysis Project. Bull. Amer. Meteor. Soc., 77, 437–472, https://doi.org/10.1175/1520-0477(1996)077<0437:TNYRP>2.0.CO;2
Rayner, N.A., Parker, D.E., Horton, E.B., Folland, C.K., Alexander, L.V., Rowell, D.P., Kent, E.C. and Kaplan, A. (2003) Global analyses of sea surface temperature, sea ice, and night marine air temperature since the late nineteenth century. J. Geophys. Res. Atmos., 108, D14, 4407, https://doi.org/10.1029/2002JD002670
Schweiger, A., Lindsay, R., Zhang, J., Steele, M., Stern, H. and Kwok, R. (2011) Uncertainty of modelled arctic sea ice volume. J. Geophys. Res. Oceans, 116, C00D06, https://doi.org/10.1029/2011JC007084
Tilling, R.L., Ridout, A. and Shepherd, A. (2018) Estimating Arctic sea ice thickness and volume using CryoSat-2 radar altimeter data, Adv. Space Res., 62, 6, Pages 1203–1225, https://doi.org/10.1016/j.asr.2017.10.051
Tonboe, R., Lavelle, J., Pfeiffer, R.-H. and Howe, E. (2017) OSI SAF Global Sea Ice Concentration. Product OSI-401-b. Version 1.6. September 2017, Available at: https://osi-saf.eumetsat.int/products/osi-401-b