
Briefing on Arctic and Antarctic sea ice - July 2023
Alex West and Ed Blockley
Summary
- Arctic sea ice extent is currently 13th lowest on record for the time of year; extent is particularly low in the Beaufort, Barents and Kara Seas.
- June was a largely cyclonic month in the Arctic, but with frequent intrusions of warm air, particularly in the Beaufort and Laptev Seas.
- Uncertainty in September sea ice extent is still very high at this point in the season.
- Antarctic sea ice extent remains exceptionally low and has been record low by a very wide margin since late May.
- Extent is very low across the whole Southern Ocean except for the Amundsen Sea where it is slightly higher than average.
Current Arctic sea ice extent
Arctic sea ice extent on 9th July 2023 was 8.91 million sq km. This was 1.19 million sq km below the 1981-2010 average and was the 13th lowest value in the satellite record (since 1979) for the date (Figure 1).
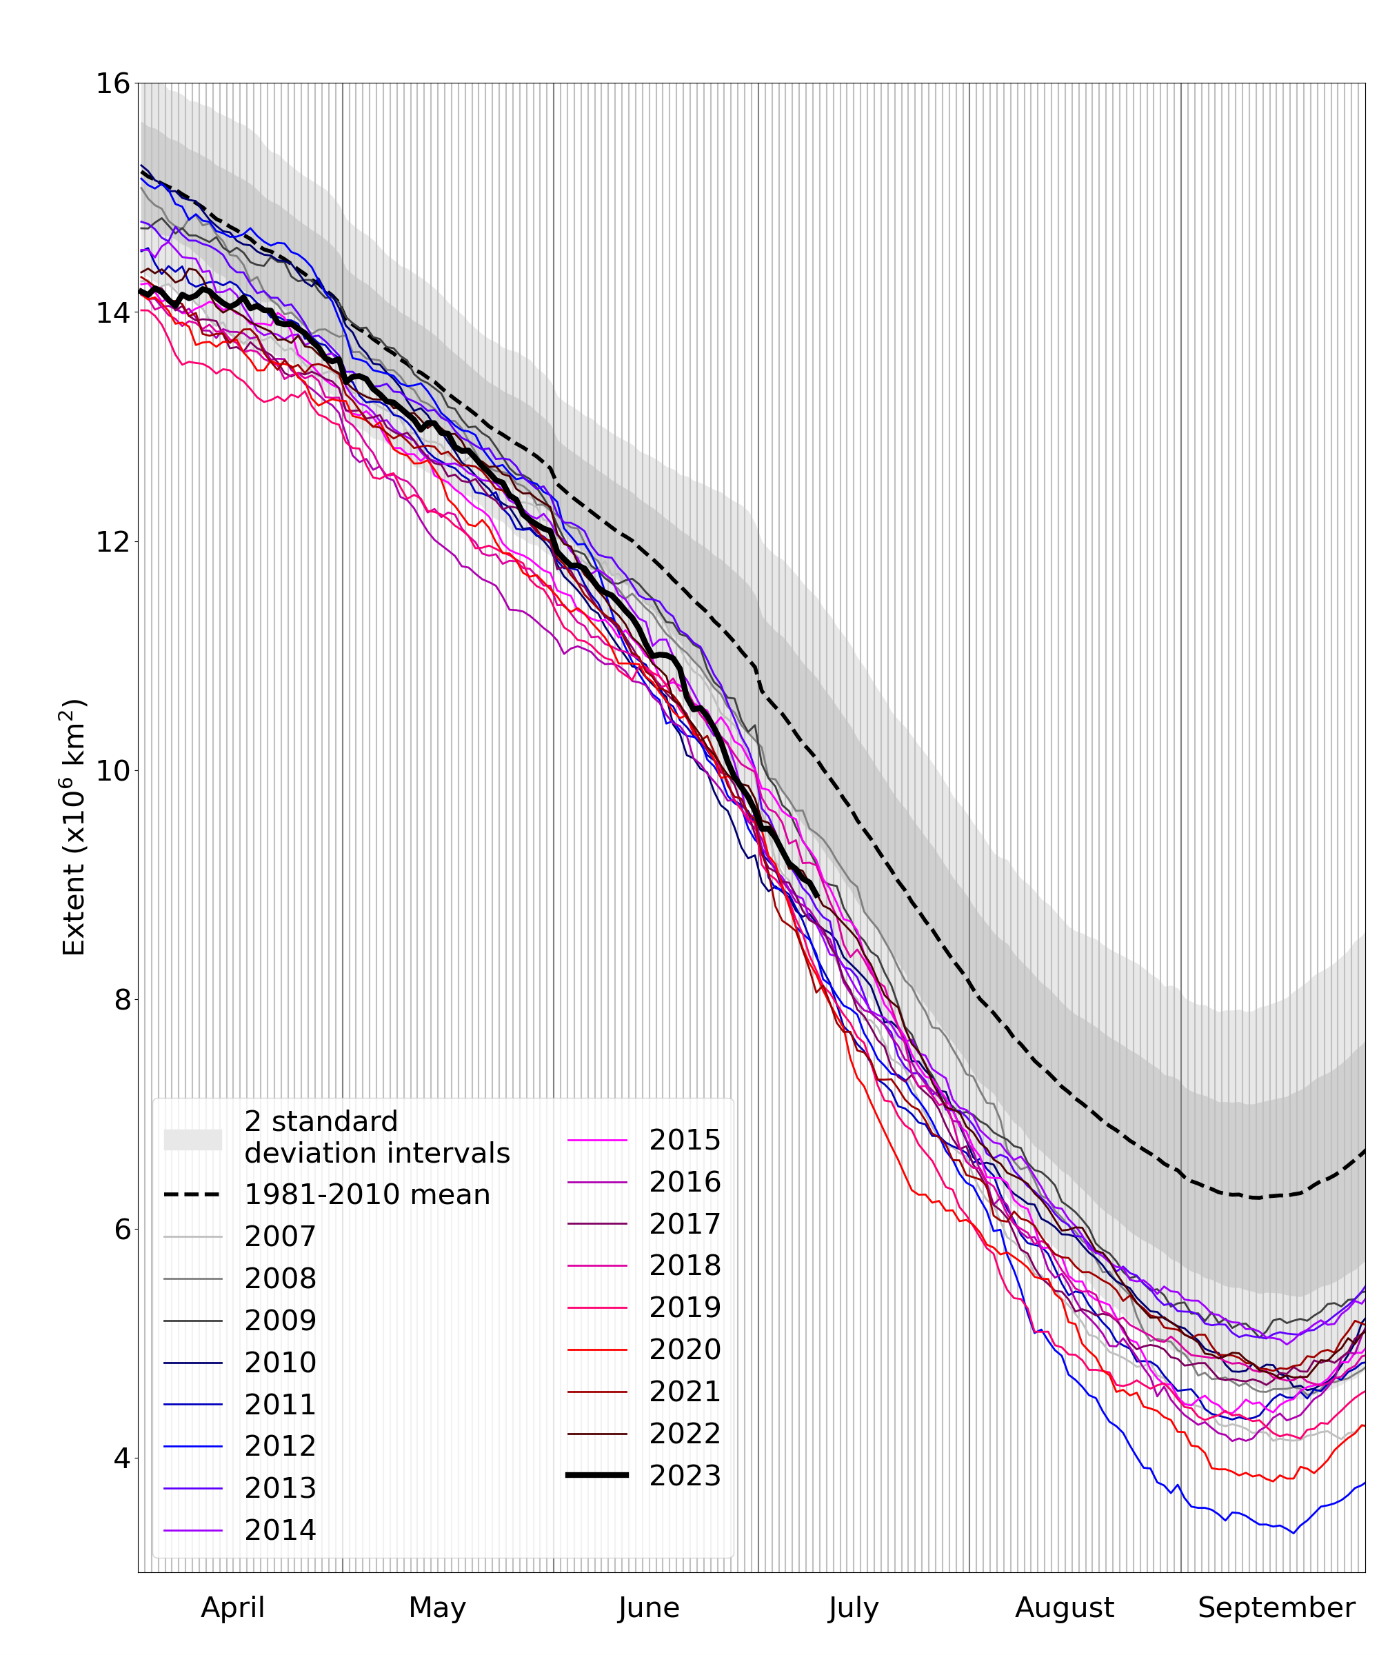
Figure 1. Daily Arctic sea ice extent for 2023, compared with recent years and the 1981-2010 average with ± 1 and 2 standard deviation intervals indicated by the shaded areas. Data are from the National Snow and Ice Data Center (NSIDC).
Extent was well below average in the Beaufort Sea, where melting began very early, in mid-June (Figure 2). It was also well below average in the Barents and Kara Seas bordering the Atlantic Ocean. Extent was somewhat below average in the Laptev and East Siberian Seas, where melting began shortly before the end of June.
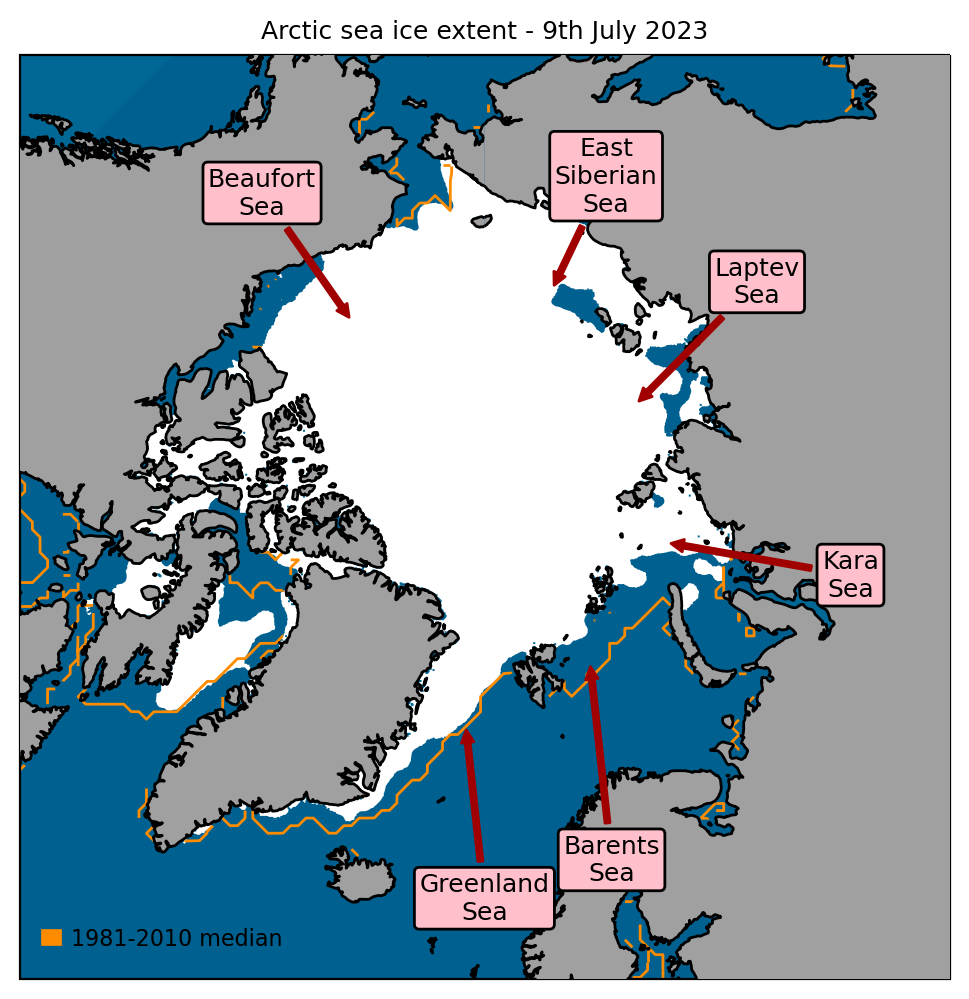
Figure 2. Arctic sea ice extent on 9th July 2023, with 1981-2010 average extent indicated in orange, and the regions referred to in the text labelled. Data are from EUMETSAT OSI SAF (Tonboe et al., 2017).
Arctic: June in context
Average sea ice extent for June 2023 was 10.96 million sq km according to the NSIDC Sea Ice Index (Fetterer et al., 2017). This was the 13th lowest June extent in the satellite record. It was 0.80 million sq km below average, but 0.46 million sq km above the long-term linear trend (Figure 3).
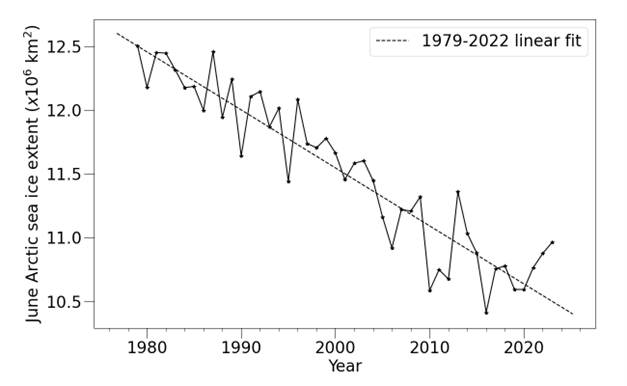
Figure 3. Average June Arctic sea ice extent according to the NSIDC Sea Ice Index (Fetterer et al., 2017).
June was an unsettled, stormy month in the Arctic Ocean (Figure 4a), continuing a period of stormy conditions that began in late spring. Temperatures across most of the ocean were near average (Figure 4b). However, there was frequent movement of warmer air into particular areas of the Arctic Ocean, indicated by red arrows on Figure 4, to the west of three persistent high-pressure ridges reaching up from midlatitudes. The areas most affected were the Beaufort, Laptev, and Greenland Seas, coinciding with areas in which sea ice loss was above average during June (Figure 4c).
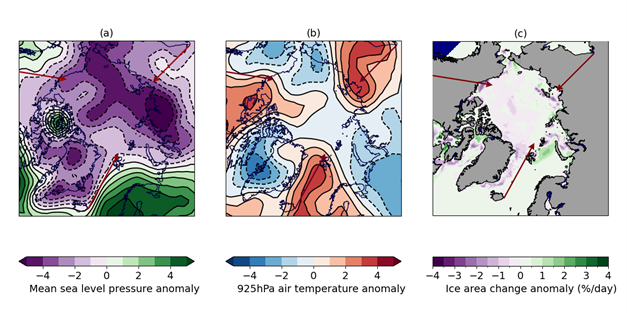
Figure 4. June 2023 anomaly relative to the 1981-2010 average in (a) sea level pressure; (b) 925hPa temperature; (c) average daily ice loss. Sea level pressure and temperature data are from the NCEP reanalysis (Kalnay et al., 1996). Ice concentration data are from EUMETSAT OSI SAF (Tonboe et al., 2017). Ice loss may be exaggerated at this time of year due to the formation of melt-ponds on the ice surface, which satellite sensors struggle to distinguish from open water. Areas of notable warm air movement during June are indicated on all panels with dark red arrows.
Outlook for September
Uncertainty in September sea ice extent is still very high at this point in the melt season, with Arctic weather exerting a powerful, and unpredictable, influence over the rate of melt during the rest of the summer. At the time of writing, while there is no indication of a heightened likelihood of a record low September sea ice extent, this remains a possibility. It is very likely that this year will see a continuation of the post-2007 sea ice conditions, whereby every year since 2007 (inclusive) has recorded a September extent lower than every year before 2007.
Each year, scientific centres around the world submit predictions of September Arctic sea ice extent to the Sea Ice Outlook (SIO), a series of reports published in June, July and August by the Sea Ice Prediction Network (SIPN). The first report of the summer was published on 23rd June and comprises 38 predictions of September sea ice extent, with a median of 4.54 million sq km. The range of predictions is very high: 2.95 to 5.6 million sq km (Figure 5). Only the lowest prediction would represent a new record low September sea ice extent, although plenty of predictions have uncertainty ranges that include this possibility. All SIO predictions, except the very highest, predict a September extent below the range of the pre-2007 climate.
To supplement the SIO predictions, we use three different statistical methods to illustrate the range of September average sea ice extents that are likely given current data, also illustrated in Figure 5:
- An extrapolation of the 1979-2022 linear trend produces a September average extent of 4.19 ± 1.04 million sq km.
- There is some correlation between September average ice extent and average ice extent from 25th June – 9th July (the most recent 15 days of available data at the time of writing). Applying standard statistical methods to this relationship produces a September average extent of 4.73 ± 0.82 million sq km. This is consistent with a September extent in the range 2nd – 18th lowest.
- Finally, we extrapolate the sea ice extent on 9th July by subtracting the daily melting rates observed in the years 2007-2022 from now until September. This method produces a range of September sea ice extents from 4.17 to 5.62 million sq km, consistent with a September extent in the range 3rd – 18th lowest.
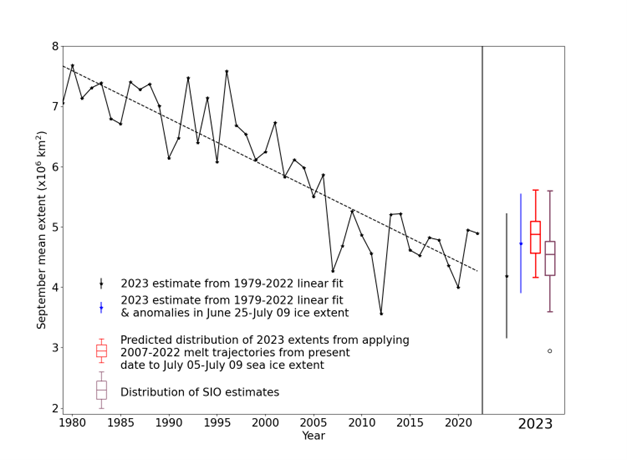
Figure 5. September Arctic sea ice extent since satellite records began in 1979 from the NSIDC Sea Ice Index (Fetterer et al., 2017), with SIPN Sea Ice Outlook and statistical predictions for September 2023. For the statistical predictions derived from linear fit, error bars represent twice the standard deviation of September mean ice extent about the trend lines with respect to which the estimates are taken. The range of predictions derived from past melting trajectories is shown as a red boxplot indicating range, median and quartiles of estimates derived from each trajectory in the 2007-2022 period. The Sea Ice Outlook is shown as a purple boxplot indicating range, median and quartiles of the 38 predictions submitted.
Current Antarctic sea ice extent
Antarctic sea ice extent on 9th July 2023 was 12.85 million sq km. This was the lowest extent on record for the time of year, the next lowest having been 14.46 in 2022. It was 2.56 million sq km below the 1981-2010 average.
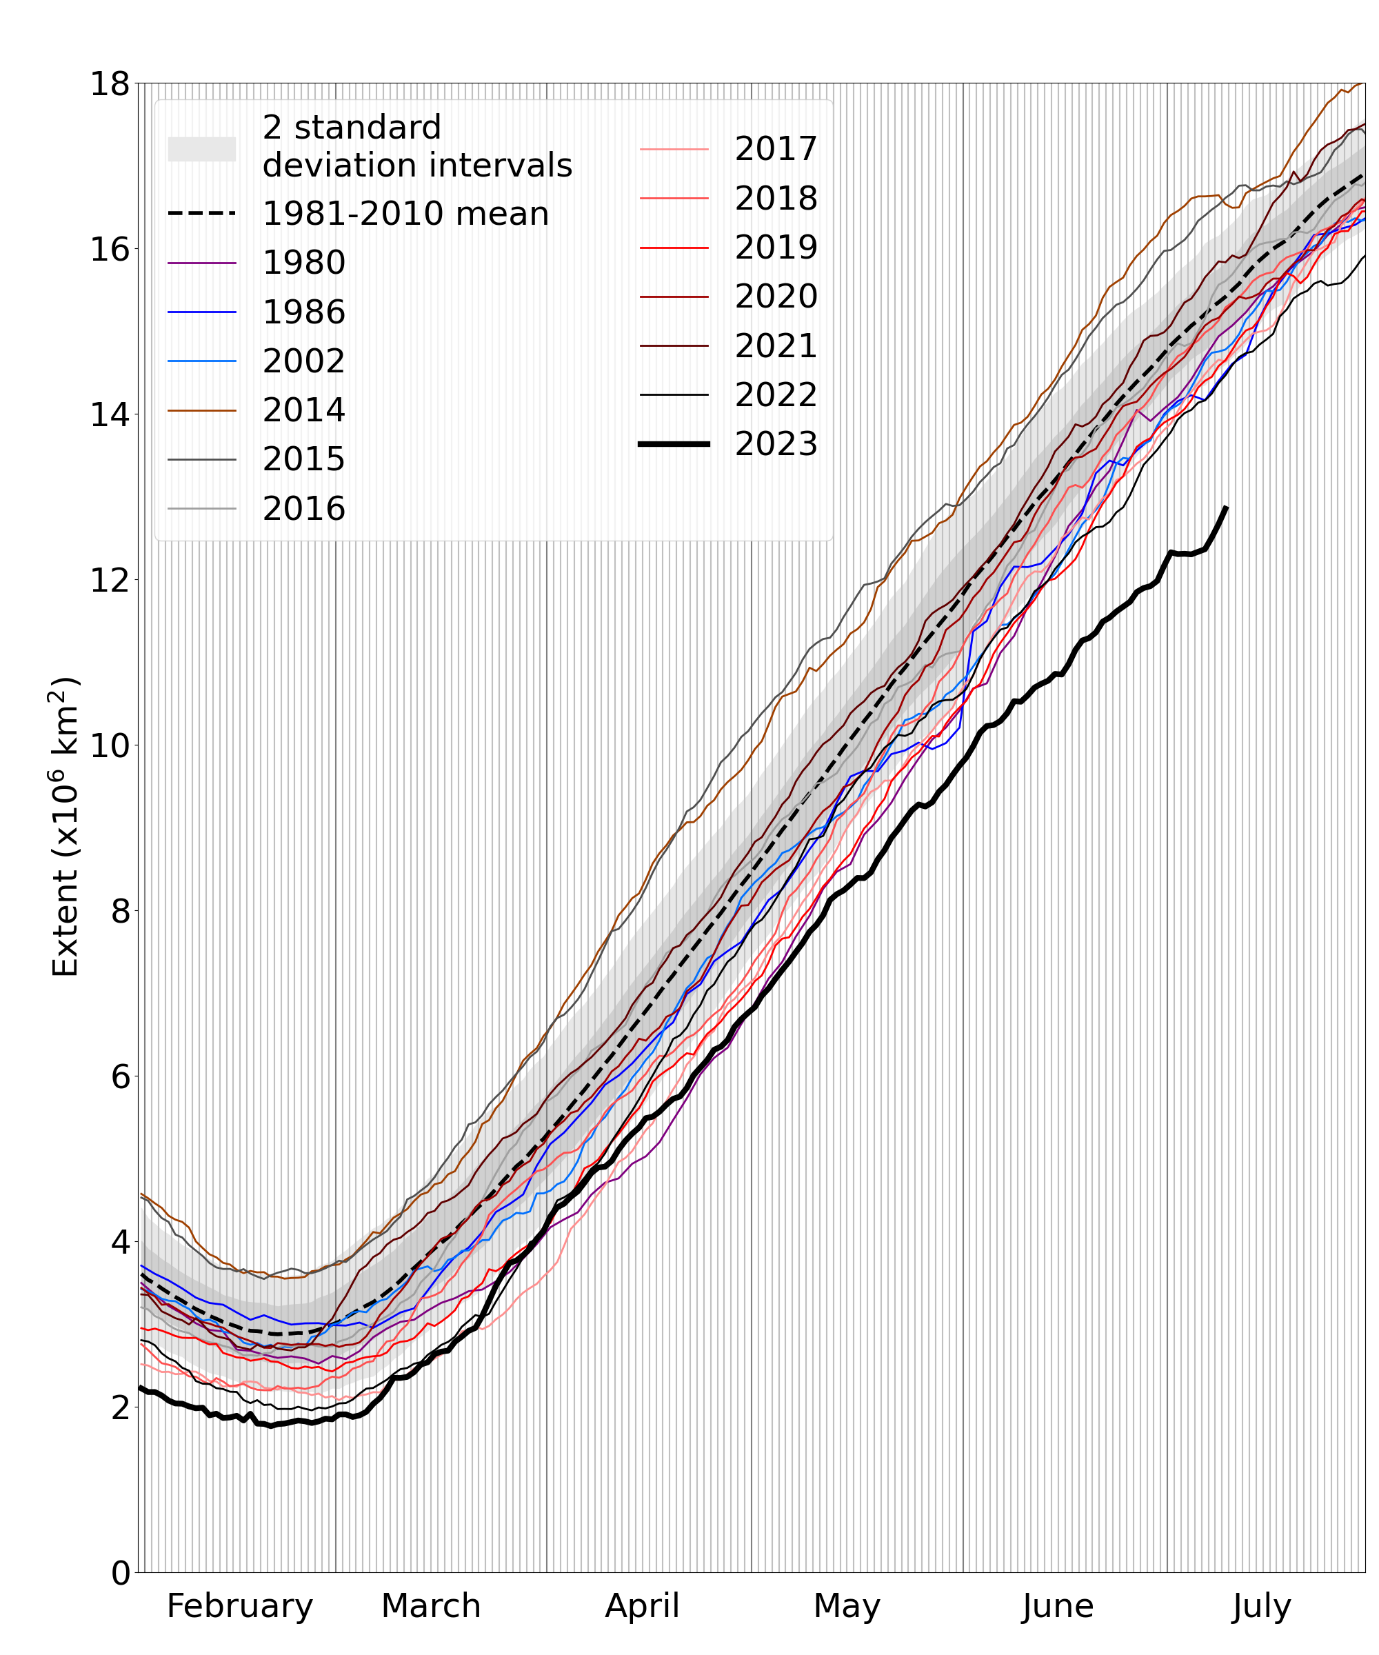
Figure 6. Daily Antarctic sea ice extent for 2023, compared with recent years and the 1981-2010 average, with ± 1 and 2 standard deviation intervals indicated by the shaded areas. Data are from NSIDC.
Extent was exceptionally low in most parts of the Southern Ocean, including the Weddell Sea, Ross Sea, Bellingshausen Sea and the Indian Ocean sector. However, extent was higher than average in the Amundsen Sea.
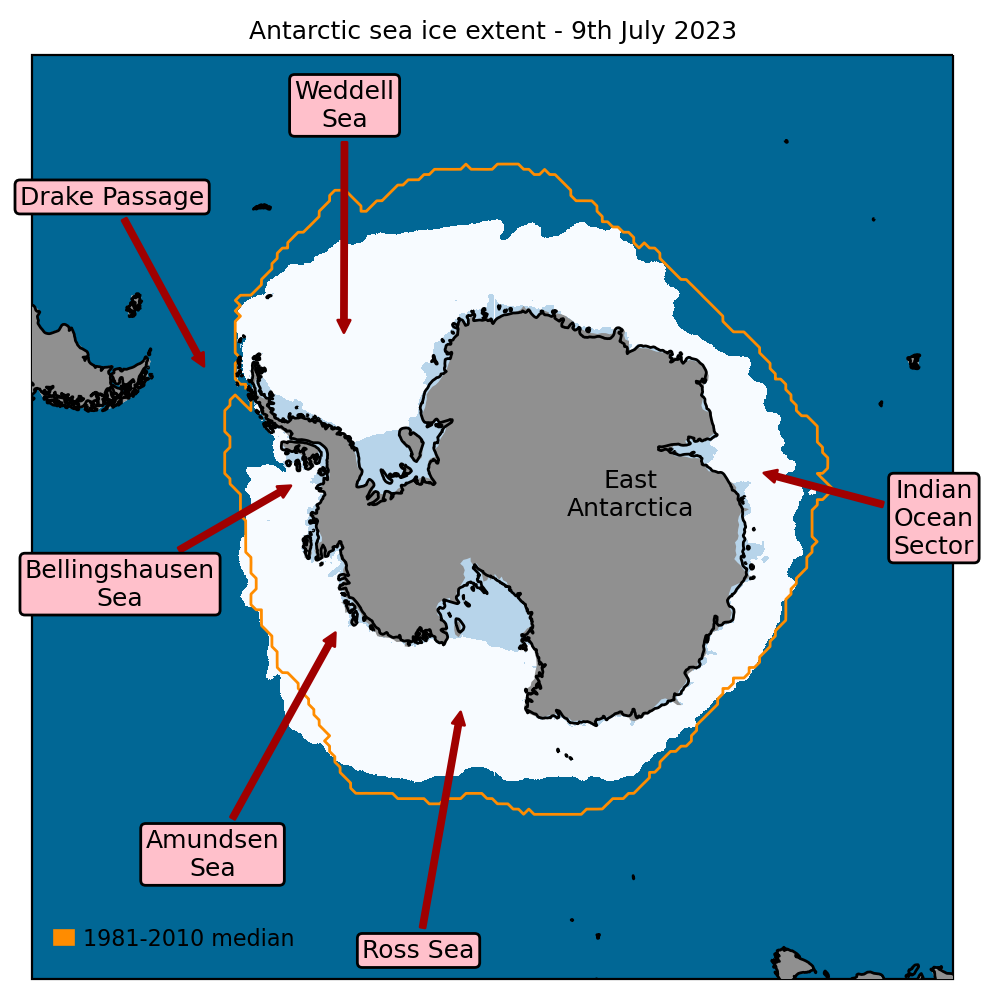
Figure 7. Antarctic sea ice extent on 9th July 2023, with 1981-2010 average extent indicated in orange, and the regions referred to in the text labelled. Data are from EUMETSAT OSI SAF (Tonboe et al., 2017).
Antarctic sea ice extent has been at exceptionally low levels for the time of year since mid-May 2023. During May and June, Antarctic sea ice expands rapidly as the Southern Hemisphere enters winter and the Antarctic continent is in near-complete darkness. In 2023, the annual sea ice expansion has been much slower than normal; on 9th July, Antarctic sea ice extent was at values more typical for early June. On 6th July, the Antarctic sea ice extent reached 2.84 million sq km below the 1981-2010 average, the largest low anomaly recorded in the satellite era (Figure 8).
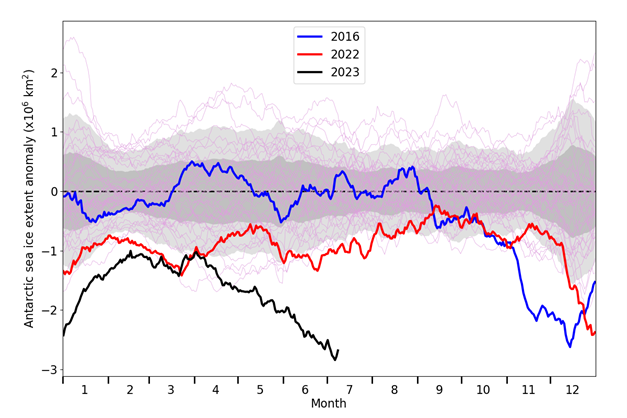
Figure 8. Daily Antarctic sea ice extent anomaly, relative to the 1981-2010 average, according to the NSIDC Sea Ice Index. 1981-2010 1x and 2x standard deviation is indicated by grey filled regions; all individual years from 1979 are indicated in light pink, with 2016 (blue), 2022 (red) and 2023 (black) highlighted.
During May and June, persistent lower than average pressure to the west of the Drake Passage, and higher than average pressure north of the Ross Sea, have directed cold southerly winds over a narrow region of the sea ice edge in the Amundsen Sea. On either side of these systems, warm northerly winds have acted over a much wider area (the Weddell, Bellingshausen and Ross Seas). Temperature anomaly maps for May and June show warm anomalies over a very large portion of the sea ice edge, with cold anomalies outside the Amundsen Sea mainly to be found in the interior of the ice pack. This circulation pattern is likely an important driver of the extreme sea ice anomalies observed since mid-May. However other causes, for example involving clouds or ocean currents, cannot be ruled out.
References
Fetterer, F., K. Knowles, W.N. Meier, M. Savoie and A.K. Windnagel (2017) Sea Ice Index, Version 3. Boulder, Colorado USA. National Snow and Ice Data Center. https://doi.org/10.7265/N5K072F8. Date Accessed: 03-07-2023.
Kalnay, E., and Coauthors (1996) The NCEP/NCAR 40-Year Reanalysis Project. Bull. Amer. Meteor. Soc., 77, 437–472. https://doi.org/10.1175/1520-0477(1996)077<0437:TNYRP>2.0.CO;2
Tonboe, R., J. Lavelle, R.-H. Pfeiffer and E. Howe (2017) OSI SAF Global Sea Ice Concentration. Product OSI-401-b. Version 1.6. September 2017, Available at: https://osi-saf.eumetsat.int/products/osi-401-b