
Briefing on Arctic and Antarctic sea ice - June 2023
Alex West, Ed Blockley and Jeff Ridley
Summary
- Arctic sea ice extent is below average for the time of year, but well above record low levels following near-average ice loss during May.
- Areas of below average extent are mainly to be found along the Atlantic sea ice edge
- Winter 2022-23 in the Arctic was mild, but not exceptionally so. Spring 2023 saw near-average temperatures, with May being unusually stormy.
- Late winter Arctic sea ice thickness is above average in the Beaufort Sea and north of the Fram Strait, but near- or below-average elsewhere.
- Predictions of September Arctic sea ice extent cannot be reliably made at this point in the season.
- Antarctic sea ice extent is exceptionally low, the lowest on record for this date by a wide margin. This follows a second successive record annual minimum Antarctic sea ice extent in February 2023.
- The current low Antarctic sea ice extent, and recent record lows, are likely partly associated with unusually low sea level pressure in the Amundsen Sea, as well as oscillations in tropical Pacific sea surface temperatures and Southern Hemisphere atmospheric pressure.
Current Arctic sea ice state
Arctic sea ice extent on 12th June 2023 was 11.33 million sq km. This was 0.67 million sq km below the 1981-2010 average, and 0.56 million sq km above the record low for this date, which occurred in 2016.
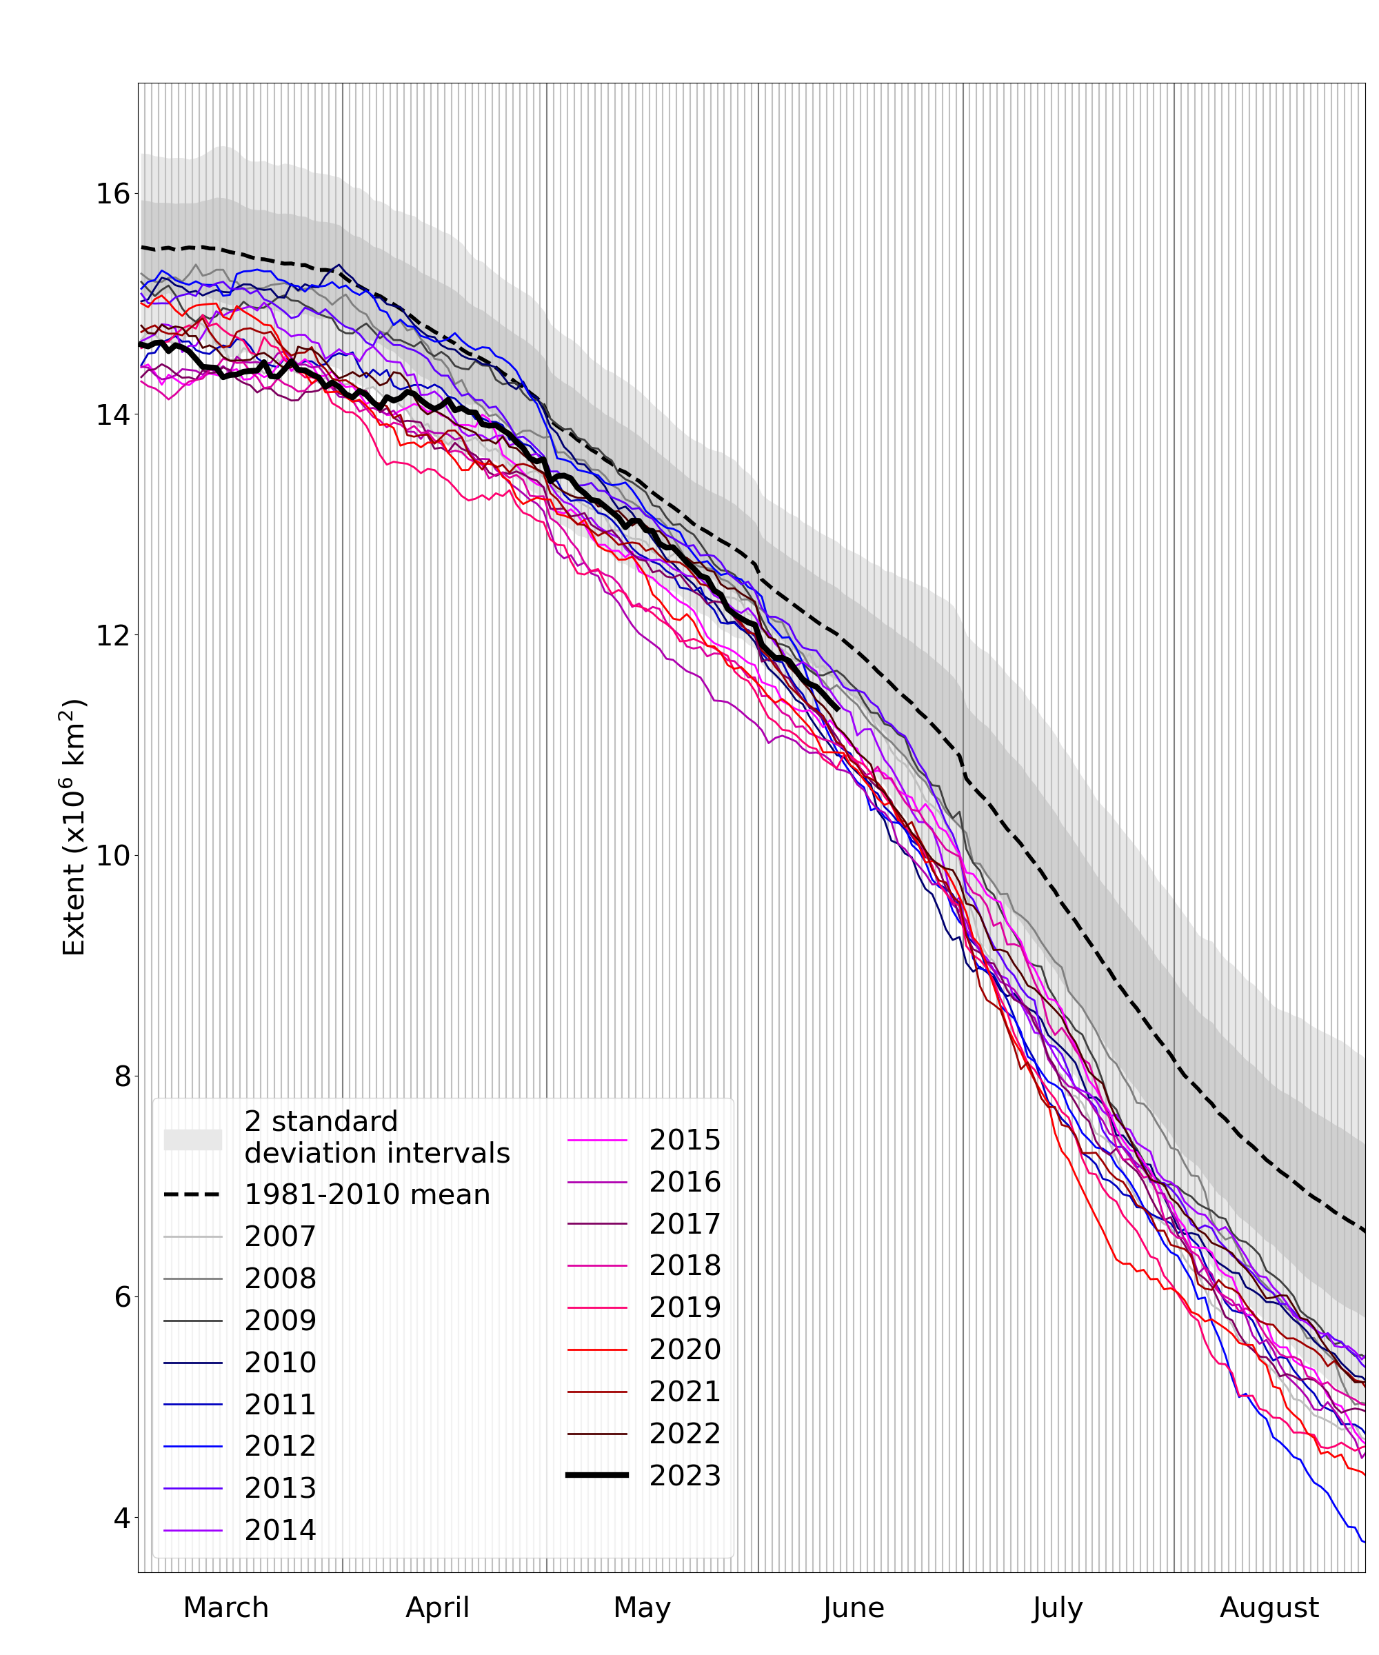
Figure 1. Daily Arctic sea ice extent for 2023, compared with recent years and the 1981-2010 average with ± 1 and 2 standard deviation intervals indicated by the shaded areas. Data are from the National Snow and Ice Data Center (NSIDC).
Extent was well below average in the Barents and Kara Seas, but near-average in other parts of the Arctic Ocean, with few areas of open water having formed as of 12th June (Figure 2).
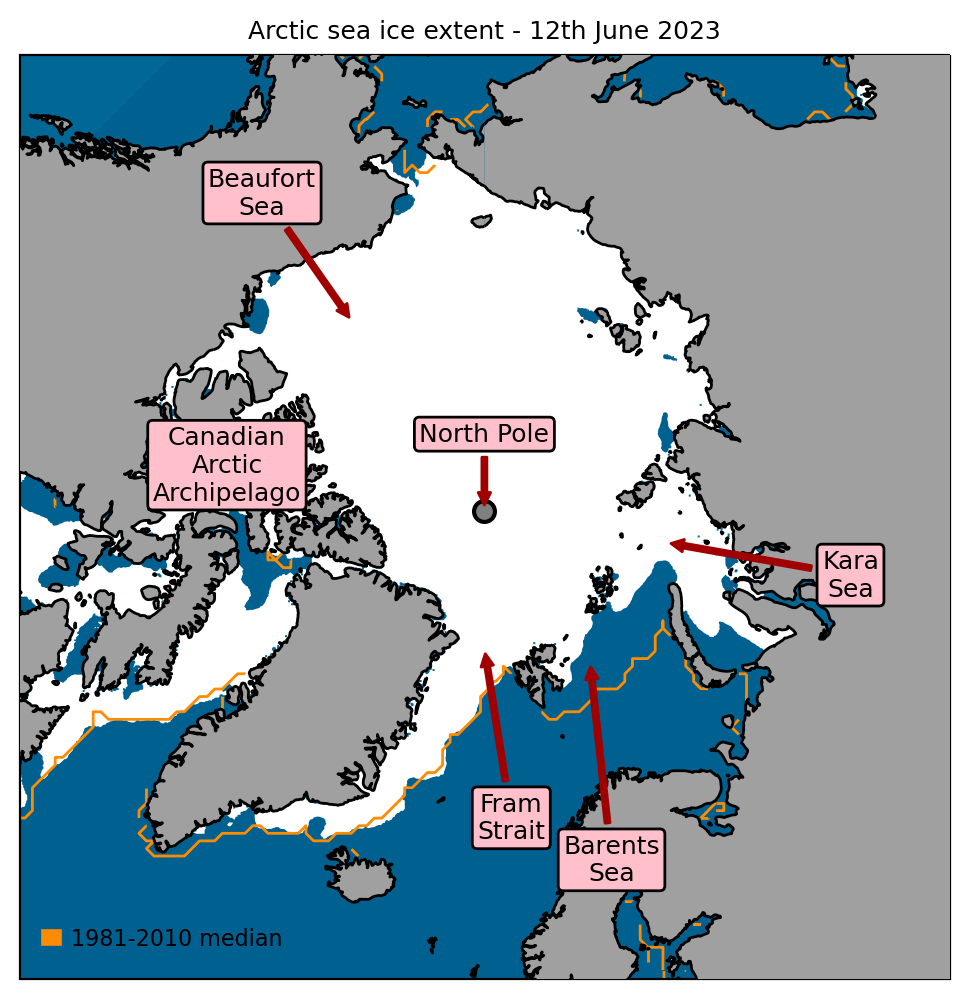
Figure 2. Arctic sea ice extent on 12th June 2023, with 1981-2010 average extent indicated in orange, and the regions referred to in the text labelled. Data are from EUMETSAT OSI SAF (Tonboe et al., 2017).
May 2023 in context
Average Arctic sea ice extent for May 2023 was 12.83 million sq km according to the NSIDC Sea Ice Index (Fetterer et al., 2017). This was 0.45 million sq km below the 1981-2010 average, but 0.48 million sq km above the long-term linear trend (Figure 3). The average rate of ice loss during May 2023 was 48,000 sq km per day, similar to the 1981-2010 average of 47,000 sq km per day. Extent loss was near or below-average for much of May, but became somewhat faster in the last week of the month.
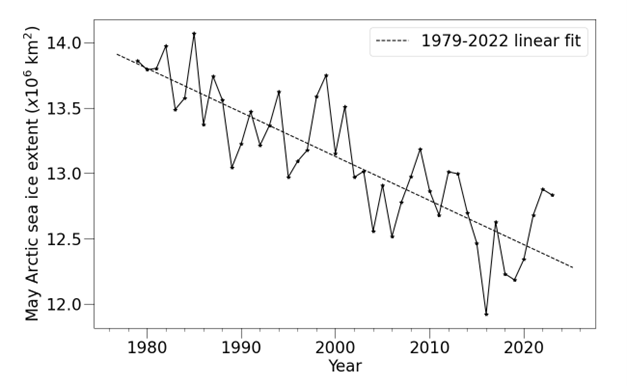
Figure 3. Average May Arctic sea ice extent according to the NSIDC Sea Ice Index (Fetterer et al., 2017).
Review of Arctic weather conditions in winter and spring 2023
Winter 2022-23 was the joint-fifth warmest on record in the Arctic, effectively equal with 2013-14 and 2005-6, as measured by November-March average temperatures above 70°N, which were 2.12 degrees above the 1981-2010 average (Figure 4). Pressure tended to be higher than average on the North American side of the Arctic and lower than average on the Siberian side (Figure 5a), particularly during January and March. Temperature anomalies were highest in the Beaufort Sea and Canada Basin but were near or below-average in the Siberian coastal seas (Figure 5b).
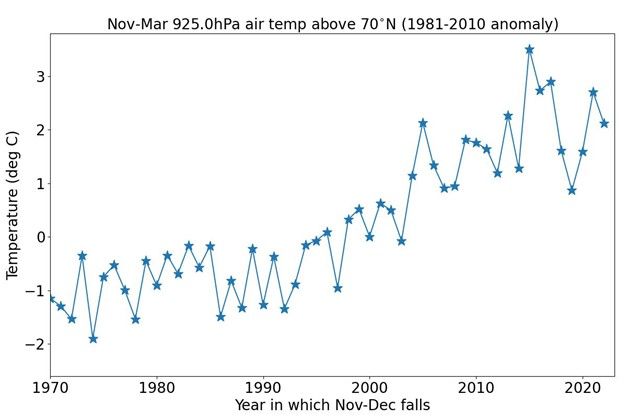
Figure 4. Average November-March air temperature (°C) at 925 hPa for the region north of 70 °N from 1970-present, according to the NCEP reanalysis (Kalnay et al., 1996).
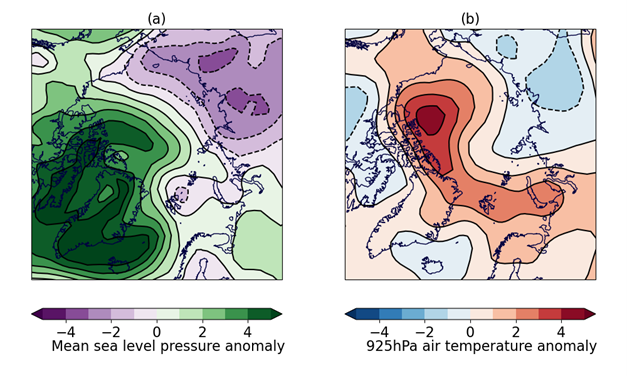
Figure 5. Near-surface meteorological conditions for November 2022 – March 2023 relative to the 1981-2010 long-term average: (a) mean sea level pressure anomaly (hPa); (b) 925hPa air temperature anomaly (°C). Data are from the NCEP reanalysis (Kalnay et al., 1996).
During April and May temperatures have been near- or below average across the Arctic Ocean, with the exception of the East Siberian Sea during April and the Beaufort Sea during May. May was a particularly unsettled, cyclonic month in the Arctic, with a succession of powerful storms entering from the Western Siberia region; mean sea level pressure for the month was over 10hPa below average across a large region of the Arctic Ocean.
Sea ice thickness at the end of winter is a useful indicator of the state of the ice, as thicker ice is less likely to melt out during the summer. Since 2011 the CryoSat-2 radar altimetry sensor has provided estimates of ice thickness throughout the Arctic winter (Tilling et al., 2018). In February 2023, CryoSat-2 measured ice across the majority of the Arctic Ocean to be less than 2m thick (Figure 6a), with thicker ice mainly to be found in a triangle between the North Pole, the Fram Strait and the Canadian Arctic Archipelago, as well as a small region in the southern Beaufort Sea. Relative to the 2011-2022 average, ice was thicker than average north of the Fram Strait, Canadian Archipelago and in the Beaufort Sea, but near or below-average elsewhere (Figure 6b).
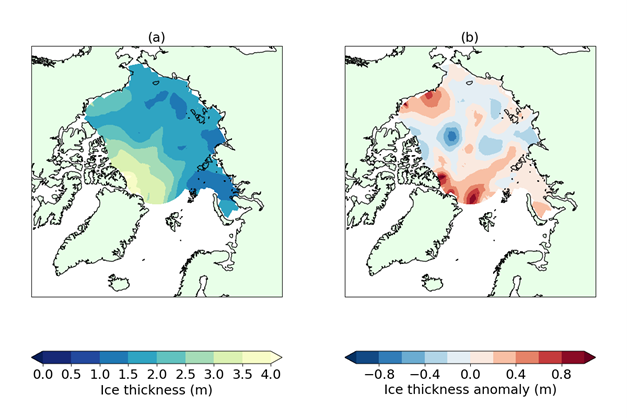
Figure 6. Arctic sea ice thickness from CryoSat-2 radar altimetry: (a) sea ice thickness for February 2023; (b) sea ice thickness anomaly relative to the 2011-2022 average.
Outlook for September
There is no significant correlation between ice extent in early June and the seasonal minimum extent in September, as the severity of melt is heavily dependent on Arctic weather conditions over the summer. Statistical predictions based on daily ice extent only start to achieve some skill by mid-July. Hence it is not possible to predict September sea ice extent with any confidence at this point in the season.
Current Antarctic sea ice state
Antarctic sea ice extent on 12th June 2023 was 10.74 million sq km (Figure 7). This was the lowest value on record for this date, the next lowest having been 11.89 million sq km in 2019. It was 2.28 million sq km below the 1981-2010 average.
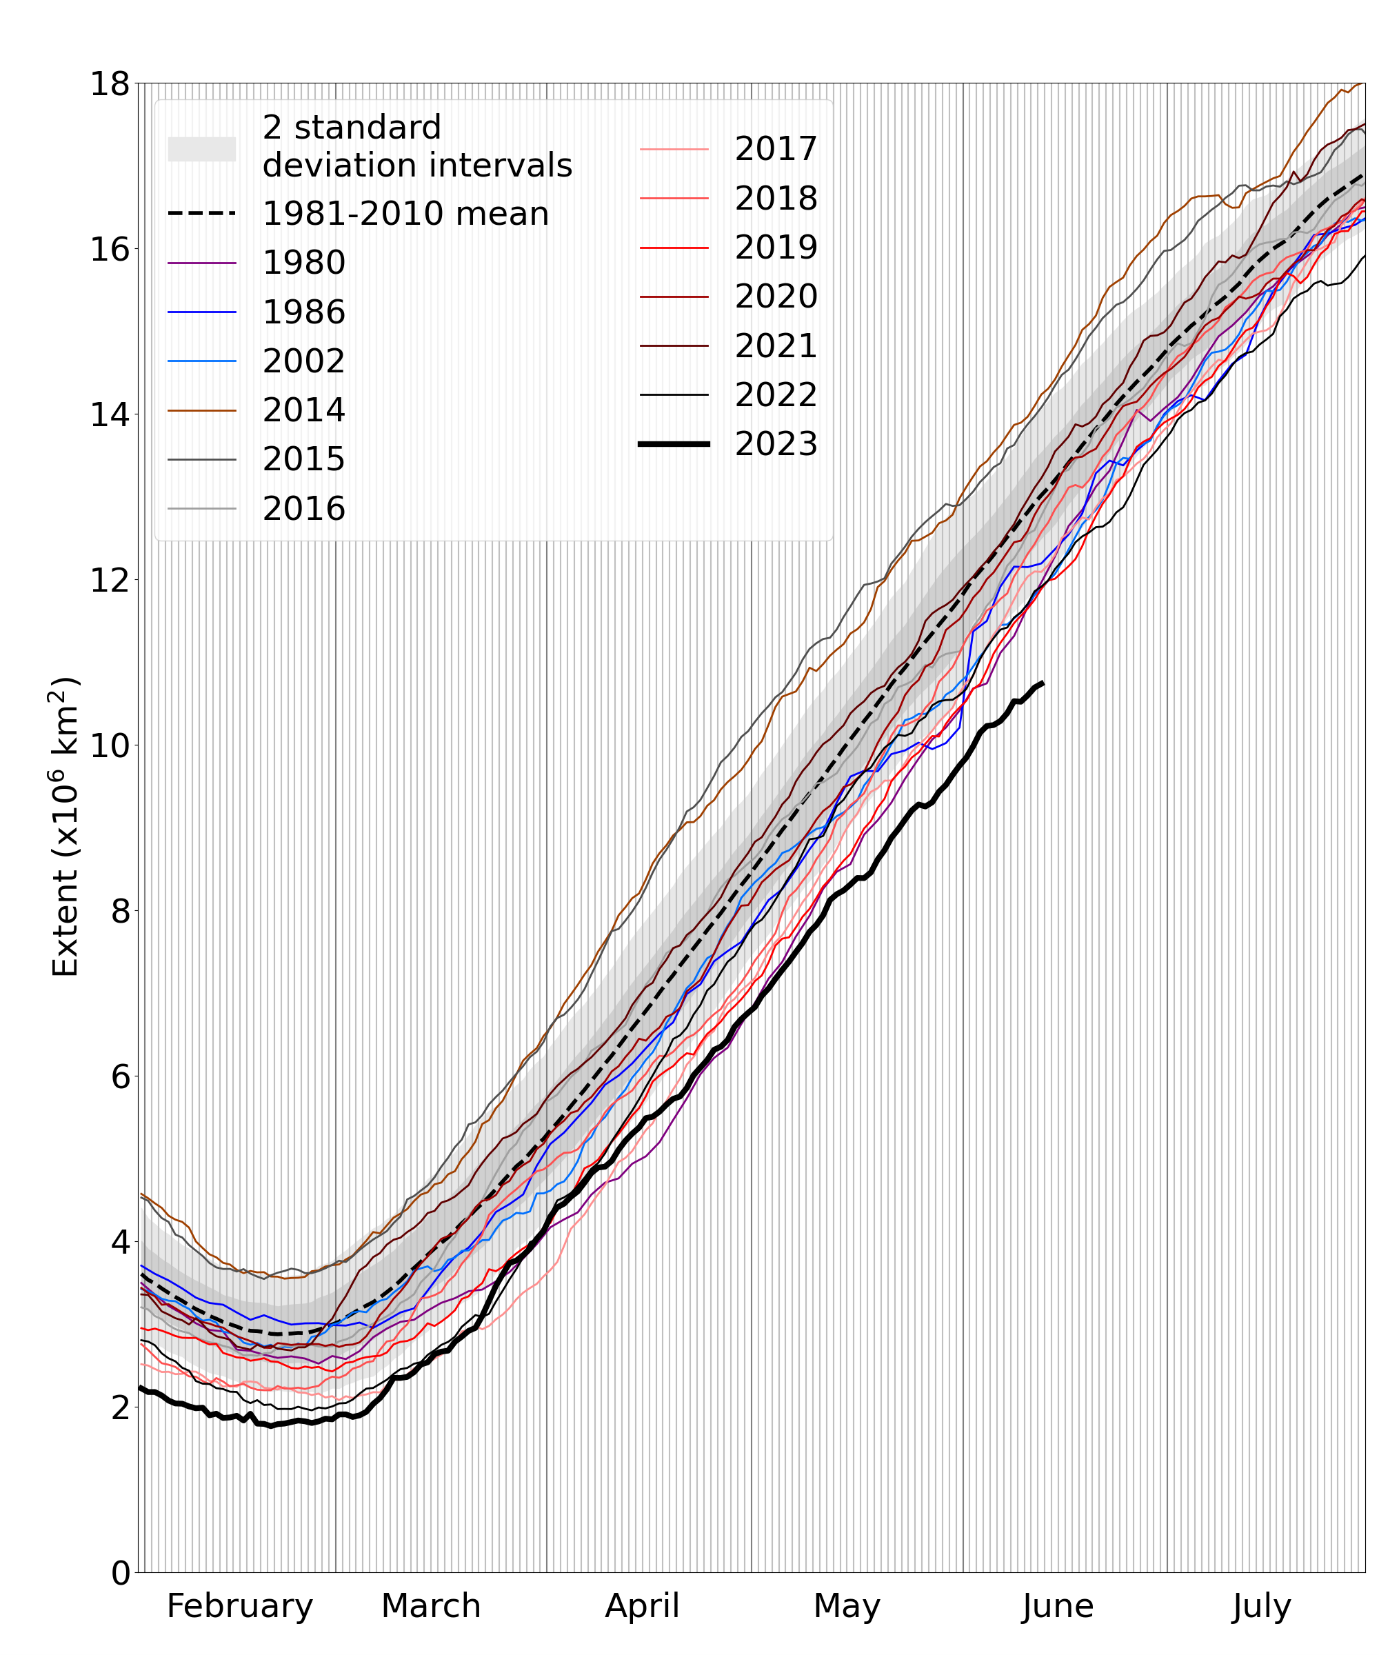
Figure 7. Daily Antarctic sea ice extent for 2023, compared with recent years and the low ice years of 1980, 1986 and 2002. Also shown is the 1981-2010 average with ± 1 and 2 standard deviation intervals indicated by the shaded areas. Data are from the National Snow and Ice Data Center (NSIDC).
Extent was exceptionally low in the Bellingshausen Sea, Weddell Sea and Ross Sea sectors, and below average in most other parts of the Southern Ocean. However, it was slightly above average in the Amundsen Sea sector.
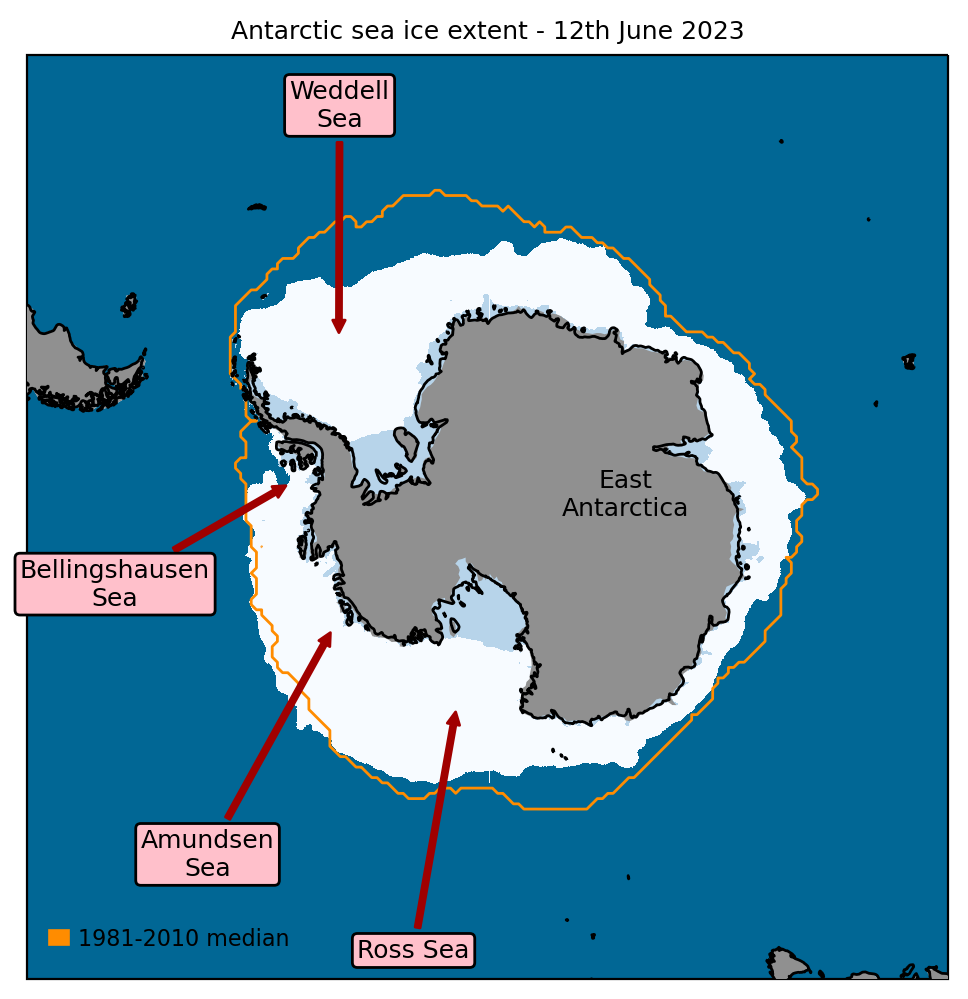
Figure 8. Antarctic sea ice extent on 12th June 2023, with 1981-2010 average extent indicated in orange, and with regions referred to in the text labelled. Data are from EUMETSAT OSI SAF (Tonboe et al., 2017).
Antarctic sea ice extent has been at record or near-record low values since late December 2022, and has been near-consistently below average since November 2016. A record annual minimum extent of 1.79 million sq km was recorded in February 2023; the previous record minimum of 1.97 million sq km was recorded a year earlier in February 2022.
The ongoing period of low Antarctic sea ice is likely partly associated with two large-scale climatic oscillations: El Niño Southern Oscillation, characterised by changes in sea surface temperature in the tropical Pacific, and the Southern Annular Mode, a measure of pressure difference between Antarctica and the Southern Hemisphere midlatitudes. Extreme phases of these drivers are known to exert a strong influence on Antarctic sea ice extent via their effect on surface winds and sea surface temperatures (e.g., Wang, J. et al., 2023).
The recent two record minimum extents may also have been caused by unusually low atmospheric pressure in the Amundsen Sea from September-November in 2021 and 2022, blowing sea ice in the Ross Sea away from the Antarctic coast into warmer waters (Wang, S. et al., 2023). Pressure was similarly low here during May 2023, causing persistent warm northerly winds over the Weddell and Bellingshausen Seas which may have helped slow down sea ice growth.
While Antarctic sea ice extent is projected to decrease under climate change (e.g., Holmes et al., 2022), it should be noted that over the whole era of satellite observations (since 1979) the trend in Antarctic sea ice extent is not yet significantly different from zero. This is partly due to a period of very high extent from 2012-2014.
References
Fetterer, F., K. Knowles, W.N. Meier, M. Savoie and A.K. Windnagel (2017) Sea Ice Index, Version 3. Boulder, Colorado USA. National Snow and Ice Data Center. https://doi.org/10.7265/N5K072F8. Date Accessed: 06-06-2023.
Holmes, C.R., T.J. Bracegirdle and P.R. Holland (2022) Antarctic sea ice projections constrained by historical ice cover and future global temperature change. Geophys. Res. Lett., 49, e2021GL097413. https://doi.org/10.1029/2021GL097413
Kalnay, E., and Coauthors (1996) The NCEP/NCAR 40-Year Reanalysis Project. Bull. Amer. Meteor. Soc., 77, 437–472. https://doi.org/10.1175/1520-0477(1996)077<0437:TNYRP>2.0.CO;2
Schweiger, A., R .Lindsay, J. Zhang, M. Steele, H. Stern and R. Kwok (2011) Uncertainty of modelled arctic sea ice volume. J. Geophys. Res. Oceans, 116, C00D06. https://doi.org/10.1029/2011JC007084
Tilling, R.L., A. Ridout and A. Shepherd (2018) Estimating Arctic sea ice thickness and volume using CryoSat-2 radar altimeter data. Adv. Space Res., 62(6), 1203–1225. https://doi.org/10.1016/j.asr.2017.10.051
Tonboe, R., J. Lavelle, R.-H. Pfeiffer and E. Howe (2017) OSI SAF Global Sea Ice Concentration. Product OSI-401-b. Version 1.6. September 2017, Available at: https://osi-saf.eumetsat.int/products/osi-401-b
Wang, J., H. Luo, L. Yu, X. Li, P.R. Holland and Q. Yang (2023) The Impacts of Combined SAM and ENSO on Seasonal Antarctic Sea Ice Changes. J. Climate, 36, 3553–3569. https://doi.org/10.1175/JCLI-D-22-0679.1
Wang, S., J. Liu, X. Cheng, D. Yang, T. Kerzenmacher, X. Li, Y. Hu and P. Braesicke (2023) Contribution of the deepened Amundsen Sea Low to the record low Antarctic sea ice extent in February 2022. Environ. Res. Lett., 18, 054002. https://doi.org/10.1088/1748-9326/acc9d6