
Arctic and Antarctic end-of-season report - October 2025
Alex West and Ed Blockley
Summary
- Arctic sea ice extent for September 2025 was 5.23 million sq km according to the OSI SAF Sea Ice Index, well below the 1981-2010 average but among the higher September extents observed since 2007
- Ice loss was above average early in the 2025 melt season, however this was mainly due to melting in the subarctic seas rather than the Arctic Ocean. From July onwards, melting was mostly near- or below-average
- The summer of 2025 was rather warm in the Arctic, but in general the warmth did not occur over regions of vulnerable sea ice, except in areas where sea ice completely melts away every summer
- Predictions of the September 2025 summer minimum tended to underestimate the eventual extent
- Although September Arctic sea ice extent from 2007-2025 has a near-zero trend, ice loss has continued in other months of the year, particularly in April and October. Additionally, every September sea ice extent measured since 2007 has been lower than the pre-2007 range
- Antarctic sea ice extent for September 2025 was the third lowest on record at 18.07 million sq km according to the OSI SAF Sea Ice Index, with the September extents of 2023 and 2024 being first- and second-lowest
- The spatial pattern of below-average Antarctic ice anomalies was very different in 2025 to the record low year of 2023, and this can mainly be traced to different patterns of atmospheric circulation. A persistent strong Amundsen Sea Low drove a large part of this year’s low September extent
Arctic
Sea ice extent
Arctic sea ice extent for September 2025 was 5.23 million sq km according to the OSI SAF Sea Ice Index (Lavergne et al., 2023). This was 1.51 million sq km below the 1981-2010 mean but 0.81 million sq km above the long-term linear trend. It was the 13th lowest September extent recorded in the era of satellite observations (since 1979).
This ranking differs to that reported by the NSIDC (US National Snow and Ice Data Center) Sea Ice Index, for which 2025 is 11th lowest. Sea ice extent measurements carry a small amount of uncertainty as they are derived from satellite detection of microwaves emitted from the Earth’s surface; the precise algorithm used to convert the microwave signal to ice fraction leads to differences in the measured extent. In 2025, this uncertainty is likely even higher than normal due to a recent change in the satellite sensor used to produce the two indices.
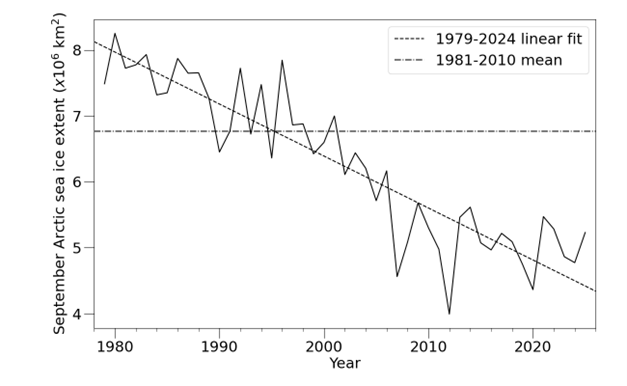
Figure 1. September Arctic sea ice extent during the satellite era, according to the OSI SAF Sea Ice Index (Lavergne et al., 2023), with linear trend and 1981-2010 average indicated.
Extent was well below average in all regions of the Arctic except the East Siberian Sea, where it was in some places slightly above average (Figure 2). Ice was far more extensive than in the record low month of September 2012 throughout the Pacific and Siberian sides of the Arctic but was similar or slightly less extensive on the Atlantic side.
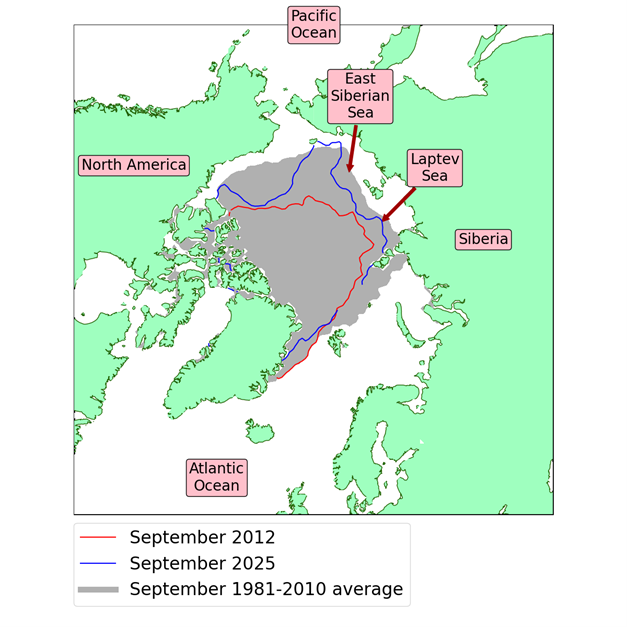
Figure 2. Average Arctic sea ice extent for September 2025, compared to the record low of September 2012 and the 1981-2010 September average, with regions referred to in the text labelled. Data are from EUMETSAT OSI SAF (Tonboe et al., 2017).
The 2025 melting season in detail
The early part of the 2025 melt season saw above-average melt (Figure 3), with record or near-record low extent for the time of year in late June and early July. However, this was mainly due to exceptionally below-average ice extent in Hudson and Baffin Bays, with the onset of ice melt in the Arctic Ocean not particularly early by the standards of recent years. In early July, the rate of melting slowed, and remained near- or below-average for the rest of the summer.
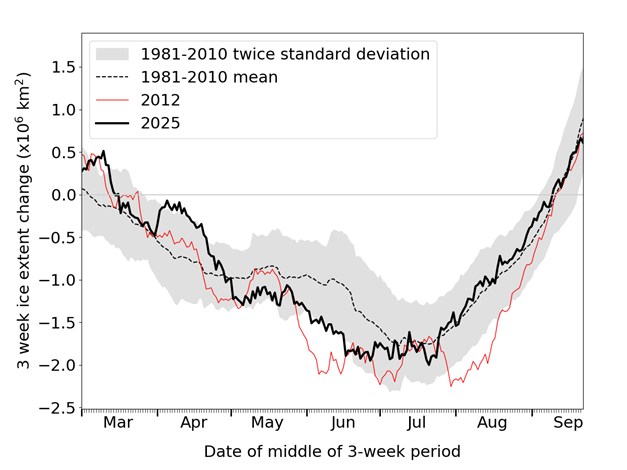
Figure 3. 3-week change in Arctic sea ice extent over the melting season for 2025 (black line), the record low year of 2012 (red line) and the 1981-2010 average (dotted black line). More negative values indicate faster ice loss and positive values indicate ice gain. Data are from the OSI SAF Sea Ice Index (Lavergne et al., 2023).
The summer of 2025 was overall relatively warm in the Arctic: as measured by average May-August temperatures above 70°N at the 925hPa level (about 800m above the Earth’s surface), the summer had an anomaly of +1.71°C and was the joint-3rd warmest on record (Figure 4), equal to the summers of 2011 and 2019 but cooler than 2020 and 2024.
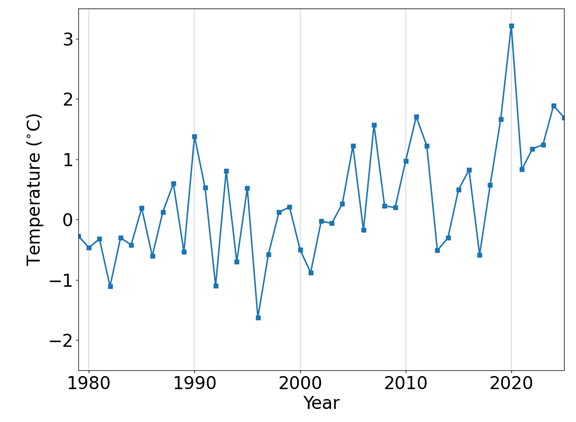
Figure 4. Average May-August temperature anomaly, relative to the 1981-2010 average, for the Arctic Ocean region. Temperatures are taken at the 925hPa level (about 800m above the surface) to show the effect of atmospheric circulation on the sea ice, as surface temperatures are strongly influenced by the sea ice itself. Data are from the ERA5 reanalysis (Hersbach et al., 2017).
However, the warmth was concentrated in times and places that did not cause severe sea ice melt. June was the coolest in the Arctic since 2017, helping to delay the onset of surface melt over the Arctic Ocean. It was especially cool in the Laptev Sea north of central Siberia, a region which has often seen early rapid ice melt in recent years.
In July and August, warmth was focussed on the Atlantic and West Siberian sides of the Arctic Ocean (Figure 5a), an area including many regions where, historically, sea ice melts completely in September regardless. Far more variability in ice extent is found on the Pacific and East Siberian sides, but here temperatures were near or below-average during July and August. This was due to frequent occurrence of a weather pattern known as the negative Arctic Dipole, where pressure is high over the Siberian side of the Arctic (producing settled weather) and low on the North American side of the Arctic (producing stormy weather). This tends to funnel warm air over the Atlantic side of the Arctic, leaving the rest of the Arctic Ocean somewhat cooler. At many other times, stormy and cyclonic conditions prevailed over most of the Arctic Ocean. The average sea level pressure field for July and August shows the predominance of these two weather patterns, with cyclonic conditions shifted towards the North American side of the Arctic (Figure 5b).
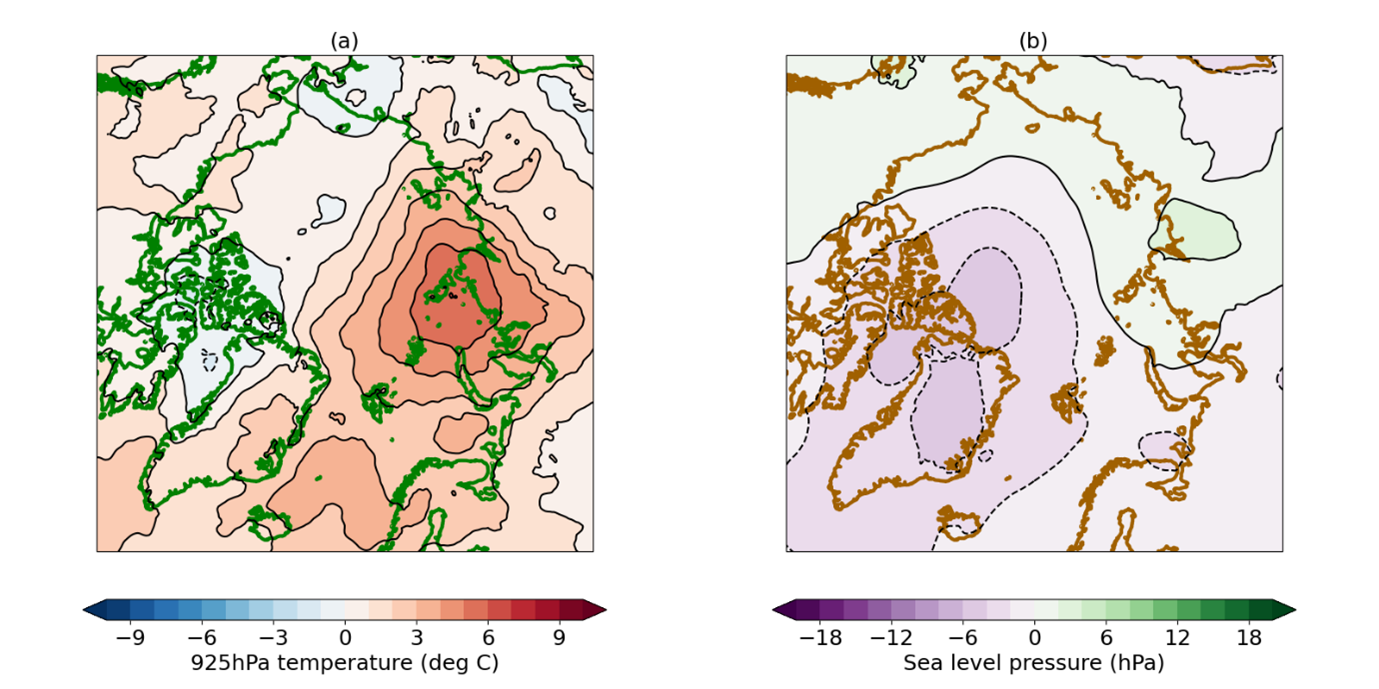
Figure 5. Arctic July-August 2025 anomaly relative to the 1981-2010 average in (a) 925hPa temperature; (b) sea level pressure. Sea level pressure and temperature data are from the ERA5 reanalysis (Hersbach et al., 2017). The 925hPa temperature represents conditions around 800m above sea level.
Assessment of predictions
In June and July of 2025, the Sea Ice Prediction Network collated predictions of September Arctic sea ice extent from institutions around the world, based on a mixture of dynamical, statistical and machine-learning techniques. Unlike in previous years, no report was published in August. The eventual September extent fell close to the top of the main body of predictions in both June and July (Figure 6), although in each case there was a single outlier prediction that was much higher.
To supplement the SIPN predictions, statistical predictions of September sea ice extent based on detrended anomalies and historical melt trajectories were also published in the July and August sea ice briefings. Throughout the melting season, the uncertainty intervals of each prediction barely encompassed the eventual September extent (Figure 6), with the central prediction remaining far below the actual extent until mid-August. This behaviour reflects the record lows observed early in the melt season, followed by 2 months of near- or below-average ice loss.
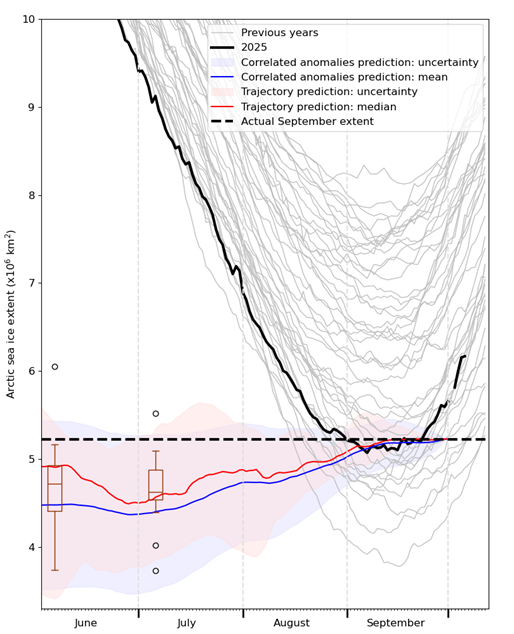
Figure 6. An evaluation of predictions of 2025 September sea ice extent submitted to the Sea Ice Prediction Network (SIPN), alongside statistical predictions performed for the July and August sea ice briefings. Evolution of sea ice extent during the summer in 2025 and previous years is shown for context. As the SIPN predictions are made using the alternative NSIDC Sea Ice Index as reference, which usually measures lower sea ice extents than the OSI SAF Sea Ice Index used in these briefings, the average 1981-2010 September sea ice extent difference between the datasets has been added to the predictions for a fairer comparison.
Arctic sea ice changes since 2007
The record low September extents of 2007 and 2012 were each far below anything that had been previously observed. As of 2025, September Arctic sea ice extent has not yet fallen further. The post-2007 range of September sea ice extents (3.99 to 5.68 million sq km) is entirely below the pre-2007 range (5.71 to 8.25 million sq km), but the trend in September sea ice extent from 2007-2025 is nearly flat at -0.02 million sq km per decade.
During this period however, other changes in Arctic sea ice have taken place. Sea ice extent has fallen during all other months of the year, most notably in April and October at 0.37 and 0.49 million sq km per decade respectively (Figure 7a). In addition, the location of the most severe summer melting has changed, particularly in the middle of the melting season, with more melting seen on the Atlantic side of the Arctic, and less on the Pacific side (Figure 7b).
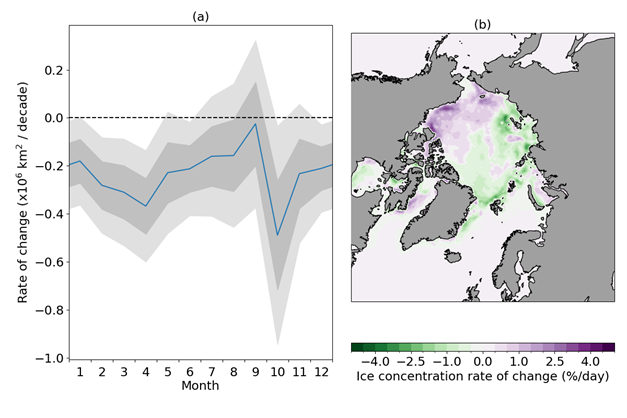
Figure 7. (a) 2007-2025 linear trend in Arctic sea ice extent for each month of the year, with 1x and 2x standard error intervals indicated. A month for which the zero line lies outside the light shading indicates a chance of <5% that the observed trend would be seen without an underlying decline. For October-December, the trend period ends in 2024 as data is not yet available for 2025. (b) 2007-2025 linear trend in ice concentration for the period 14th-18th July. Green colours indicate a trend towards less sea ice, and faster melting; purple colours indicate more sea ice and slower melting.
Antarctic
Sea ice extent and its recent decline in context
Average Antarctic sea ice extent for September 2025 was 18.07 million sq km, according to the OSI SAF Sea Ice Index (Lavergne et al., 2023). This was 0.94 million sq km below the 1981-2010 average and was the joint-3rd lowest September extent in the satellite record since 1979, equal to September 1986 (Figure 8). Only the September extents of 2023 and 2024 were lower, at 17.35 and 17.55 million sq km respectively. The maximum sea ice extent of 18.28 million sq km, recorded on 15th September, was also the 3rd lowest winter maximum in the satellite record.
The long-term trend in September Antarctic sea ice extent is now slightly negative at 0.04 million sq km per decade. This trend is not significant, and conceals much more complex behaviour, with a slow rise until 2011 followed by a sharp rise to 2014, and then two precipitous falls in 2016 and 2023. The trend in Antarctic sea ice extent across all seasons since 2007 is very significantly negative at -1.12 million sq km per decade. Warm water upwelling to the surface of the Southern Ocean has been suggested as a possible cause of the recent rapid sea ice decline (Purich and Doddridge, 2023).
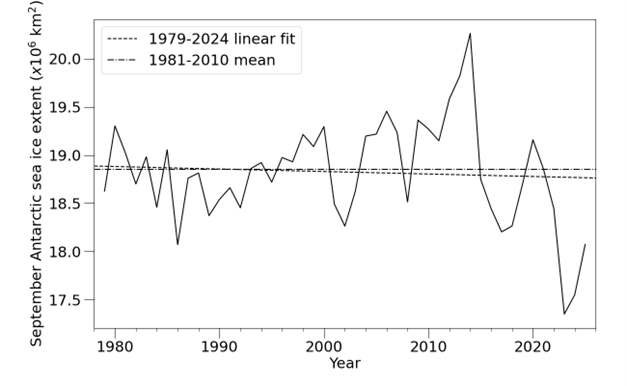
Figure 8. September Antarctic sea ice extent during the satellite era, according to the OSI SAF Sea Ice Index (Lavergne et al., 2023), with linear trend and 1981-2010 average indicated.
The spatial pattern of extent was very different in September 2025 to that of the record low of September 2023. Areas which saw well-below average extent in 2023 such as the Ross Sea, eastern Weddell Sea and King Haakon VII Sea tended to see near- or above-average extent this year. The reverse was true for the Amundsen and Bellingshausen Seas, and much of the Indian Ocean sector (Figure 9), which saw very low extent in 2025.
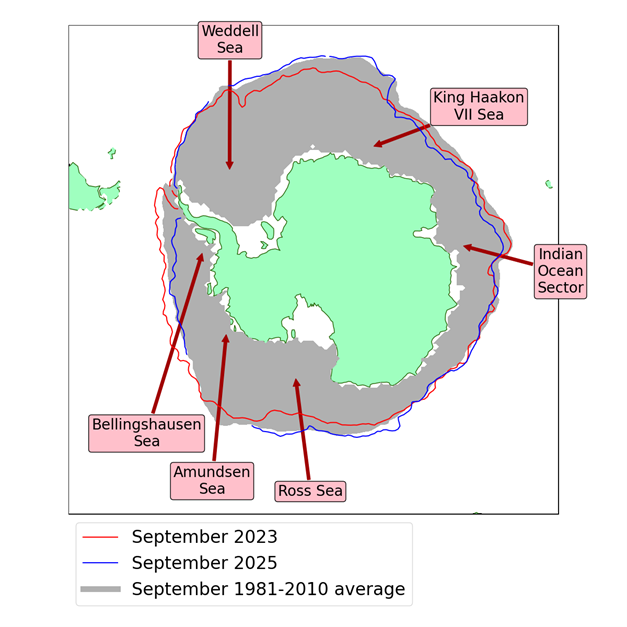
Figure 9. Antarctic sea ice extent for September 2025, compared to the record low of September 2023 and the 1981-2010 September average, with regions referred to in the text labelled. Data are from EUMETSAT OSI SAF (Tonboe et al., 2017).
Many of these differences can be attributed to atmospheric circulation. The austral winter of 2025 (June-August), as well as May, saw a very deep, persistent Amundsen Sea Low which channelled warm northerly winds over the Amundsen and Bellingshausen Seas, explaining the low sea ice extent there (Figure 10); in 2023 this pattern occurred more briefly, early in the freezing season. For much of May and July 2025, the deep Amundsen Sea Low formed part of a 3-wave pattern of high and low pressure around the Southern Ocean which has been very common in recent years and may have exacerbated the recent rapid Antarctic sea ice loss (Schroeter et al., 2024).
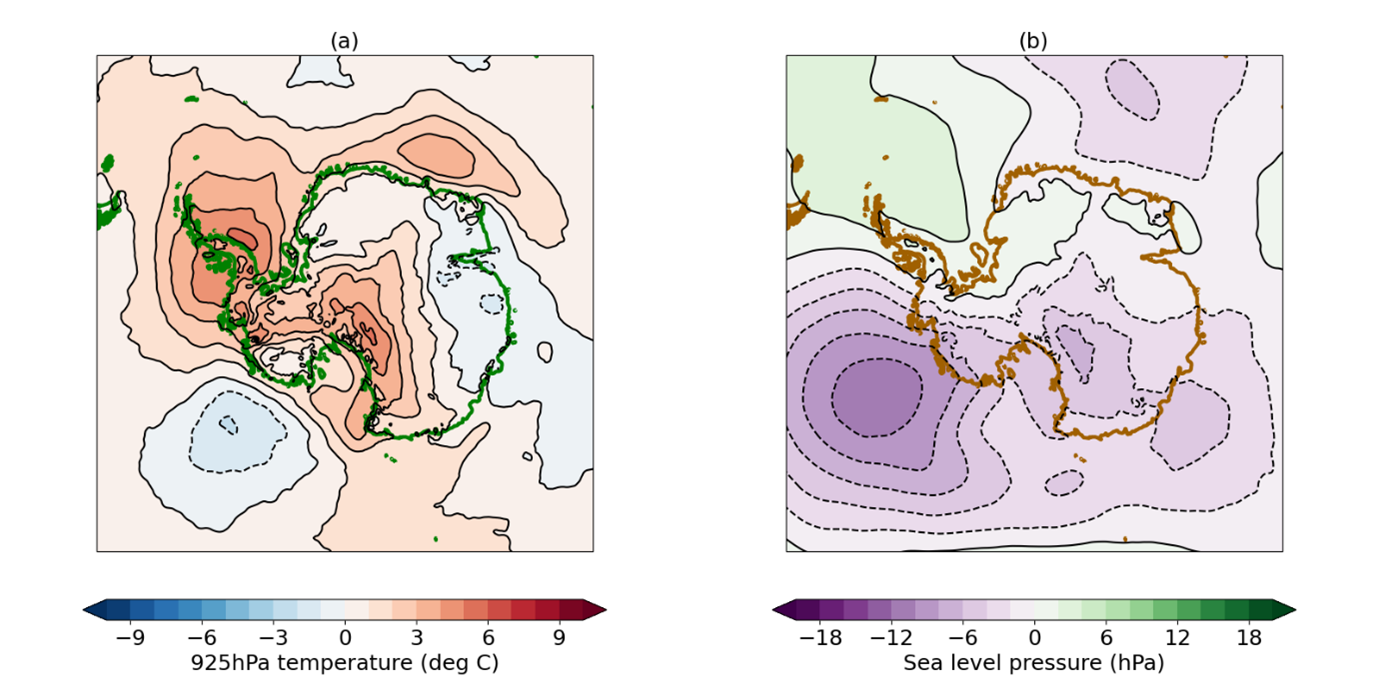
Figure 10. Antarctic May-August 2025 anomaly relative to the 1981-2010 average in (a) 925hPa temperature; (b) sea level pressure. Sea level pressure and temperature data are from the ERA5 reanalysis (Hersbach et al., 2017). The 925hPa temperature represents conditions around 800m above sea level.
References
Hersbach, H. et al. (2017) Complete ERA5 from 1940: Fifth generation of ECMWF atmospheric reanalyses of the global climate. Copernicus Climate Change Service (C3S) Data Store (CDS). https://doi.org/10.24381/cds.143582cf. Date Accessed: 10-10-2025
Lavergne, T. et al. (2023) OSI SAF Sea ice index 1978-onwards, Product OSI-420, Version 2.2, May 2023, Available at: https://thredds.met.no/thredds/osisaf/osisaf_seaiceindex.html. Date Accessed: 11-10-2025
Purich, A. and E.W. Doddridge (2023) Record low Antarctic sea ice coverage indicates a new sea ice state. Commun. Earth Environ., 4, 314. https://doi.org/10.1038/s43247-023-00961-9
Schroeter, S., T. J. O'Kane and P. A. Sandery (2023) Antarctic sea ice regime shift associated with decreasing zonal symmetry in the Southern Annular Mode. The Cryosphere, 17, 701-717. https://doi.org/10.5194/tc-17-701-2023
Tonboe, R., J. Lavelle, R.-H. Pfeiffer and E. Howe (2017) OSI SAF Global Sea Ice Concentration, Product OSI-401-b, Version 1.6, September 2017. Available at: https://osi-saf.eumetsat.int/products/osi-401-b. Date Accessed: 11-10-2025