
Briefing on Arctic and Antarctic sea ice - August 2025
Alex West and Ed Blockley
Summary
- Arctic sea ice extent is 5th lowest on record for the time of year as of 4th August, according to the OSI SAF Sea Ice Index, following near-average ice loss during July
- July saw a mix of weather patterns over the Arctic with the warmest weather in the Kara and Laptev Seas, which also saw the most melt during July. Other areas saw cooler conditions at times
- Uncertainty in September extent remains quite high but there are not yet any indications that a new record low is particularly likely
- Antarctic sea ice extent is 2nd lowest on record for the time of year (after 2023) as of 4th August, according to the OSI SAF Sea Ice Index; average July extent was 3rd lowest after 2023 and 2024
- Extent is particularly low in the Bellingshausen Sea due to persistent warm northerly winds in this region
Arctic
Arctic sea ice state
Arctic sea ice extent on 4th August was 6.65 million sq km according to the OSI SAF Sea Ice Index (Lavergne et al., 2023). This was the 5th lowest extent for the time of year in the satellite era (since 1979), the lowest having been 6.24 million sq km, recorded in 2020. It was 1.59 million sq km below the 1981-2010 average (Figure 1).
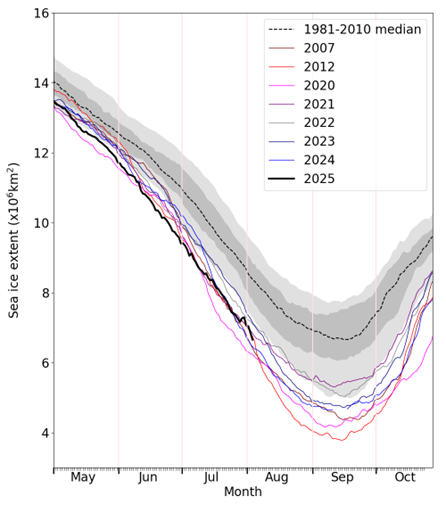
Figure 1. Daily Arctic sea ice extent for 2025, compared with recent years, the notably low ice years of 2007 and 2012, and the 1981-2010 average, with interquartile and interdecile ranges indicated by the shaded areas. Data are from the OSI SAF Sea Ice Index (Lavergne et al., 2023).
During July, sea ice normally begins to melt away from the coast across all of the Arctic Ocean, except for the north coasts of Greenland and the Canadian Arctic Archipelago where sea ice usually remains year-round. As of 4th August 2025, melt had proceeded much faster than average in the Kara and Laptev Seas north of Siberia, such that extent was exceptionally lower than average in these areas. Extent was below average to a lesser degree in the East Siberian, Chukchi and western Beaufort Seas, and above average in the far eastern Beaufort Sea.
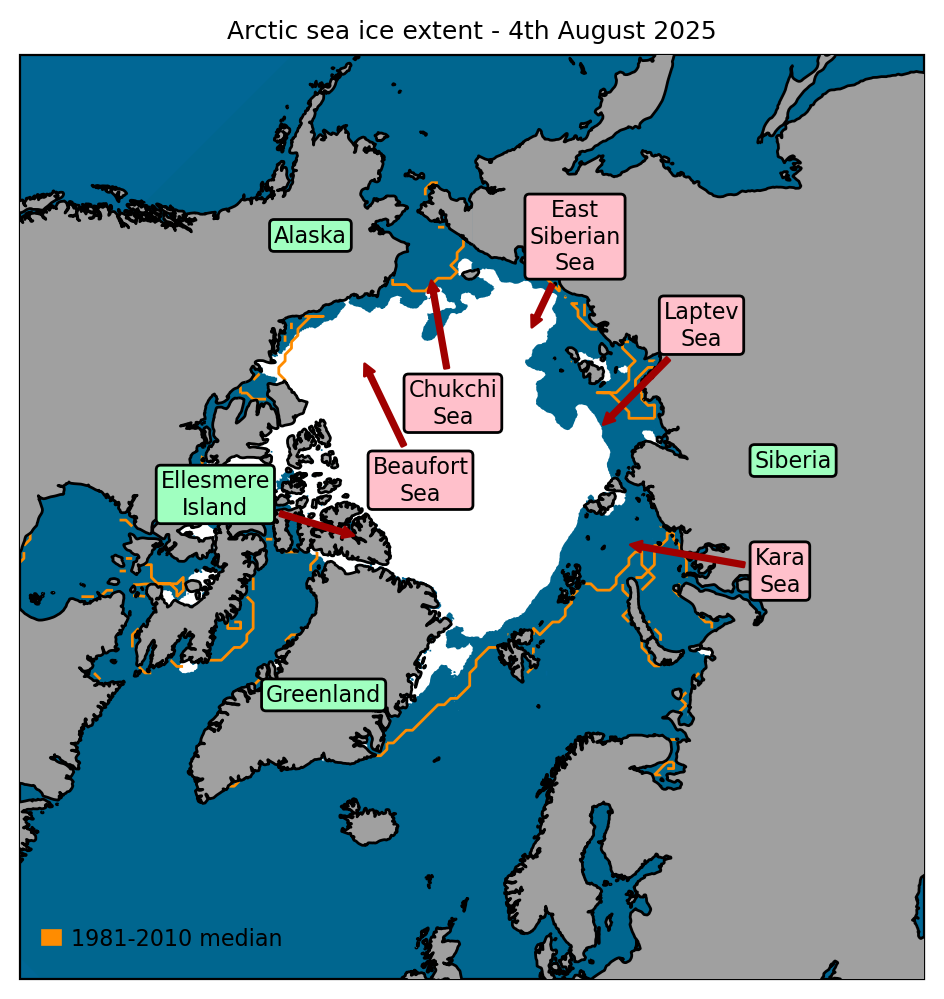
Figure 2. Arctic sea ice extent on 4th August 2025, with 1981-2010 average extent indicated in orange, and the regions referred to in the text labelled. Data are from EUMETSAT OSI SAF (Tonboe et al., 2017).
Arctic: July in context
Average Arctic sea ice extent for July 2025 was 8.26 million sq km according to the OSI SAF Sea Ice Index. This was the joint 3rd lowest July extent in the satellite era and was 1.58 million sq km below the 1981-2010 average, although slightly above the long-term linear trend (Figure 3).
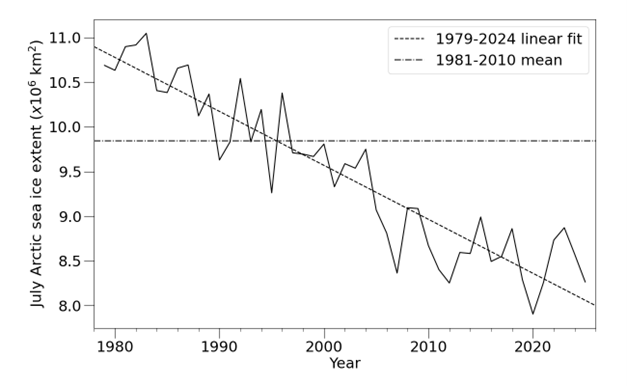
Figure 3. Time series of July Arctic sea ice extent according to the OSI SAF Sea Ice Index (Lavergne et al., 2023), with 1981-2010 average and 1979-2024 linear trend indicated.
The average rate of ice loss for July 2025 was 75,000 sq km per day, slightly slower than the 1981-2010 average of 80,000 sq km per day.
The Arctic in July saw a wide variety of weather patterns. Overall, the Kara and Laptev Seas were warmest relative to average (Figure 4a), consistent with these regions seeing the most melt, and the Atlantic side of the Arctic was stormier than the Pacific side (Figure 4b). For the first week high pressure over Siberia and low pressure over North America channelled the warmest air over the western Siberian seas, while on the opposite side of the Arctic the Beaufort Sea saw cooler conditions. In the second week, Arctic weather was generally cyclonic and cool. From around 16th-25th July, a series of high-pressure ridges brought warmer air into first the East Siberian Sea and then the Laptev Sea. In the final days of the month, the weather turned cool and stormy once again Arctic-wide. Overall, the Kara and Laptev Seas were warmest relative to average (Figure 4a), and it was these regions that saw the most melt.
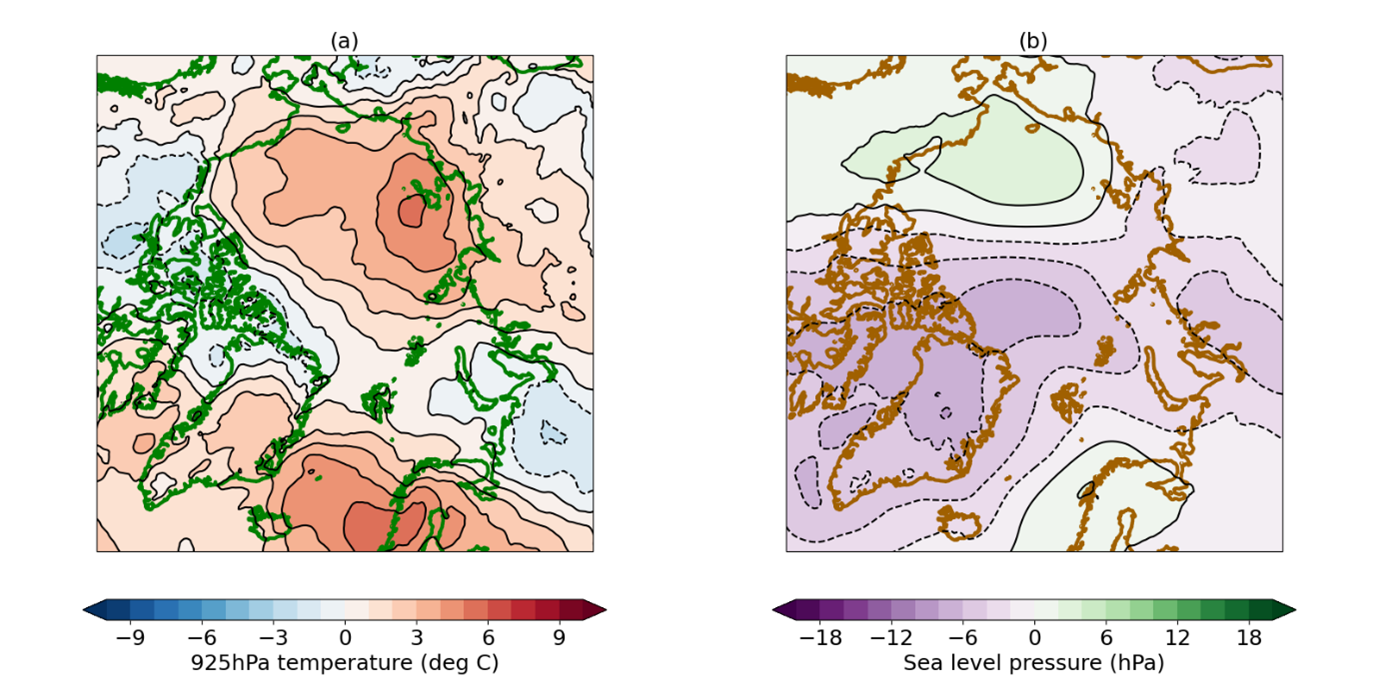
Figure 4. July 2025 anomaly relative to the 1981-2010 average in (a) 925hPa temperature; (b) sea level pressure. Data are from the ERA5 reanalysis (Hersbach et al., 2017).
Arctic outlook for September
Uncertainty in September Arctic sea ice extent remains high as of 3rd August; the average rate of ice loss during August has been highly varied over the past 15 years. However, it is all but certain that September sea ice extent will fall within, or lower than, the post-2007 climatology (3.99 to 5.68 million sq km according to the OSI SAF Sea Ice Index), which is lower than and separate to the pre-2007 September extents (5.71 to 8.25 million sq km). A record low remains possible but there are no indications yet that this is particularly likely.
The uncertainty is encapsulated in our statistical predictions of September extent (Figure 5). Fitting ice melt rate trajectories observed since 2007 to the ice extent on 3rd August produces a range of September extents from 4.02 to 5.48 million sq km. The lower end would indicate a near-record low extent, the higher end an extent near the top of the post-2007 climatology (similar to the relatively high extents in 2009, 2013, 2014, and 2021).
We also estimate a plausible range of September sea ice extents by comparing detrended anomalies in September sea ice extent to those in sea ice extent from 20th July – 3rd August (the most recent 15 days of data available at the time of writing). There is a reasonable correlation between these two timeseries; applying standard statistical methods to this correlation produces a range of September sea ice extents of 4.79 ± 0.66 million sq km. This is nearly identical to the range produced by the melt trajectory method.
During the summer, the Sea Ice Prediction Network collates predictions of September sea ice extent from scientific centres around the world. These predictions are made relative to the NSIDC Sea Ice Index, which on average measures September sea ice extent 0.38 million sq km lower than the OSI SAF Index used in this briefing. Here, and in Figure 5, we add this number to the predictions so that they can be assessed relative to the OSI SAF Index. There were 24 predictions submitted in July: with a range from 4.09 to 5.60 million sq km, these also span much of the post-2007 range in September sea ice extents, although the median prediction (4.65 million sq km) would nevertheless represent the 4th lowest extent on record.
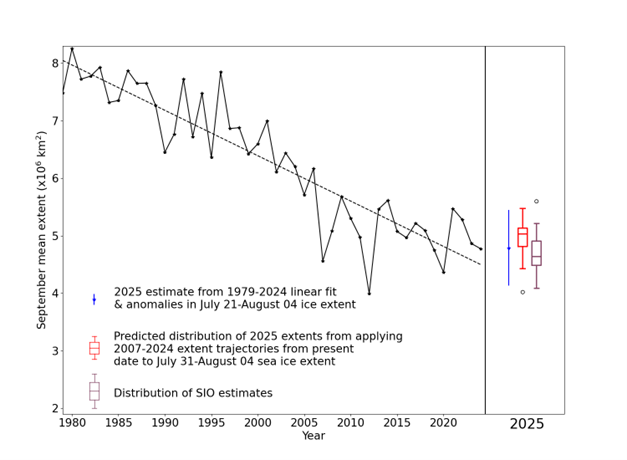
Figure 5. September Arctic sea ice extent since satellite records began in 1979 from the OSI SAF Sea Ice Index (Lavergne et al., 2023) with statistical predictions for September 2025. For the statistical prediction derived from linear fit in blue, error bars represent twice the standard deviation of September mean ice extent about the trend lines with respect to which the estimates are taken. The range of predictions derived from past melting trajectories is shown as a red boxplot indicating range, median and quartiles of estimates derived from all trajectories in the 2007-2024 period.The Sea Ice Outlook is shown as a purple boxplot indicating range, median and quartiles of the 24 predictions submitted, with the average offset between the OSI SAF Sea Ice Index and NSIDC Sea Ice Index added.
Antarctic
Antarctic sea ice state
Antarctic sea ice extent on 4th August was 16.27 million sq km according to the OSI SAF Sea Ice Index. This was the 2nd lowest extent on record for the time of year, the lowest having been 15.42 million sq km in 2023. It was 1.32 million sq km below the 1981-2010 average (Figure 6).
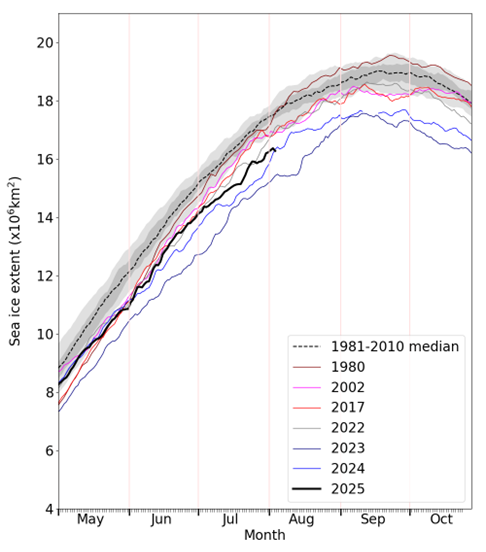
Figure 6. Daily Antarctic sea ice extent for 2025, compared with recent years, selected historic years with low ice cover, and the 1981-2010 average, with interquartile and interdecile ranges indicated by the shaded areas. Data are from the OSI SAF Sea Ice Index (Lavergne et al., 2023).
Extent was below average around most of the Southern Ocean, exceptionally so in the Bellingshausen Sea west of the Antarctic Peninsula, but was slightly above average in the adjoining Amundsen Sea (Figure 7).
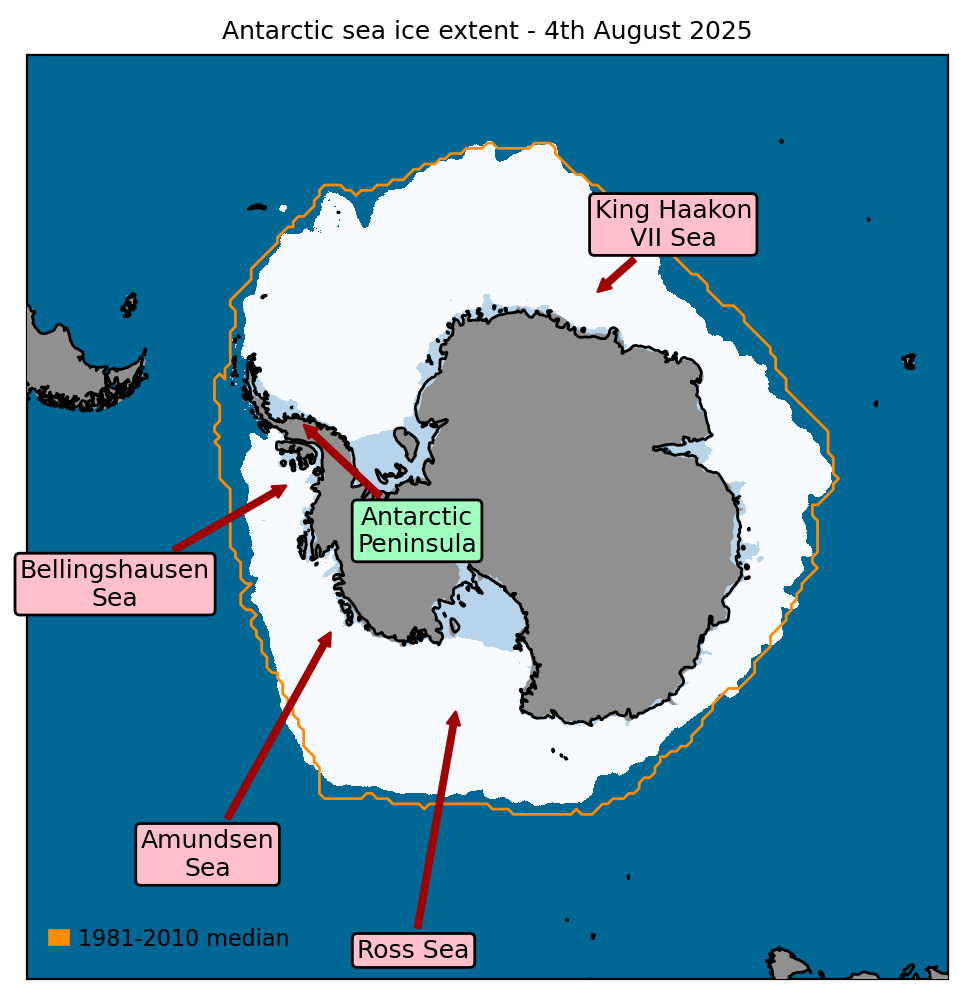
Figure 7. Antarctic sea ice extent on 4th August 2025, with 1981-2010 average extent indicated in orange, and the regions referred to in the text labelled. Data are from EUMETSAT OSI SAF (Tonboe et al., 2017).
Antarctic: July in context
Average Antarctic sea ice extent for July 2025 was 15.07 million sq km according to the OSI SAF Sea Ice Index. This was the 3rd lowest July extent in the satellite era, the lowest having been 13.99 million sq km in 2023. It was 1.26 million sq km below the 1981-2010 average. The average rate of ice growth was, however, very similar to the 1981-2010 average (71,000 as opposed to 72,000 sq km per day).
Southern Ocean atmospheric circulation in July was dominated by a strong low pressure in the Amundsen Sea, bordering an equally strong anticyclone (high pressure system) north of the Ross Sea. Between these systems, cold southerly winds were coincident with the area of above-average ice extent in the Amundsen Sea, while warmer northerly winds occurred on their far sides, in the Bellingshausen and western Ross Seas (Figure 8). On the opposite side of the Southern Ocean, in the King Haakon VII Sea, pressure patterns were more indistinct, and the above-average air temperatures here may have been mainly caused by the previously warmer seas and below-average ice extent.
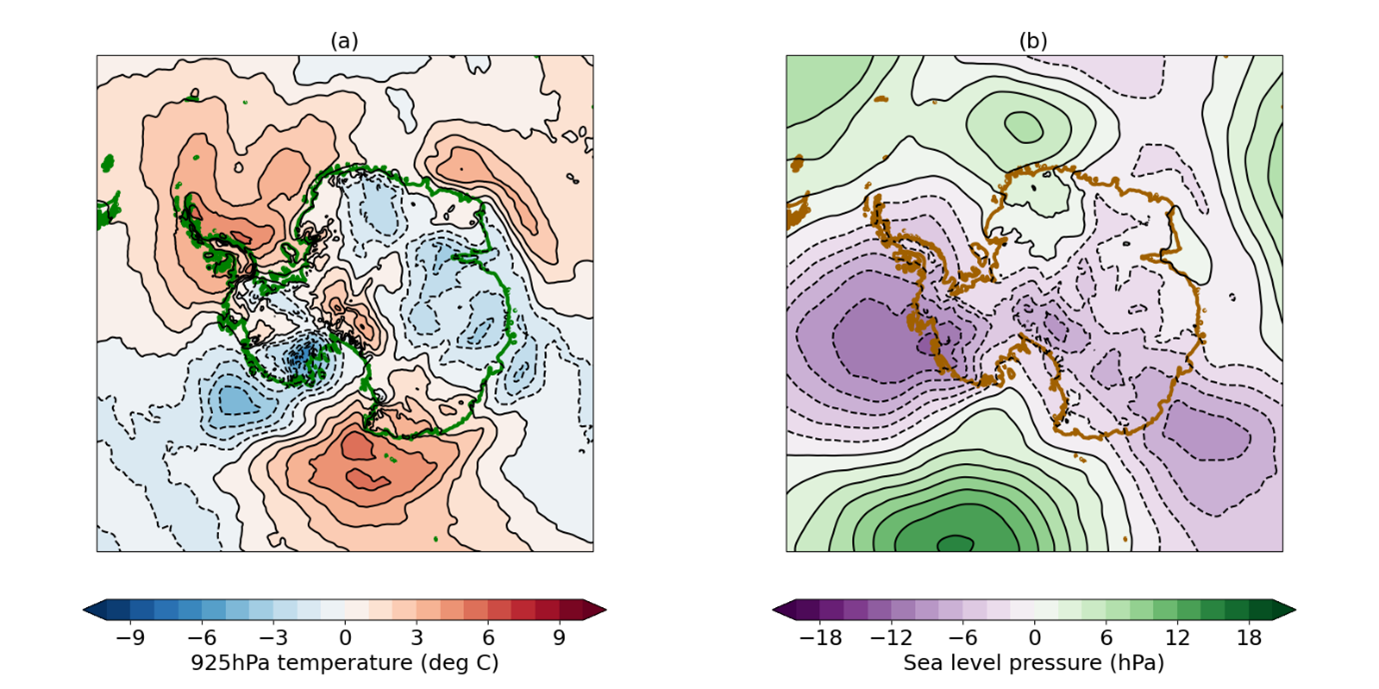
Figure 8. July 2025 anomaly relative to the 1981-2010 average in (a) 925hPa temperature; (b) sea level pressure. Sea level pressure and temperature data are from the ERA5 reanalysis (Hersbach et al., 2017).
References
Hersbach, H. et al. (2017) Complete ERA5 from 1940: Fifth generation of ECMWF atmospheric reanalyses of the global climate. Copernicus Climate Change Service (C3S) Data Store (CDS). https://doi.org/10.24381/cds.143582cf. Date Accessed: 06-08-2025
Lavergne, T. et al. (2023) OSI SAF Sea ice index 1978-onwards, Product OSI-420, Version 2.2, May 2023, Available at: https://thredds.met.no/thredds/osisaf/osisaf_seaiceindex.html. Date Accessed: 05-08-2025
Tonboe, R., J. Lavelle, R.-H. Pfeiffer and E. Howe (2017) OSI SAF Global Sea Ice Concentration, Product OSI-401-b, Version 1.6, September 2017. Available at: https://osi-saf.eumetsat.int/products/osi-401-b. Date Accessed: 05-08-2025