
Briefing on Arctic and Antarctic sea ice - July 2025
Alex West and Ed Blockley
Summary
- Arctic sea ice extent is 2nd lowest on record for the time of year as of 6th July, following well above-average ice loss during June
- Extent is very low on the Atlantic side of the Arctic but nearer average on the Pacific side
- Upper air temperatures were above average in many regions near the ice edge during June, but near or below average in parts of the central Arctic
- Antarctic sea ice extent is 3rd lowest on record for the time of year as of 6th July, with 2023 and 2024 having been 1st and 2nd lowest respectively
- Extent is particularly low in the Bellingshausen Sea, where warm northerly winds have dominated during June
Arctic
Sea ice state
Arctic sea ice extent on 6th July 2025 was 9.13 million sq km (Figure 1). This was the 2nd lowest extent for this time of year in the satellite record (since 1979), after 9.10 million sq km in 2021. It was 1.51 million sq km below the 1981-2010 average.
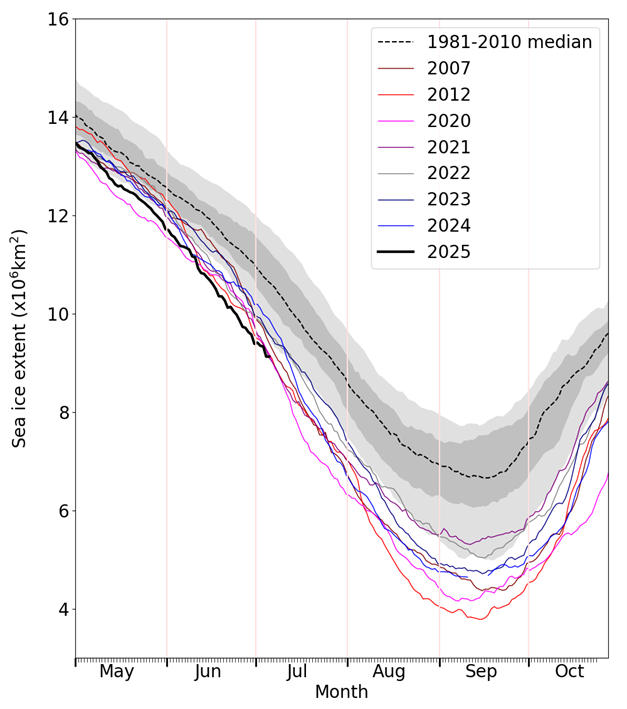
Figure 1. Daily Arctic sea ice extent for 2025, compared with recent years, the notably low ice years of 2007 and 2012, and the 1981-2010 average, with interquartile and interdecile ranges indicated by the shaded areas. Data are from the OSI SAF Sea Ice Index (Lavergne et al., 2023).
Extent was exceptionally below average throughout the side of the Arctic bordering the Atlantic Ocean, including in Hudson and Baffin Bay, and to a lesser degree in the Laptev Sea, where melting had begun early in the first week of June. Extent was nearer average on the side bordering the Pacific Ocean, with large areas of open water not having yet formed as of 6th July (Figure 2).
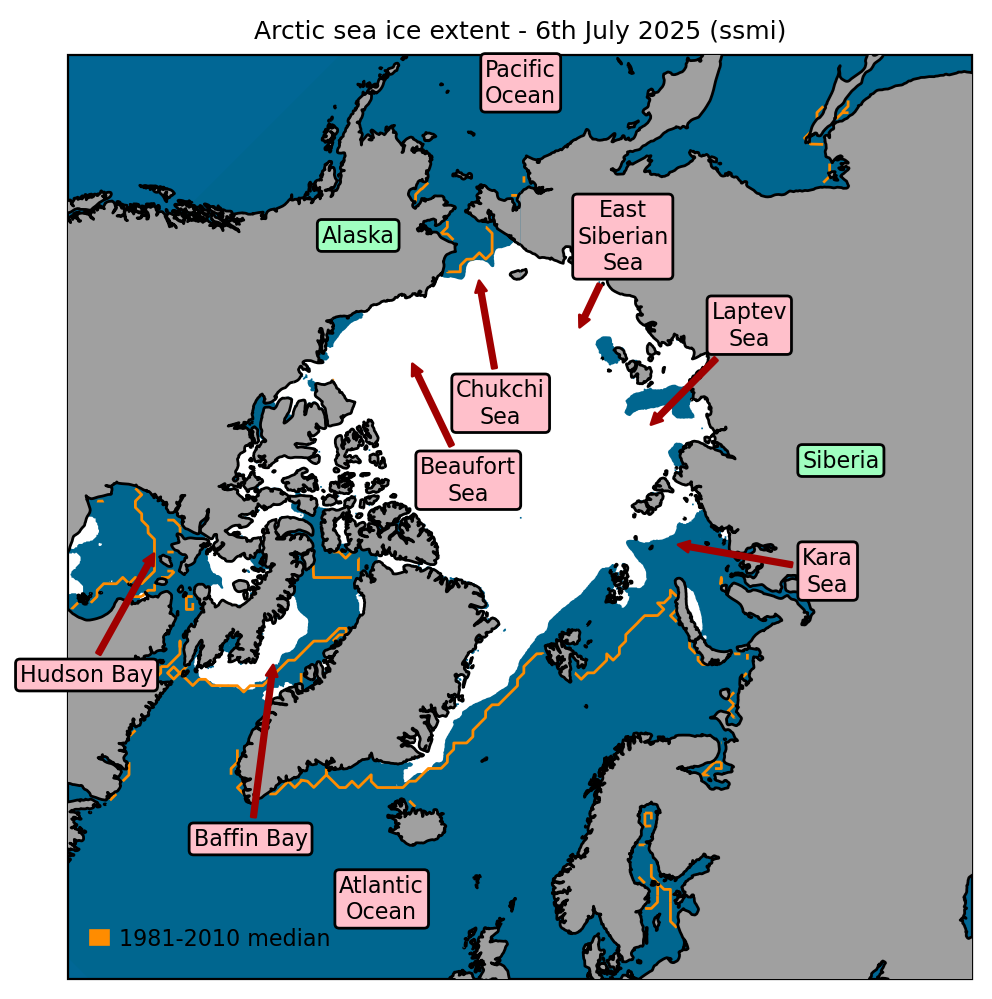
Figure 2. Arctic sea ice extent on 6th July 2025, with 1981-2010 average extent indicated in orange, and the regions referred to in the text labelled. Data are from EUMETSAT OSI SAF (Tonboe et al., 2017).
June 2025 in context
Average Arctic sea ice extent for June 2025 was 10.68 million sq km according to the OSI SAF Sea Ice Index. This was the second-lowest June extent in the satellite record, the lowest having been 10.65 million sq km in 2016. It was 1.17 million sq km below the 1981-2010 average, and very close to the long-term linear trend (Figure 3).
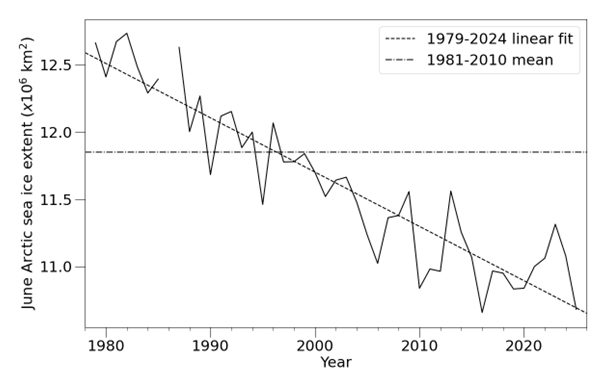
Figure 3. Time series of June Arctic sea ice extent according to the OSI SAF Sea Ice Index (Lavergne et al., 2023), with 1981-2010 average and 1979-2024 linear trend indicated.
Sea ice loss for June 2025 averaged 77,000 sq km per day. This was the 5th fastest rate of ice loss on record for June and well above the 1981-2010 average of 54,000 sq km per day.
June 2025 saw mixed weather conditions over the Arctic Ocean. Two areas saw substantially warmer than average temperatures: the Beaufort, Chukchi and East Siberian Seas on the Pacific side of the Arctic, and the Kara Sea on the Atlantic side (Figure 4a). These areas contain substantial parts of the sea ice edge, and faster than average melting here caused the rapid retreat of ice observed. The warm temperatures were due to persistent high pressure ridges over Alaska and central Siberia, with frequent warm southerly winds to the west of these (Figure 4b). In the Laptev Sea and central Arctic Ocean, temperatures were near or below average.
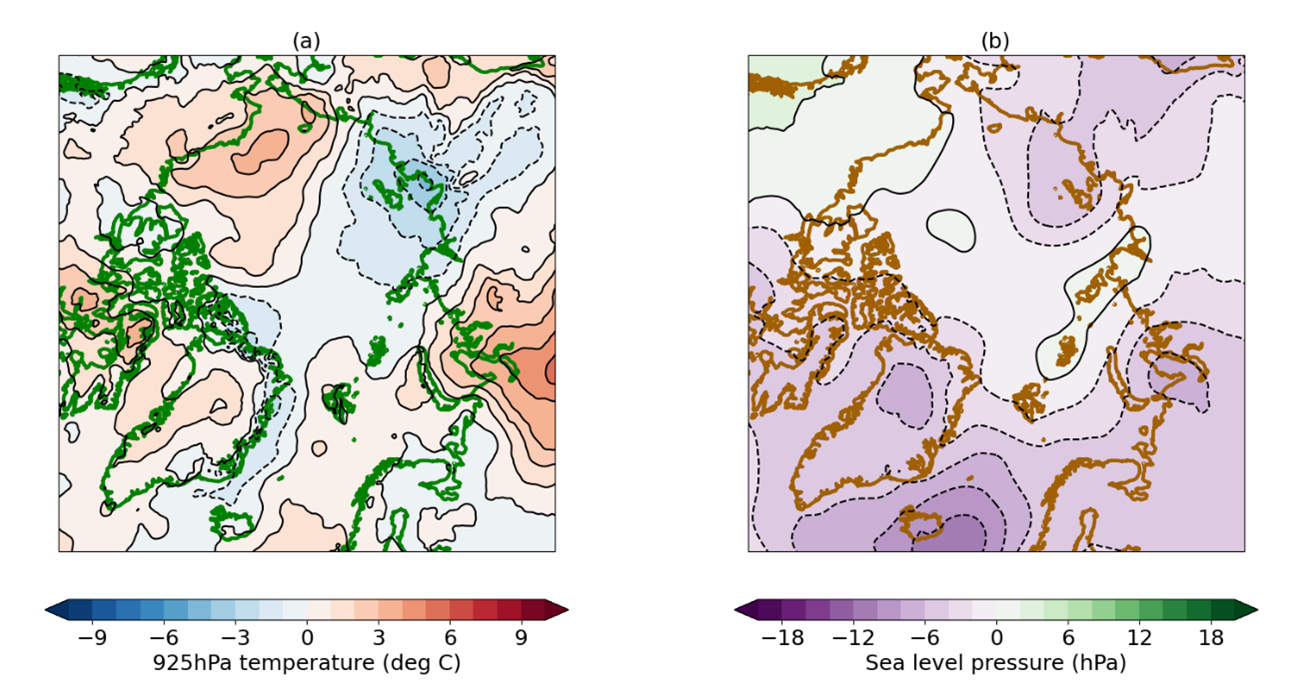
Figure 4. June 2025 anomaly relative to the 1981-2010 average in (a) 925hPa temperature; (b) sea level pressure. Sea level pressure and temperature data are from the ERA5 reanalysis (Hersbach et al., 2017). The 925hPa temperature represents conditions around 800m above sea level.
Outlook for September
At this stage in the melt season the September Arctic sea ice extent remains very uncertain, as melting for the rest of the summer will still be heavily dependent on unpredictable Arctic weather conditions. However, it is very likely that this September’s Arctic sea ice extent will be lower than the pre-2007 record low (5.71 million sq km in 2005 according to the OSI SAF Sea Ice Index) as have all years since 2007.
To predict a plausible range of September Arctic ice extents possible this year, we use two simple methods. Firstly, applying the melting trajectories observed for each year from 2007-2024 to the current extent gives a range of plausible September extents of 3.91 to 5.44 million sq km. Secondly, there exists a significant correlation between ice extent for 22nd June – 6th July and that for September; applying basic statistical methods to this relationship gives a September range of 3.53 to 5.29 million sq km. These ranges both encompass potential new record lows (the current lowest September sea ice extent is 3.99 million sq km) but would also be consistent with a September extent up to the 15th lowest on record, in the upper half of the post-2007 range.
In previous July reports, this section has included estimates from the Sea Ice Prediction Network Sea Ice Outlook, a series of reports that collates estimates of September sea ice extent from scientific centres around the world. For the present year, this information is not available at the time of writing.
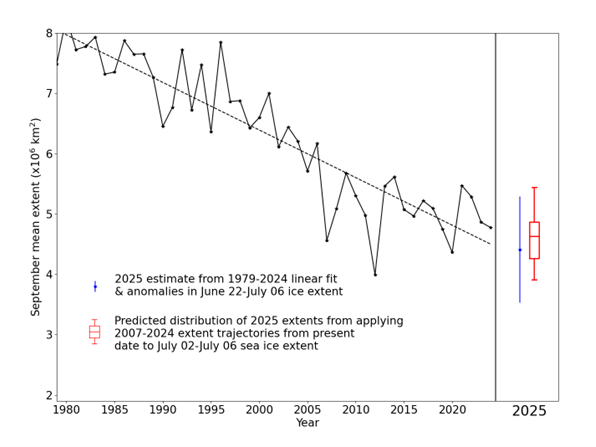
Figure 5. September Arctic sea ice extent since satellite records began in 1979 from the OSI SAF Sea Ice Index (Lavergne et al., 2023) with statistical predictions for September 2025. For the statistical prediction derived from linear fit, error bars represent twice the standard deviation of September mean ice extent about the trend lines with respect to which the estimates are taken. The range of predictions derived from past melting trajectories is shown as a red boxplot indicating range, median and quartiles of estimates derived from all trajectories in the 2007-2024 period.
Antarctic
Sea ice state
Antarctic sea ice extent on 6th July was 14.40 million sq km (Figure 6). This was the 3rd lowest extent for this date in the satellite record, after 12.97 and 14.14 in 2023 and 2024 respectively. It was 1.19 million sq km below the 1981-2010 average.
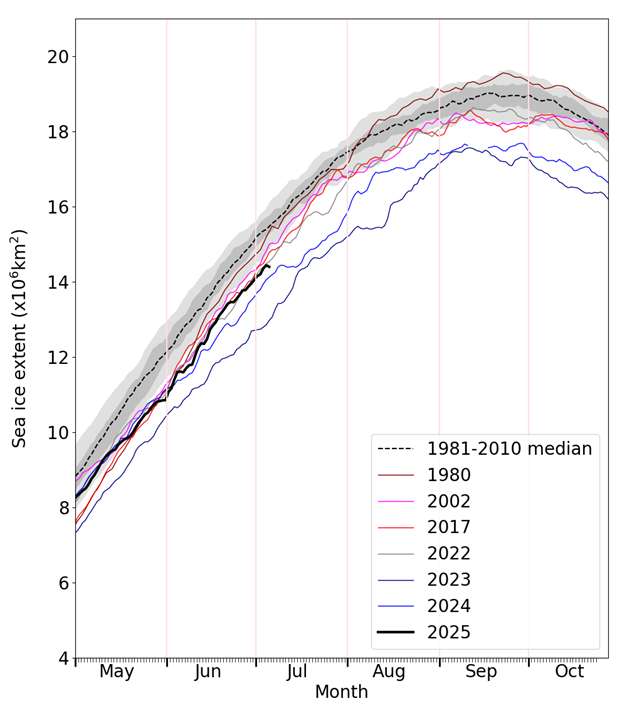
Figure 6. Daily Antarctic sea ice extent for 2025, compared with recent years, selected historic years with low ice cover, and the 1981-2010 average, with interquartile and interdecile ranges indicated by the shaded areas. Data are from the OSI SAF Sea Ice Index (Lavergne et al., 2023).
Extent was very low in the Bellingshausen Sea and King Haakon VII Sea. The rest of the Southern Ocean saw near- or slightly below-average extent (Figure 7).
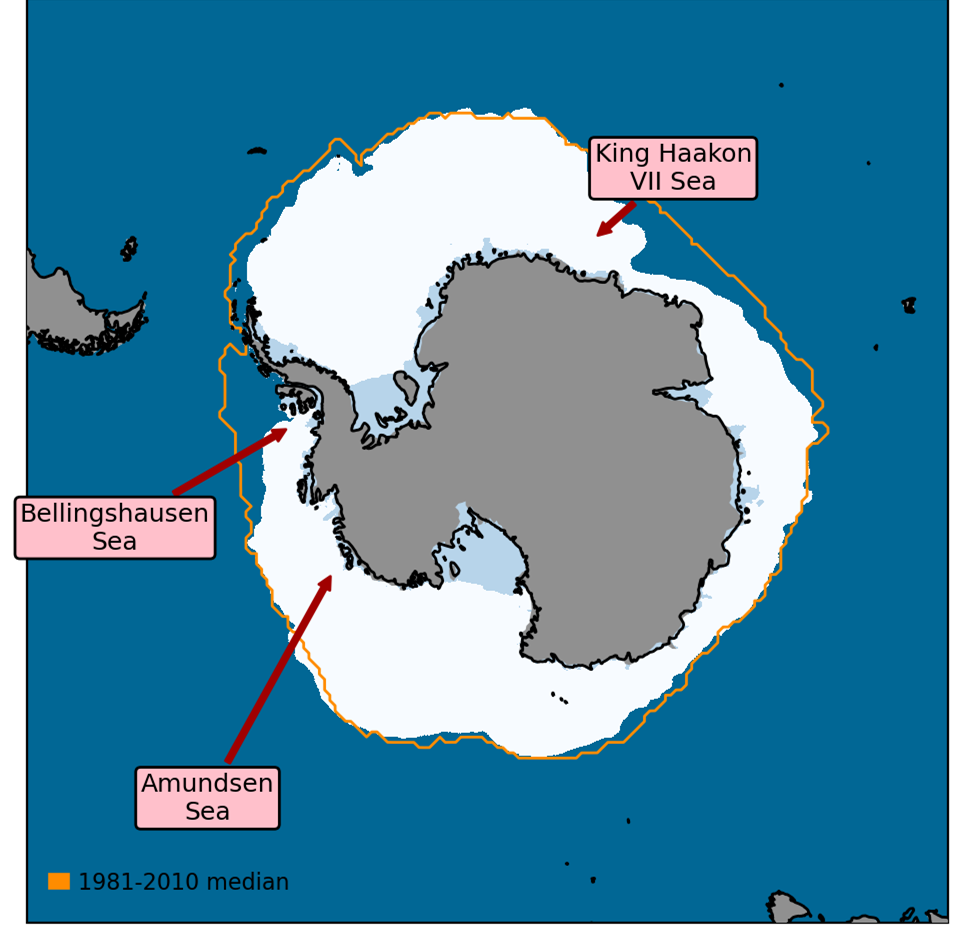
Figure 7. Antarctic sea ice extent on 6th July 2025, with 1981-2010 average extent indicated in orange, and the regions referred to in the text labelled. Data are from EUMETSAT OSI SAF (Tonboe et al., 2017).
June 2025 in context
June 2025 saw a change to the prevailing weather patterns over the Southern Ocean, with the three-wave pattern of high and low pressure of the spring replaced by a two-wave pattern. Particularly warm temperatures in the Bellingshausen Sea (Figure 8a) were driven by a very intense low-pressure system north of the Amundsen Sea (Figure 8b). The warm northerlies and cold southerlies either side of this system likely played an important part in the continuing very low Bellingshausen Sea ice extent, and the recovery in Ross Sea ice extent, respectively.
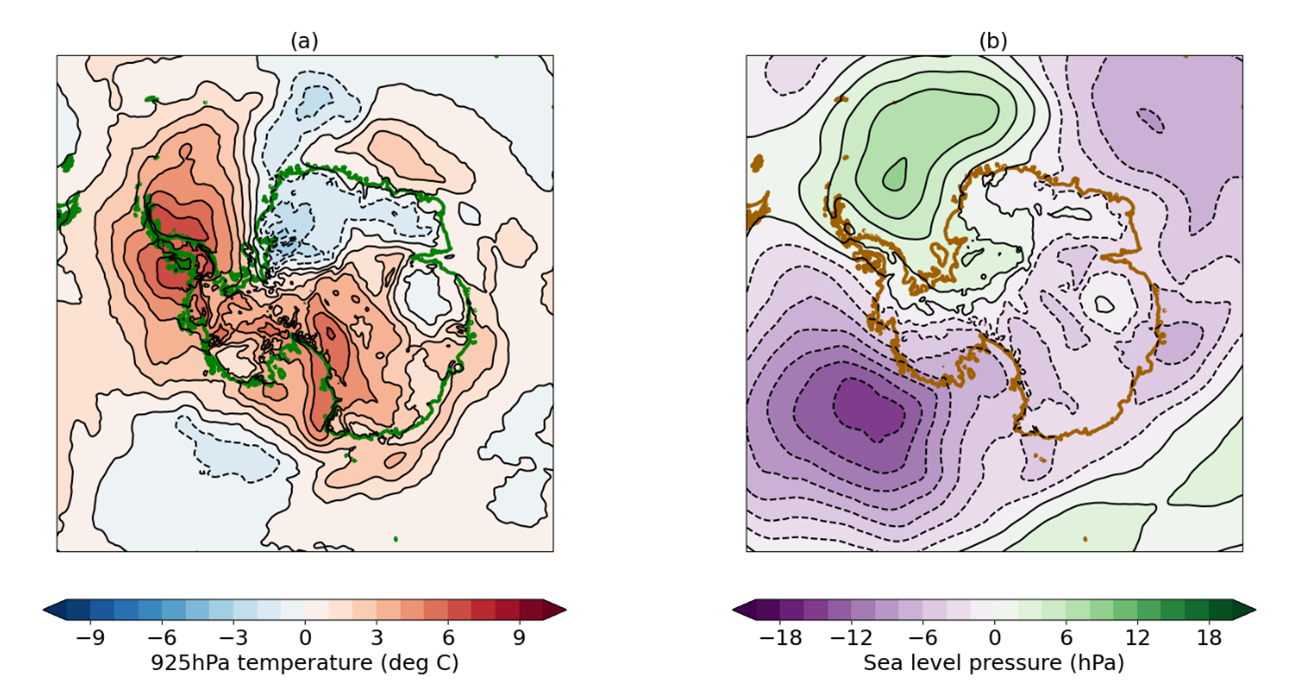
Figure 8. June 2025 anomaly relative to the 1981-2010 average in (a) 925hPa temperature; (b) sea level pressure. Sea level pressure and temperature data are from the ERA5 reanalysis (Hersbach et al., 2017).
References
Hersbach, H. et al. (2017) Complete ERA5 from 1940: Fifth generation of ECMWF atmospheric reanalyses of the global climate. Copernicus Climate Change Service (C3S) Data Store (CDS). https://doi.org/10.24381/cds.143582cf. Date Accessed: 07-07-2025
Lavergne, T. et al. (2023) OSI SAF Sea ice index 1978-onwards, Product OSI-420, Version 2.2, May 2023, Available at: https://thredds.met.no/thredds/osisaf/osisaf_seaiceindex.html. Date Accessed: 07-07-2025
Tonboe, R., J. Lavelle, R.-H. Pfeiffer and E. Howe (2017) OSI SAF Global Sea Ice Concentration, Product OSI-401-b, Version 1.6, September 2017. Available at: https://osi-saf.eumetsat.int/products/osi-401-b. Date Accessed: 07-07-2025