
The North Atlantic Oscillation
The term 'North Atlantic Oscillation' is used by meteorologists to refer to variations in the large-scale surface pressure gradient in the North Atlantic region.
In the average state of the atmosphere, the North Atlantic surface pressure is relatively high in the subtropics at latitudes 20°N to 40°N ('the Azores High'), and lower further North at latitudes 50°N to 70°N (the 'Icelandic Low'). The North-South pressure difference determines the strength of the westerly winds across the Atlantic and is known as the North Atlantic Oscillation (NAO).
When the pressure difference is large, the NAO is positive and the westerly winds are strong and storms tend to be stronger, more frequent and travel across northwestern Europe. When the pressure difference is small, they travel across southern Europe. The NAO is also associated with changes in temperature and rainfall in Europe and North America.
The fluctuations in the NAO occur on a wide range of time-scales. There are day-to-day changes associated with weather systems, and slower changes associated with seasonal and longer term variability, which is predictable from November for the coming winter.
NAO impacts
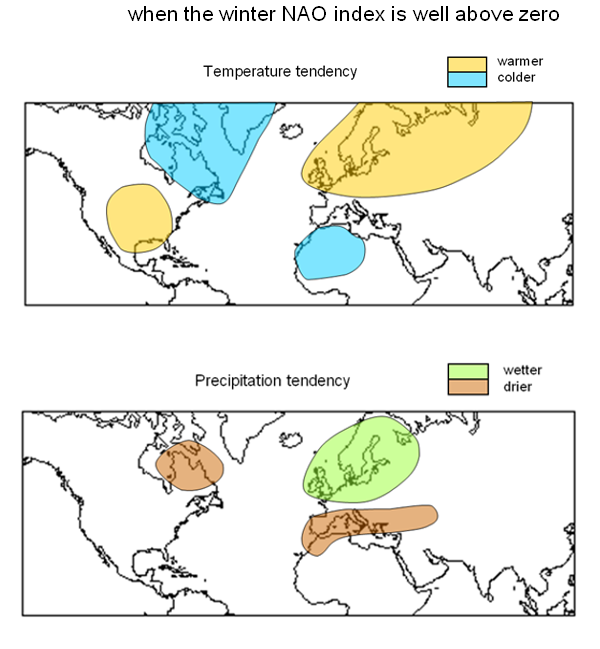
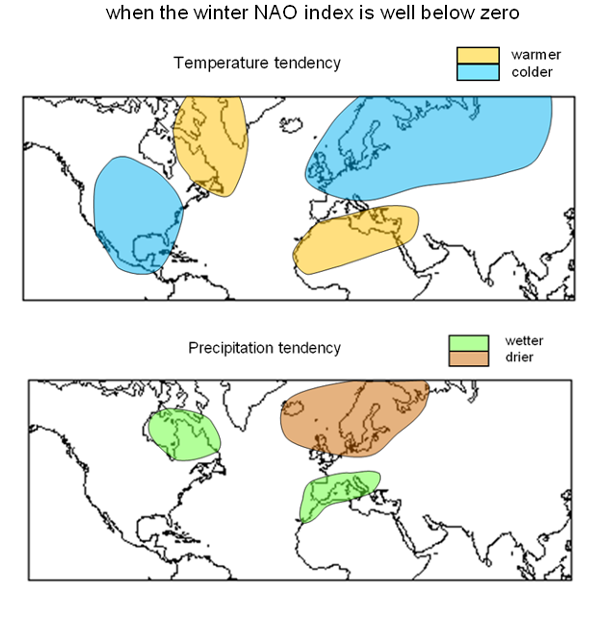
Winter (December-January-February) conditions
When the NAO index is well above normal, there is an increased chance that seasonal temperatures will be higher than normal in northern Europe, northern Asia and South-East North America, and lower than normal in North Africa, North-East Canada and southern Greenland. The patterns for precipitation (rainfall, snowfall) are more localised, with an increased chance of higher rainfall in northwest Europe and lower rainfall in southern Europe. When the NAO index is well below normal, the tendencies are generally opposite. The figures below show where seasonally-averaged temperatures and rainfall are likely to be in the top or bottom one third of observed values, given that the seasonal NAO index is in the top or bottom quarter of observed values.
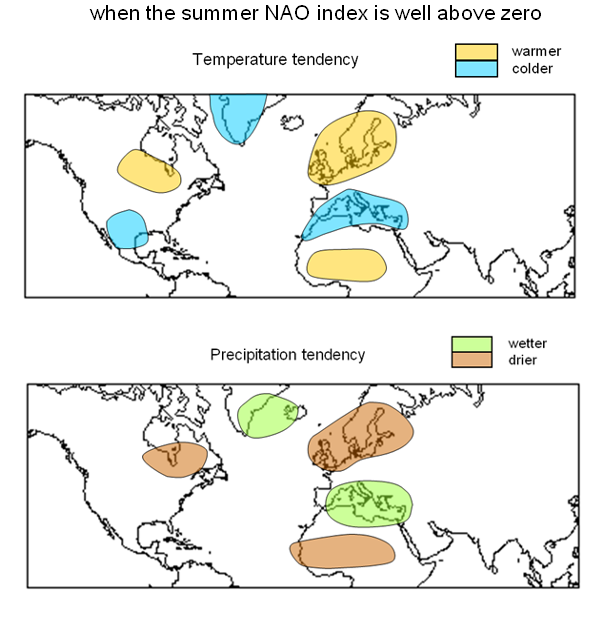
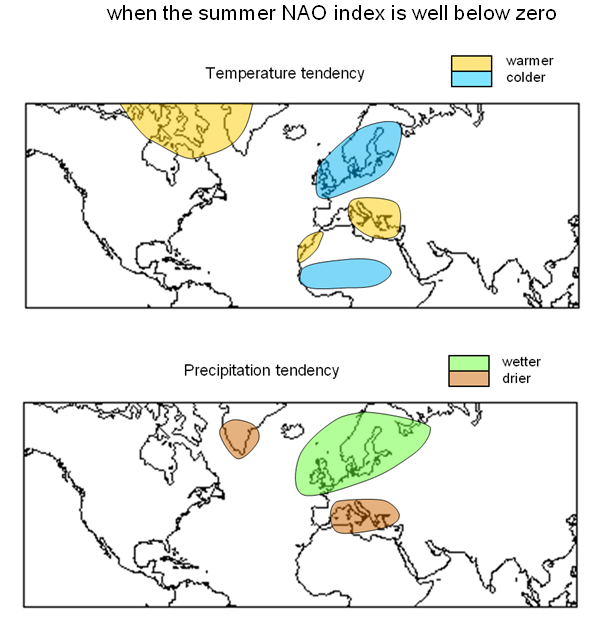
Summer (July-August) NAO conditions
The long-term-average pressure patterns vary with season, the Summer North Atlantic Oscillation index (SNAO) used here represents the strength of a spatial pattern of pressure variability in July-August whose main feature is located over northern Europe and the northern North Atlantic ocean.
When the summer NAO index is well above normal there is an increased chance that temperatures will be higher than normal over North-West Europe, central Canada, North Central USA, and parts of North Africa, and lower than normal over the Mediterranean region, southern USA, North Mexico, and the Greenland region. For precipitation this increased chance is for lower rainfall in North-West Europe, North-East Canada, and the Sahel region of Africa, and higher rainfall in the Mediterranean, and parts of southern Greenland and Iceland. When the SNAO index is well below normal, conditions are mainly opposite in the European sector, with an increased likelihood of north-west Europe being cooler and wetter.
Please note:
- The maps are schematic and the areas marked are not geographically precise.
- These summary maps do not indicate the severity of impacts and the probabilities and magnitudes vary from place to place.
- The maps are based on categorised information. Maps produced using different criteria will have somewhat different features.
Data sources:
For winter the NAO data are from the Hurrell station-based index (monthly values) provided by the Climate Analysis Section, National Center for Atmospheric Research, USA.
The summer NAO index data are provided by the Met Office.
The analyses of temperature and precipitation impacts made use of gridded monthly-average data: temperature and precipitation from CRU TS (Harris et al., 2014) , temperature from the National Centers for Environmental Prediction atmospheric re-analysis, and precipitation from the Global Precipitation Climatology Project.