El Niño Southern Oscillation (ENSO) region sea surface temperature forecasts
Climate centres use several standard regional averages of sea surface temperature anomalies as indices to monitor the state of the equatorial Pacific ocean, especially anomalous warming/cooling associated with El Niño and La Niña
The diagrams below illustrate these indices as observed in recent months (in black), and the evolution predicted by the Met Office dynamical long-range ensemble forecast system (in red).
For each of several regions of the equatorial tropical Pacific the forecast graphs (called plume diagrams), show the predicted area average of monthly mean sea-surface temperature anomaly for each member of the ensemble forecast (red lines). The observed sea surface temperature anomaly for the six months preceding the forecast is also shown (black line).
Plume diagrams are provided for regions Niño3 (5° S-5° N, 150° W-90° W), Niño3.4 (5° S-5° N, 170° W- 120° W) and Niño4 (5° S-5° N, 160° E-150° W). These areas are commonly used for monitoring the anomalous warming and cooling in sea-surface temperature in the equatorial tropical Pacific associated with El Niño and La Niña. In particular, Niño3.4 is a commonly used indicator for the likely impact of El Niño and La Niña events on associated widespread global climate variability around the globe.
El Niño, La Niña and the Southern Oscillation Description
Such events are a consequence of strong and extensive interactions between the ocean and atmosphere. They are associated with widespread changes in the climate system that last several months, and can lead to significant socio-economic impacts affecting infrastructure, agriculture, health and energy sectors for example.
The name 'El Niño' nowadays is widely used specifically for the anomalous sustained warming of sea surface temperature that occurs every few years, typically concentrated in the central-east equatorial Pacific. 'La Niña' is the term adopted for episodes of cooler-than-normal sea surface temperature in the equatorial Pacific.
These episodes alternate in an irregular inter-annual cycle called the ENSO cycle. 'ENSO' stands for 'El Niño Southern Oscillation', where 'Southern Oscillation' is the term for atmospheric pressure changes between the east and west tropical Pacific that accompany both El Niño and La Niña episodes in the ocean. The name 'ENSO' is a reminder that close interaction between the atmosphere and ocean is an essential part of the process. While the global climate system contains many processes, ENSO is by far the dominant feature of climate variability on inter-annual timescales.
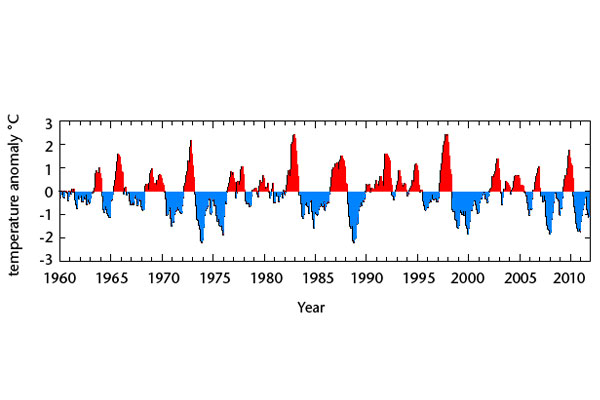
The ENSO cycle is illustrated in the figure by a time-series of the monthly sea surface temperature anomalies in a region of the central equatorial Pacific. This 'Niño3.4' region (5°S-5°N,120°W-170°W) is one of several used to monitor changes in the tropical Pacific. Definitions vary, but as a guide the El Niño and La Niña episodes occur when anomalies in this region are larger than about 0.5 °C in magnitude for several months. While a typical episode might last for three or four seasons, peaking in size in boreal winter, the time-series demonstrates that events are not entirely regular and have various sizes and durations. The climate system does not always simply alternate between El Niño and La Niña: the same type of event can occur successively or be sustained over several years.
The ENSO cycle is a natural climate phenomenon; proxy evidence (e.g. coral growth rate measurements) indicates that ENSO has been active for thousands of years.
What causes El Niño and La Niña events?
The cycle is the consequence of slow feedbacks in the ocean-atmosphere system acting alongside the strong air-sea interaction processes in the tropics that allow the growth of small disturbances to the large-scale ocean state.
Normally the equatorial Pacific Ocean has a pool of relatively warm water in the upper ocean in the west and a shallower layer of relatively cool water in the east, maintained by and in balance with easterly surface winds. The well-mixed upper ocean layer (a few tens of metres deep) lies above a thin 'thermocline' layer, with cold water below.
An El Niño event can start in several ways, usually with the sea surface temperature raised slightly in the central/east Pacific. This may be, for example, through the action of 'westerly windbursts' (short-lived storm-like events in the Western Pacific) that disturb the 'balance' maintained by easterly winds, or through slow evolution of the ocean thermocline as a consequence of a previous event. The increased sea surface temperature influences the atmospheric winds, which in turn influence the upper ocean and the thermocline such that the sea surface temperature is increased further - a positive feedback. When conditions are favourable, this feedback generates an El Niño event.
A La Niña event can arise similarly. El Niño and La Niña events are self-limiting, evolving in such a way that the equatorial sea surface temperatures gradually return to normal and the event ends after several months. Often the system overshoots, to start the opposite phase of the cycle rather than just return to neutral conditions.
ENSO prediction
An important feature of the ENSO cycle is that its evolution is predictable several months in advance, so the impacts can be anticipated and decisions can be made to mitigate adverse effects or take advantage of favourable effects. Predictions of the effects of an ENSO event that is initiating or in progress are best based on forecasts that take into account all known details of the recent and present state of the climate system.
ENSO Impacts
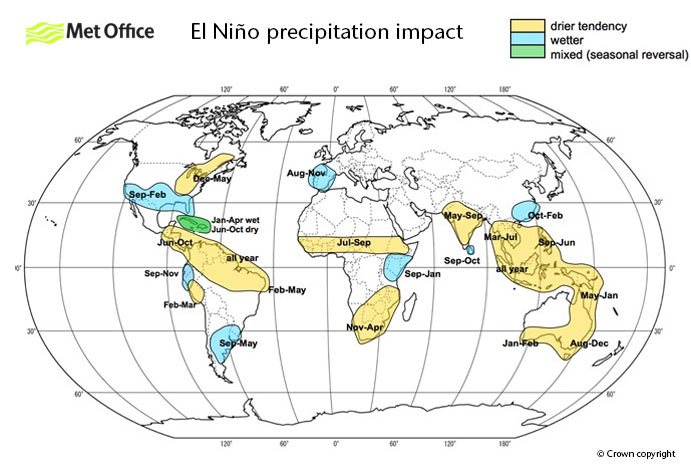
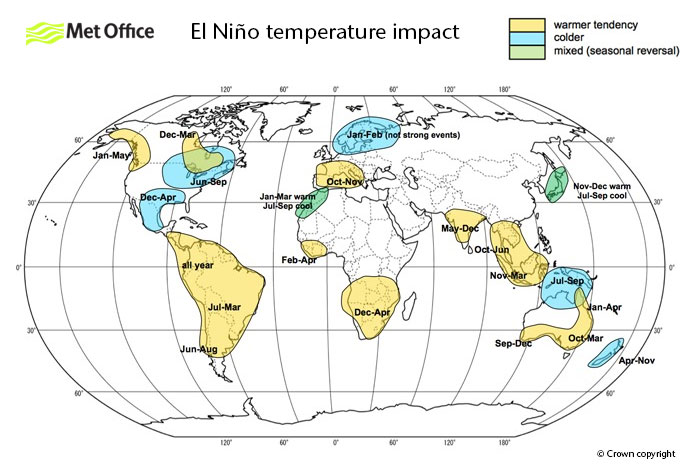
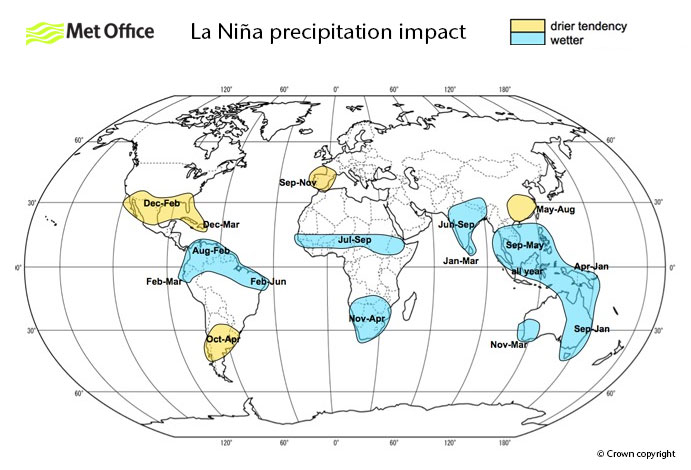
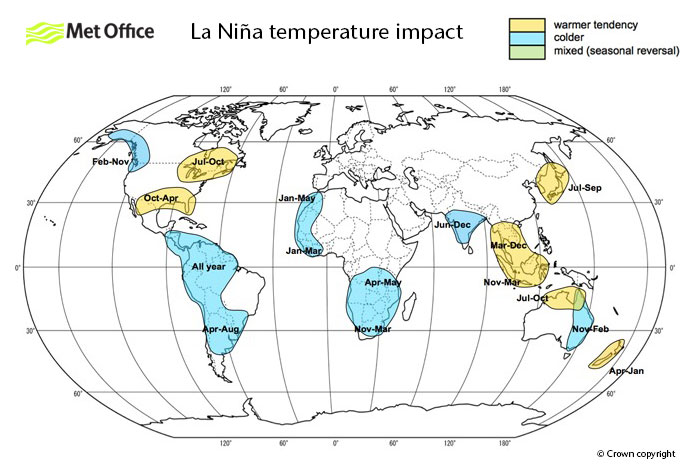
ENSO events have widespread effects on seasonal weather and climate through their influence on large scale circulation patterns. The maps provided below summarise the main impacts on seasonal precipitation and near-surface temperature over land areas for El Niño and La Niña events. For each region marked, the colour indicates the tendency and the text indicates the seasonality of the impact. The maps are based on analyses of historical datasets extending over several decades and on information in peer-reviewed publications. Details of the analyses and of the regional probabilities are available in Davey et al (2013).
For temperature the regions selected are areas where a substantial impact is likely, in the sense that the seasonal value will be in the top (or bottom) one third of observed values centred on the months indicated, with approximately a greater than 50% chance that the impact will occur if the ENSO event is active, based on historical evidence. For example, for a region marked 'warmer likely' in December in El Niño conditions, this means approximately a greater than 50% chance that the temperature will be in the top third of temperatures observed in the November-December-January season. The criterion for El Niño (La Niña) active is Niño3.4 regional sea surface temperature in the top (bottom) 25% of observed values in the corresponding seasons. For precipitation, for which data are more limited and probability estimates are more uncertain, analyses of composites were also used to determine regions and seasons that tend to be influenced by ENSO events.
Each ENSO event is different, and occurs in conjunction with other climatic events. Not all impacts occur in all events, and impacts may not be confined to the regions indicated. Thus these maps should not be regarded as forecasts for a current event, but rather as an indication of areas where impacts are likely, based on historical evidence.
Please note:
The maps are schematic and the areas marked are not geographically precise. There are seasonal shifts in the locations of impacts that are not fully represented.
Recent research has suggested that there are two main subtypes of ENSO. The terminology varies, but the names Central Pacific (CP) and East Pacific (EP) indicate variations in the location of equatorial sea surface temperature anomalies. The impact maps combine the effects of both types: thus in regions where CP and EP events have contrasting effects the net impact may be reduced, and there may be separate CP and EP impacts that do not appear here.
Some regions have, for example, an El Niño impact but not a La Niña impact: thus while the El Niño and La Niña maps have many areas in common, usually with opposite impacts, there are several differences.
Some regions may expect different impacts in differing seasons during an ENSO event, as indicated by overlapping areas of impact. This is a consequence of interactions of ENSO with the regional seasonal cycle.
Some regions have impacts that depend on the magnitude of events. For example, the North European (Baltic) region included on the El Niño map is marked as a cold impact, but very strong El Niño events (e.g. 1997/98, 1982/83) have an opposite warm impact. A comment is included in the text on the map.
Observational data coverage varies substantially geographically. There may be some regions with a distinct impact that are not revealed by the analyses.
These summary maps do not indicate the severity of impacts. The probabilities and magnitudes vary considerably from region to region.
The impact areas marked depend on the selection criteria, and maps that use other criteria such as composites and correlations will differ. Further, the ENSO event selection includes weak events, and restriction to moderate and strong events would alter the areas of impact.
Data sources
Our analyses for the temperature impact maps made use of monthly-average near-surface land temperature data from the National Centers for Environmental Prediction atmospheric re-analysis (1948-2011) and the CRUTEM4 gridded observational analysis (1850-2010).
For the precipitation impact maps, our analyses made use of the University of East Anglia Climatic Research Unit 1900-1998 monthly precipitation dataset and the Global Precipitation Climatology Project 1979-2010 monthly gridded precipitation dataset.