
Charts
The chart collection is held at the National Meteorological Archive in Exeter.
Meteorological charts are mostly contained in bound volumes and vary in size but are rarely smaller than A1. The frequency with which they were produced varies depending on the type of chart but at a minimum there will be one chart per day and usually at least four. By their nature charts are generally drawn to show a large area and therefore the UK will usually only appear as a relatively small part of a larger whole. Charts have been produced for a wide variety of purposes and cover a range of areas. The majority of the charts are synoptic charts (these show the position of weather fronts and other weather systems) but charts can also show other elements such as sea temperature and sea ice.
The main chart series are as follows:
(i) Synoptic working charts
This is the main chart series and generally shows northern Europe including the UK and parts of the north Atlantic but occasionally includes more of the northern hemisphere. The synoptic working charts are the longest unbroken chart series held by the office and originals are held from 1871 to 2003 when paper copies ceased to be produced.
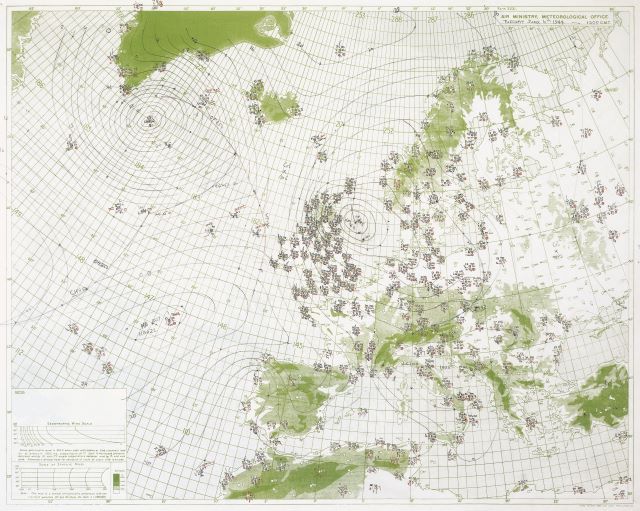 Example of a synoptic working chart
(ii) British Isles
This series focuses in more detail on the British Isles but may be less useful because it does not show the weather systems approaching. The synoptic working charts (above) although showing the British Isles in less detail are usually more helpful. The series runs from October 1940 to August 2003 when paper copies ceased to be produced.
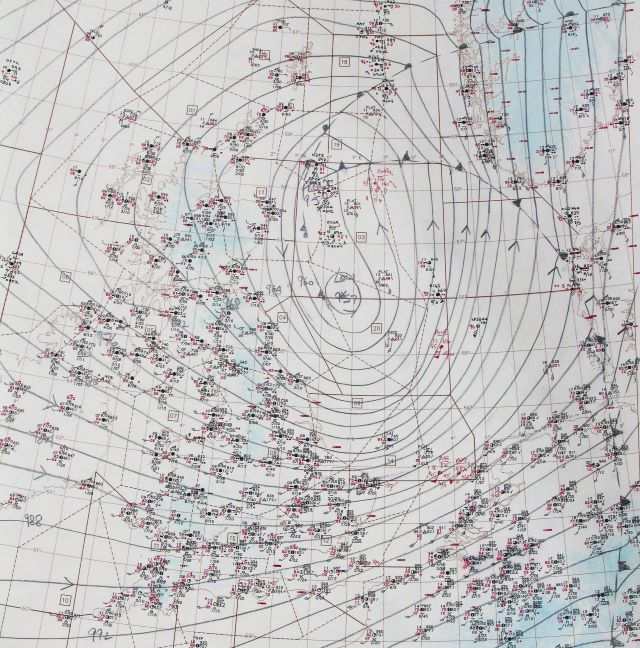
Example of a British Isles chart.
(iii) ASXX charts (Actual Surface Analysis Charts)
These charts provide the observed pressure information and position of fronts and are produced every six hours. They provide a graphical representation of the weather without the addition of plotted data and are most useful for general research into the weather situation on any given day. The series runs from 1995.
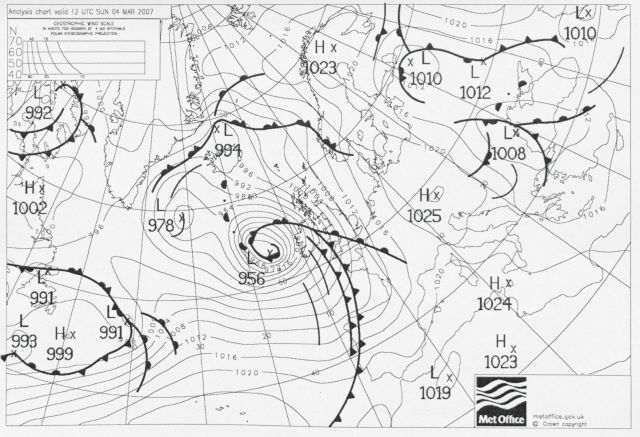
Example of an ASXX chart
(iv) Northern Hemisphere, Southern Hemisphere
These charts are the best way to investigate the weather in a location outside of northern Europe and include the Polar regions. The Northern Hemisphere series runs from July 1922 to August 2003 and the Southern Hemisphere series runs from March 1982 to August 2003 when paper copies ceased to be produced.
(v) Upper air charts
This series is largely held on microfilm. These charts provide information on pressure, temperature and weather systems at levels in the upper atmosphere and can be useful if researching particular weather events or meteorological factors relating to aviation. The series runs from January 1943 to May 2000. Upper air charts and data can also be found in the upper air section reports later known as the daily
aerological records (DARs) which is a series that follows a similar format to the daily weather report and cover the period 1919 to 1980.
(vi) Sea-ice charts
These charts show sea surface temperature, the position of pack ice and the limits of various other ice types. The series runs from January 1966 to January 1997.
(vii) Sea-surface temperature charts
These tend to cover the area around the UK. The series runs from December 1964 to January 2004.
Most useful for
Charts are most useful for a graphical illustration of the weather situation on any given day. The British Isles charts, although smaller in area, can sometimes be hourly and can therefore add to the picture if you are researching a specific day or weather event.
Things to be aware of
The charts above show actual observations as opposed to forecasted data. The chart volumes are almost without exception extremely large and heavy. You may need to ask for assistance when moving them and due to their scale only a relatively small number can be provided at any one time.
Almost without exception the charts will contain plotted station observations which you will need assistance to interpret. You should also note that the method of plotting also changes over time.
Factsheet 11 “Interpreting weather charts” will help you to decode observations from all of the periods covered. You may also need assistance to interpret some of the more specialist charts such as the Upper air charts.
Our factsheets are available for free at: www.metoffice.gov.uk/learning/library/publications/learn