Daily weather summaries
The daily weather summaries are brief accounts of the weather as published by the Met Office
We have duplicate copies in the library and the archive and the series has also been scanned. The summaries have changed in both name and format over time and were originally known as the ‘Daily Weather Report’ until December 1980 when they were renamed the ‘Daily Weather Summary’.
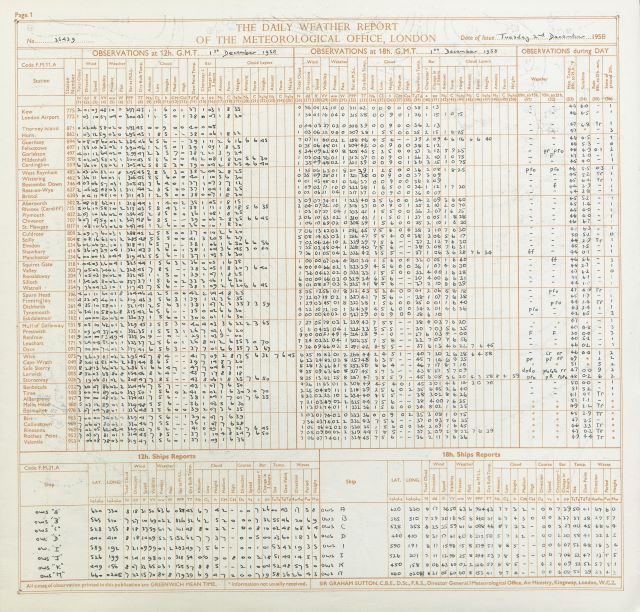
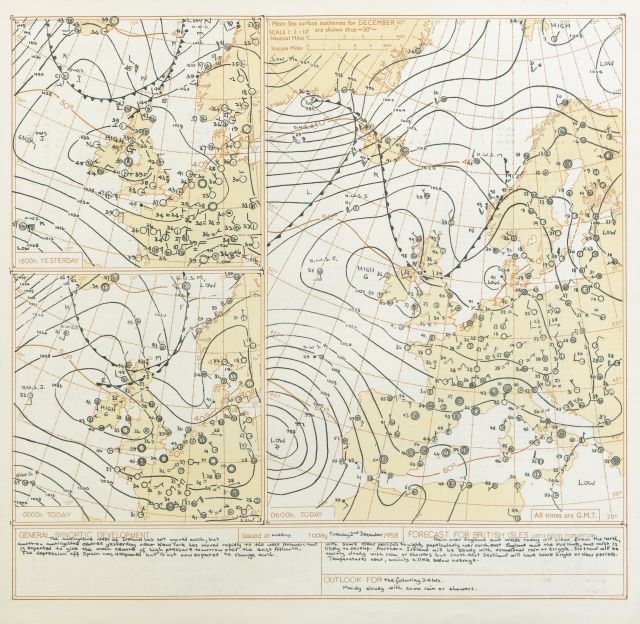
In general they will contain a synoptic chart of the UK showing the weather situation, a textual description of the weather during the day and other information indicating daily extremes of temperature, rainfall and sunshine. For much of the series the information also includes ‘selected station’ data which provides temperature, rainfall, visibility, pressure, wind direction and force, sunshine (where available) and weather
for a number of stations around the UK. Daily weather summaries for the period up to 1980 also contain a brief written summary of the forecast for the following day and an outlook for the 24 hour period after this.

Example data page from daily weather summaries.

Example chart page from daily weather summaries.
Most useful for
The summary is most useful for a quick and accessible way to see the predominant weather situation over the UK on any day from September 1860 onwards. If you are interested in a specific location there is also often data to indicate the general weather conditions at a site relatively close by.
Things to bear in mind
From March 1960 the information provided in the selected stations section is written in code and you will need an aid in order to understand what it means. Do not panic there is a thorough explanation which will enable you to decode the information in the ‘Introduction’ pages which can be found at the start of each quarter e.g. for April–June 1960 look at the start of April. With this decode it should be reasonably
straightforward to interpret the numbers. For the period before March 1872 there are no charts and you will only be able to see data.
The summaries were generally produced ahead of any quality control (QC) input and therefore the data values you see may differ from values quoted later on in other publications or databases. The early summaries did often include some corrections in a supplement and sometimes you may see red ink where an entry has been amended but for the majority of summaries the data is the first cut prior to any QC. This remains the case for the summaries that are currently produced. The summaries have been scanned and are available to view in the Observations collection in our Digital Library and Archive


