Arctic Sea Ice in 2015
Research news article published in September 2015.
In September, as the sun starts to set over the Arctic, the annual cycle of summer sea ice melting draws to a close. As the influence of the Sun's rays decreases, the ocean surface cools, the sea begins to freeze once again and the sea ice cover expands. When quantifying the amount of sea ice present in the Arctic, scientists normally use a measure known as sea ice "extent" which is defined to be the total area of ocean that contains sea ice with concentration above 15%. Knowledge of the minimum September sea ice cover can provide information on the relative warmth of the Arctic summer each year. Meanwhile year-to-year changes in the minimum extent are a visible indicator of how climate conditions are changing in the Arctic. Therefore declaration of the annual September sea ice minimum is an interesting time for climate scientists and weather forecasters alike.
The 2015 September minimum
This summer, the sea ice cover reached its minimum extent for the year of 4.41 million km2 on 11th September 2015. This is the 4th lowest Arctic sea ice extent recorded since sea ice satellite measurements of sea ice began in 1979, and witnesses an ongoing steady decline of the summer sea ice cover, in which the minimum extent has decreased at a rate of 830,000 km2 per decade. The 2015 minimum contrasts both to the recent summer of 2012, which saw exceptional sea ice melt and by far the lowest minimum extent ever recorded, and with the intervening summers of 2013 and 2014, which saw much more muted sea ice melt (although still very extensive compared to earlier decades). This can be clearly seen in Figure 1 which shows Arctic sea ice minimum extent for each year since satellite records began in 1979. A linear trend, a straight line through the annual values, has been added to the figure as the dashed line.
Trend in Minimum Arctic Sea Ice Extent
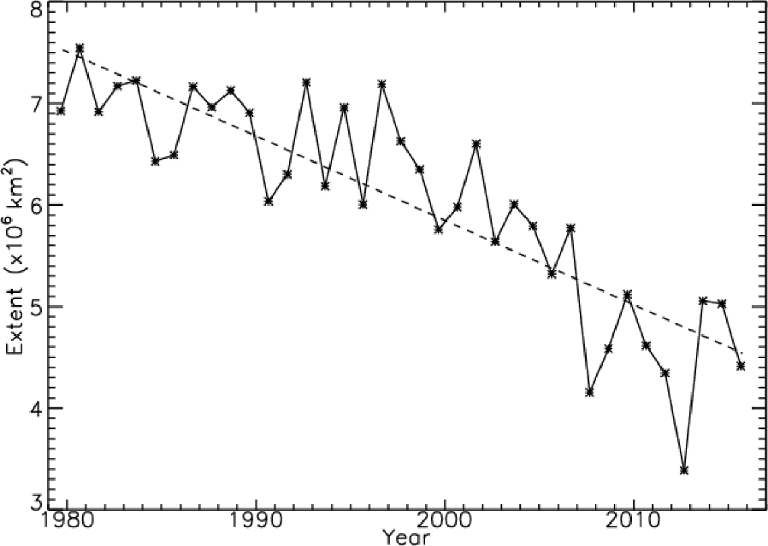
Figure 1:Annual minimum Arctic sea ice extents observed by satellites from 1979-2015. (Source: US National Snow and Ice Data Center.)
Minimum Arctic Sea Ice Extent in 2015
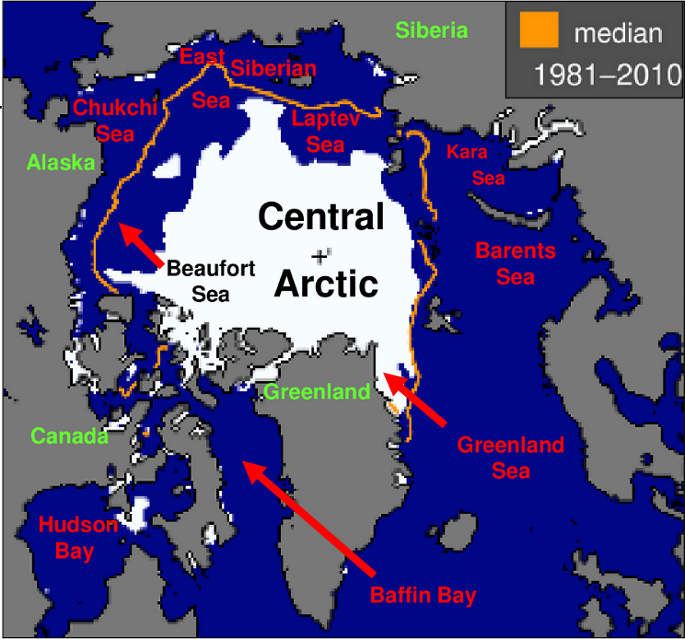
Figure 2:Spatial coverage of Arctic sea ice at minimum extent. (Source: US National Snow and Ice Data Center.)
Particulars of the 2015 melt season
This year, the start of the melt season in May and June was relatively cool in most of the Arctic Ocean, similar to 2013 and 2014. This was due to a lack of the persistent southerly winds which characterised the early melt season in 2012. Relatively cyclonic conditions, which may have increased cloud cover, reducing the amount of sunlight hitting the ice, likely also contributed.
However, in July the weather changed. High pressure built strongly over Greenland and the American side of the Arctic Ocean, setting up a strong circulation of warm air. Sea ice rapidly melted back from the Siberian and Alaskan coasts. The overall rate of sea ice loss during July was the third highest on record.
In August the southerly flow was briefly cut off, and stormy conditions developed over the Pacific side of the Arctic. This resulted in dispersal of the ice in that region. As northerly winds developed over the Beaufort Sea north of Alaska, an arm of sea ice became detached from the main pack. This persisted for several weeks before disintegrating into patches, probably because it contained a high proportion of thick multiyear ice. Some of these patches were still present at the end of the melt season as can be seen in Figure 2 which shows the spatial coverage of Arctic sea ice at the 2015 minimum extent. In late August, southerly winds developed again, and the ice edge retreated further; but the weakening sun began to show its effects in the colder Central Arctic, as meltponds rapidly froze over. As September began, ice edge retreat stalled in all parts of the Arctic.
Arctic Sea Ice Seasonal Cycle
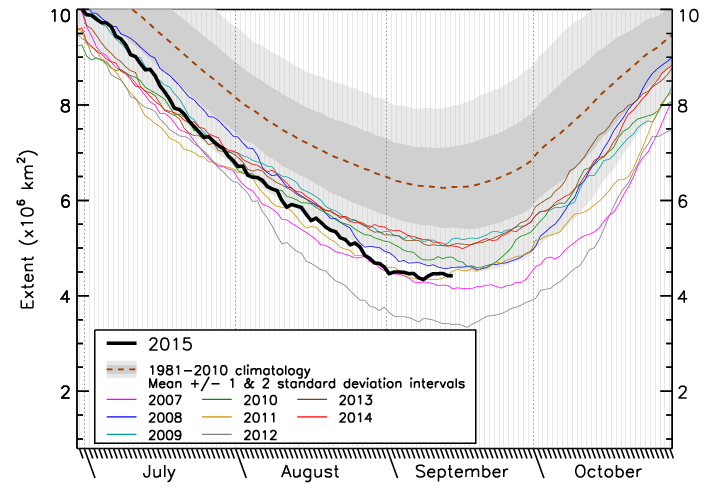
Figure 3:Arctic sea ice extent evolution through the year for 2015 and recent years. The 1981-2010 average is shown for comparison. (Source: US National Snow and Ice Data Center.)
Figure 3 shows Arctic sea ice extent evolution through the year for 2015 and recent years with the 1981-2010 average is shown for comparison. This melt season demonstrates the ongoing vulnerability of the thinning sea ice cover. The long-term decline in summer sea ice extent has been linked to warming winter temperatures, wind-driven loss of multiyear sea ice and earlier loss of snow cover in the land bordering the Arctic Ocean - all of which serve to increase the vulnerability of the sea ice to melt during the summer.