UK sea level projections to 2300
August 2019 - New sea level projections developed by the Met Office Hadley Centre have been published in a report by the Environment Agency. They show continued rise beyond 2100 under all climate change scenarios.
Sea level rise is the dominant driver of increased coastal flood risk, both historically and in future projections of climate change. Individual UK flood events are usually associated with extreme weather conditions, particularly the generation of storm surges, which can be compounded by the action of wind-generated surface waves. However, projections of changes in frequency and severity of future coastal extreme water levels are dominated by the long-term increase in coastal water levels associated with climate change [Palmer 2018a].
Finite computational resource means that sea level projections based on climate model simulations are often only available to the year 2100. However, there is an increasing demand for information beyond 2100 to aid adaptation planning for coastal infrastructure. In order to meet this need, the Environment Agency commissioned the Met Office to develop a new set of sea level projections that extend to 2300. A key requirement for these new projections was consistency with the UKCP18 21st century sea level projections that are rooted in the CMIP5 climate model projections presented in the IPCC AR5 report.
Simple climate model
The new research makes use of a simple climate model that has been used extensively in the context of understanding future surface temperature rise and climate sensitivity in more complex climate models [e.g. Gregory et al, 2015]. The model was used to extend CMIP5 climate model projections by varying the parameter settings to provide the best fit to each individual climate model – in a process often referred to as “emulation”. This approach was used to generate projections of global surface temperature and the sea level rise associated with ocean warming. The result was an emulated ensemble of projections that extend to 2300 and showed excellent agreement with CMIP5 climate model results over the 21st century [Palmer et al, 2018a].
Exploratory projections
The outputs from the model were used as the basis of projections of global sea level rise, following similar methods to those described in IPCC AR5. These global projections were translated into regional projections by accounting for additional effects, including: the spatial “fingerprints” of change associated with ice melt; changes in local currents; and the influence of ongoing vertical land motion related to the last de-glaciation [Palmer et al, 2018b].
Given the simple assumptions around future emissions and the particularly large uncertainty around the future loss of ice from Antarctica [Edwards et al, 2019] the new projections are considered exploratory and have a much lower degree of confidence than the UKCP18 21st projections. Substantially larger future sea level rise cannot be ruled out and decision makers are advised to make use of other strands of evidence, particularly in “H++ scenarios”, where there is a high degree of risk aversion.
All rise
One of the main outcomes of the research was the demonstration that UK sea levels will continue to rise well beyond 2100 under all future emissions scenarios, although the severity of the future rise is strongly dependent on the assumed future greenhouse gas emissions, or emissions scenario, used. Under a low emissions scenario, the approximate projected ranges at 2300 are 0.5-2.2 m for London and Cardiff, and 0.0-1.7 m for Edinburgh and Belfast. Under a high emissions scenario, this increases to 1.4-4.3 m for London and Cardiff, and 0.7-3.6 m for Edinburgh and Belfast. The new research provided similar projections for tide gauge locations around the UK coastline and combined them with statistics on extreme coastal water levels. The research found that at some locations the 1 in 10,000-year flood event of today could be expected more than once per year by 2300
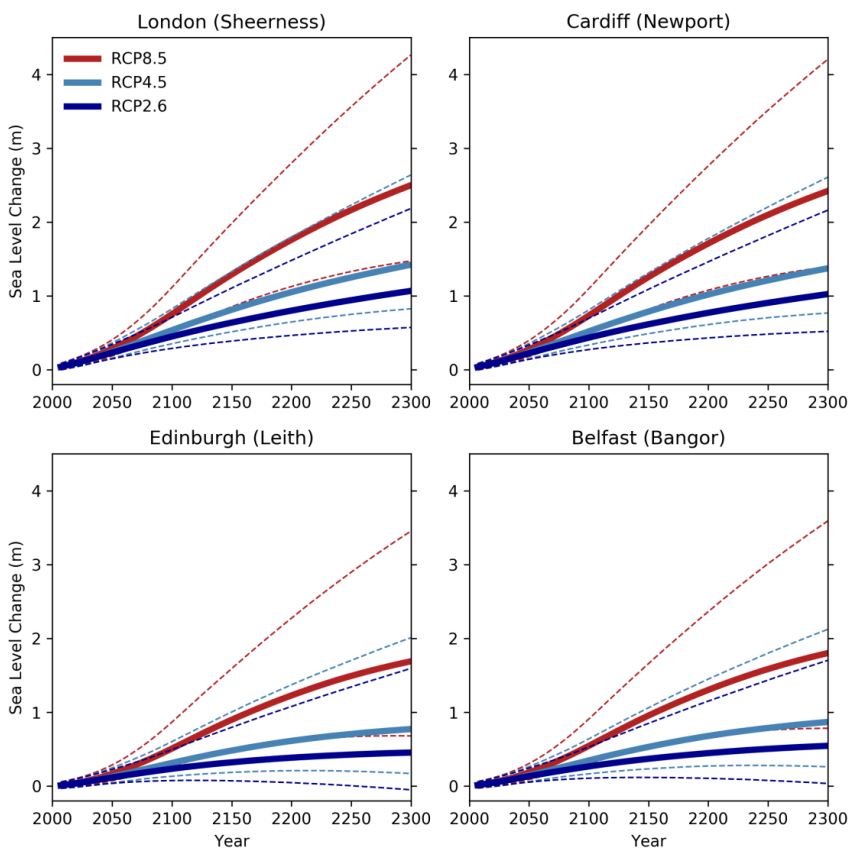
Figure 1. Time series of the time-mean relative sea level change for UK capital cities based on the nearest Class A tide gauge location (indicated in brackets). Notes: Solid lines indicate the central estimate and dashed lines indicate the 5th to 95th percentile range for each RCP scenario as indicated in the legend (top left panel). All projections are presented relative to a baseline period of 1981 to 2000.
Source: UKCP18 Marine Report (Palmer et al. 2018b, Figure 3.1.4)
References
- Edwards, T. L., Brandon, M., Durand, G., Edwards, N., Golledge, N. R., Holden, P., Nias, I., Payne, A. J., Ritz, C. & Wernecke, A., 2019. Revisiting Antarctic ice loss due to marine ice-cliff instability. Nature. 566, 7742, p. 58-64.
- Gregory, J. M., Andrews, T. and Good, P., 2015. The inconstancy of the transient climate response parameter under increasing CO₂. Philos. Trans. R. Soc. London, 373, 20140417 10.1098/rsta.2014.0417.
- Palmer, M.D., Harris, G.R. and Gregory, J.M., 2018a. Extending CMIP5 projections of global mean temperature change and sea level rise due to thermal expansion using a physically-based emulator. Environ. Res. Lett. 13 084003.
- Palmer, M. et al 2018b. UKCP18 Marine Report, 133pp.