

Tropical cyclone verification northern hemisphere 2020
A summary of tropical cyclone activity in the Northern Hemisphere for the 2020 season together with an assessment of the performance of the Met Office global model in predicting the track and intensity of these tropical cyclones.
1. Introduction
A summary of tropical cyclone activity in the Northern Hemisphere for the 2020 season is presented below together with an assessment of the performance of the Met Office global model in predicting the track and intensity of these tropical cyclones.
Tropical cyclones are experienced in the North Pacific, North Atlantic and North Indian Oceans and nearby tropical seas with occasional tropical or subtropical storms in the Mediterranean Sea. For the purpose of tropical cyclone verification the northern hemisphere is divided in to five basins; the North-West Pacific (west of 180° E to the Malay Peninsula), the North-East Pacific (east of 180° E), the North Atlantic, the North Indian Ocean (west of the Malay Peninsula) and the Mediterranean Sea. Mean error statistics for the main four basins are presented together with a table of statistics for the whole Northern Hemisphere. Verification is performed at 12-hour intervals up to forecast time T+168, although statistics are only presented at 24-hour intervals in this report. The global model resolution in operation was 0.140625° x 0.09375° x 70 levels. This is equivalent to a horizontal resolution of 16 km × 10 km at the equator.
Tropical cyclone forecast verification - measures of error
Advisory positions received in real time from RSMC Tokyo, JTWC Hawaii, NHC Miami and CPHC Honolulu are used as verifying observations of storm location. Best track data from these centres will be obtained once they become available. Past experience shows that use of best track rather than real time data usually only makes minor differences to seasonal error statistics. Some mean error statistics for last season are also included for the purposes of a comparison. Forecast tracks are only verified when a depression reaches tropical storm status.
2. Tropical cyclone activity
| NWP | NEP | NAT | NI | MED | TOTAL | |
| Tropical depressions (<34 knots) | 3 (4) | 4 (2) | 1 (2) | 0 (0) | 0 (0) | 8 (8) |
| Tropical storms (34-63 knots) | 11 (12) | 13 (12) | 17 (12) | 1 (2) | 3 (0) | 45 (38) |
| Hurricanes/typhoons (>63 knots) | 12 (16) | 4 (7) | 13 (6) | 4 (6) | 0 (0) | 33 (35) |
| Total | 26 (33) | 21 (21) | 31 (20) | 5 (8) | 0 (0) | 83 (81) |
Categories assigned based on 1-minute averaged winds
Basin name abbreviations:
NWP : North-west Pacific (west of 180° E)
NEP : North-east Pacific (east of 180° E)
NAT : North Atlantic
NI : North Indian (west of Malay Peninsula)
MED : Mediterranean Sea
The number in brackets indicates the figure for the 2019 season.
3. Summary of northern hemisphere storms
3.1 North-west Pacific basin storms
| T+0 | T+24 | T+48 | T+72 | T+96 | T+120 | T+144 | T+168 | |
| Possibly verified | 165 | 119 | 85 | 58 | 36 | 21 | 8 | 2 |
| Detection rate (%) | 100 | 99 | 99 | 100 | 100 | 100 | 100 | 100 |
| AT error (km) | -4 | -16 | -41 | -68 | -72 | -68 | 90 | 426 |
| CT error (km) | -2 | -10 | -35 | -57 | -58 | 34 | 115 | 171 |
| Track skill (%) | ***** | 63 | 69 | 73 | ***** | ***** | ***** | ***** |
| * 2015-19 skill (%) | ***** | 59 | 67 | 68 | ***** | ***** | ***** | ***** |
| DPE (km) | 33 | 75 | 135 | 205 | 294 | 357 | 509 | 473 |
| * 2015-19 DPE (km) | 38 | 73 | 124 | 191 | 265 | 357 | 471 | 649 |
| Central pressure bias (mb) | 1.4 | 1.9 | -0.8 | -9.5 | -16.7 | -20.4 | -11.1 | 0.5 |
* 5-year running mean DPE and skill for all north-west Pacific storms 2015-19
Plot of the observed tracks of all storms in the north-west Pacific basin
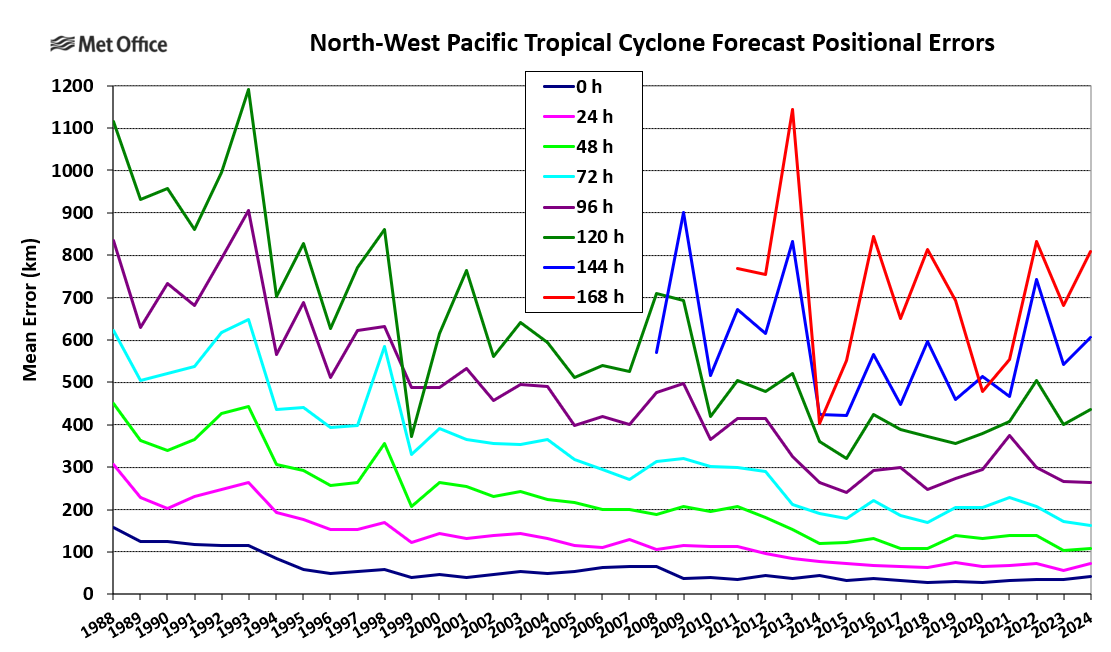
Track forecast errors in the north-west Pacific basin
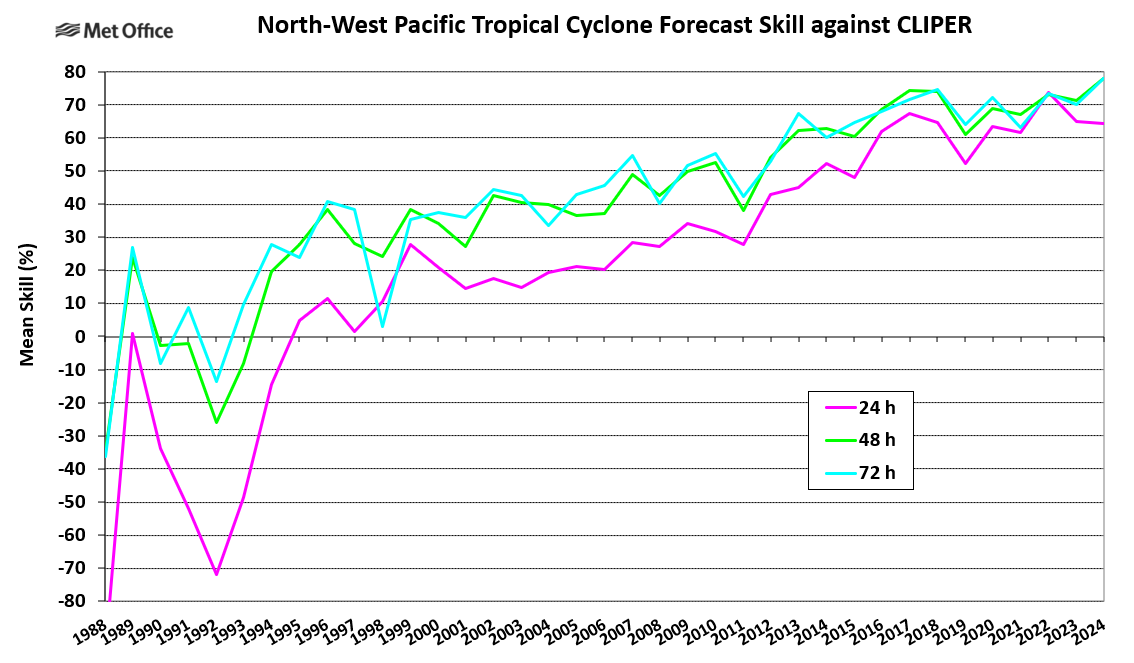
Track forecast skill in the north-west Pacific basin
Despite a late surge in activity after a quiet start, overall 2020 was a quiet season with a lack of long-lived storms and few with very high intensity with the exception of Typhoon Goni. Track forecast errors and skill scores were similar to those of the 5-year running mean. There was a low bias (as measured by central pressure) in forecasts in the 72- to 120-hour range. Very few forecasts beyond 120 hours were verified.
3.2 North-east Pacific basin storms
| T+0 | T+24 | T+48 | T+72 | T+96 | T+120 | T+144 | T+168 | |
| Possibly verified | 102 | 71 | 51 | 35 | 21 | 13 | 7 | 5 |
| Detection rate (%) | 100 | 100 | 100 | 100 | 100 | 100 | 57 | 0 |
| AT error (km) | 6 | 18 | 35 | 39 | 62 | 87 | 146 | ***** |
| CT error (km) | -3 | -12 | -35 | -66 | -76 | -118 | -317 | ***** |
| Track skill (%) | ***** | 56 | 66 | 71 | ***** | ***** | ***** | ***** |
| * 2015-19 skill (%) | ***** | 51 | 65 | 65 | ***** | ***** | ***** | ***** |
| DPE (km) | 31 | 62 | 112 | 161 | 186 | 273 | 442 | ***** |
| * 2015-19 DPE (km) | 37 | 75 | 122 | 181 | 238 | 309 | 376 | 432 |
| Central pressure bias (mb) | -1.0 | 1.0 | 1.6 | 0.5 | 3.2 | 6.2 | 8.2 | ***** |
* 5-year running mean DPE and skill for all north-east Pacific storms for 2015-19
Plot of the observed tracks of all storms in the north-east Pacific basin
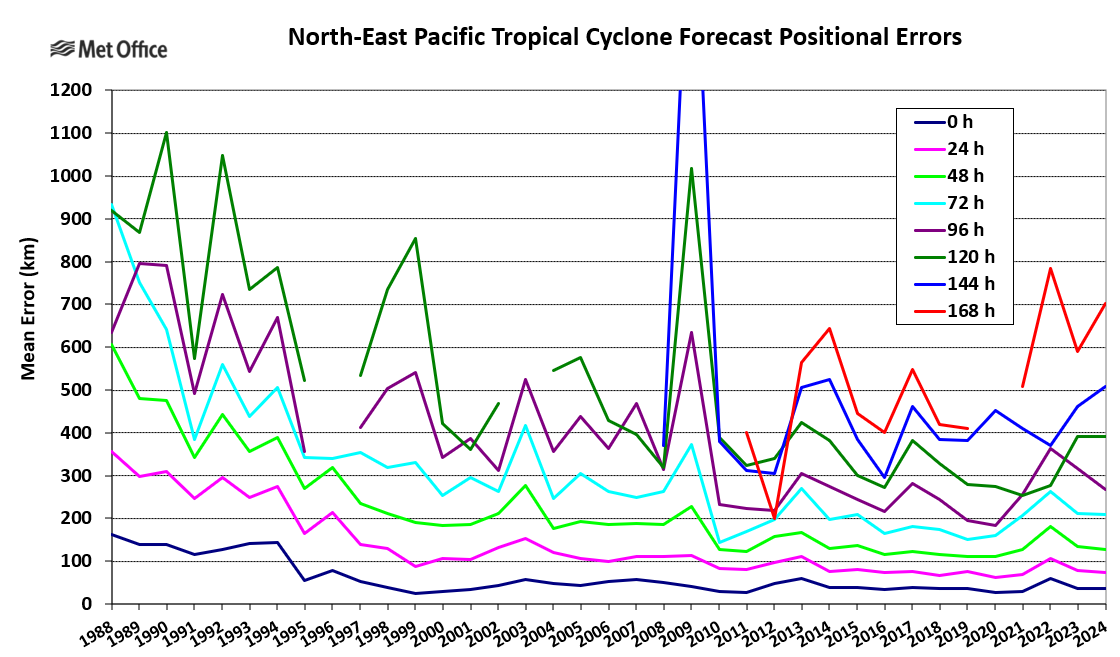
Track forecast errors in the north-east Pacific basin
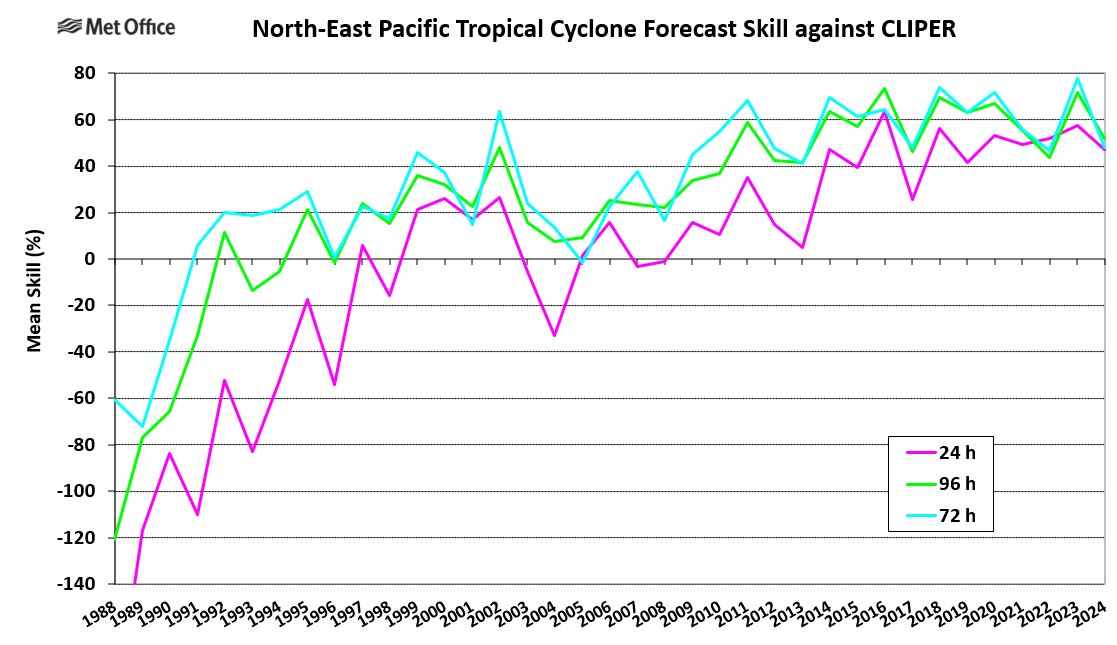
Track forecast skill in the north-east Pacific basin
Although the total storm count was not exceptionally low, very few reached hurricane strength and there were very few long lived storms. Track forecast errors and skill were close to the recent 5-year running mean values. The intensity bias (as measured by central pressure) was fairly neutral.
3.3 North Atlantic basin storms
| T+0 | T+24 | T+48 | T+72 | T+96 | T+120 | T+144 | T+168 | |
| Possibly verified | 250 | 190 | 140 | 98 | 69 | 47 | 35 | 28 |
| Detection rate (%) | 100 | 97 | 96 | 100 | 99 | 96 | 86 | 79 |
| AT error (km) | -1 | -15 | -47 | -102 | -216 | -341 | -495 | -510 |
| CT error (km) | 3 | -2 | -6 | 16 | 46 | 83 | 176 | 344 |
| Track skill (%) | ***** | 70 | 74 | 71 | ***** | ***** | ***** | ***** |
| * 2015-19 skill (%) | ***** | 68 | 73 | 73 | ***** | ***** | ***** | ***** |
| DPE (km) | 34 | 69 | 124 | 210 | 332 | 474 | 672 | 899 |
| * 2015-19 DPE (km) | 27 | 63 | 119 | 189 | 273 | 353 | 459 | 566 |
| Central pressure bias (mb) | 2.9 | 3.3 | 1.4 | -1.2 | -4.0 | -2.7 | -0.9 | 0.5 |
* 5-year running mean DPE and skill for all North Atlantic storms for 2015-19
Plot of the observed tracks of all storms in the North Atlantic basin
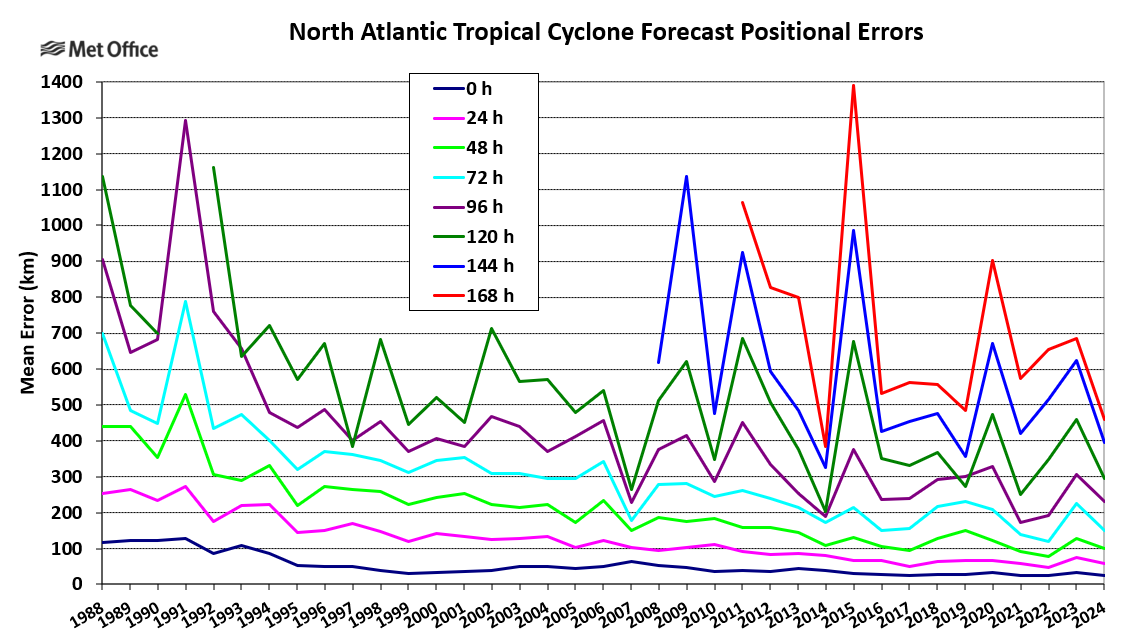
Track forecast errors in the North Atlantic basin
Track forecast skill in the North Atlantic basin
2020 was an exceptionally active season with a record storm count and second highest hurricane count on record. However, only a few storms were very long lived. Short lead time track forecast errors and skill scores were near to the recent 5-year running mean. However, the few long-lived storms (e.g. Paulette, Eta) produced some very large track forecast errors at longer lead times which dominate the scores. The intensity bias (as measured by central pressure) was relatively small.
3.4 North Indian Basin Storms
| T+0 | T+24 | T+48 | T+72 | T+96 | T+120 | T+144 | T+168 | |
| Possibly verified | 28 | 18 | 10 | 4 | 2 | 0 | 0 | 0 |
| Detection rate (%) | 100 | 100 | 90 | 100 | 100 | ***** | ***** | ***** |
| AT error (km) | 3 | 34 | 67 | 118 | 100 | ***** | ***** | ***** |
| CT error (km) | 7 | 21 | 16 | 38 | 32 | ***** | ***** | ***** |
| Track skill (%) | ***** | 68 | 74 | 72 | ***** | ***** | ***** | ***** |
| * 2015-19 skill (%) | ***** | 49 | 58 | 65 | ***** | ***** | ***** | ***** |
| DPE (km) | 40 | 76 | 88 | 181 | 132 | ***** | ***** | ***** |
| * 2015-19 DPE (km) | 45 | 77 | 133 | 179 | 236 | 343 | 525 | 585 |
| Central pressure bias (mb) | -1.5 | -4.6 | -14.9 | -37.2 | -19.0 | ***** | ***** | ***** |
* 5-year running mean DPE and skill for all North Indian storms for 2015-19
Plot of the observed tracks of all storms in the North Indian basin
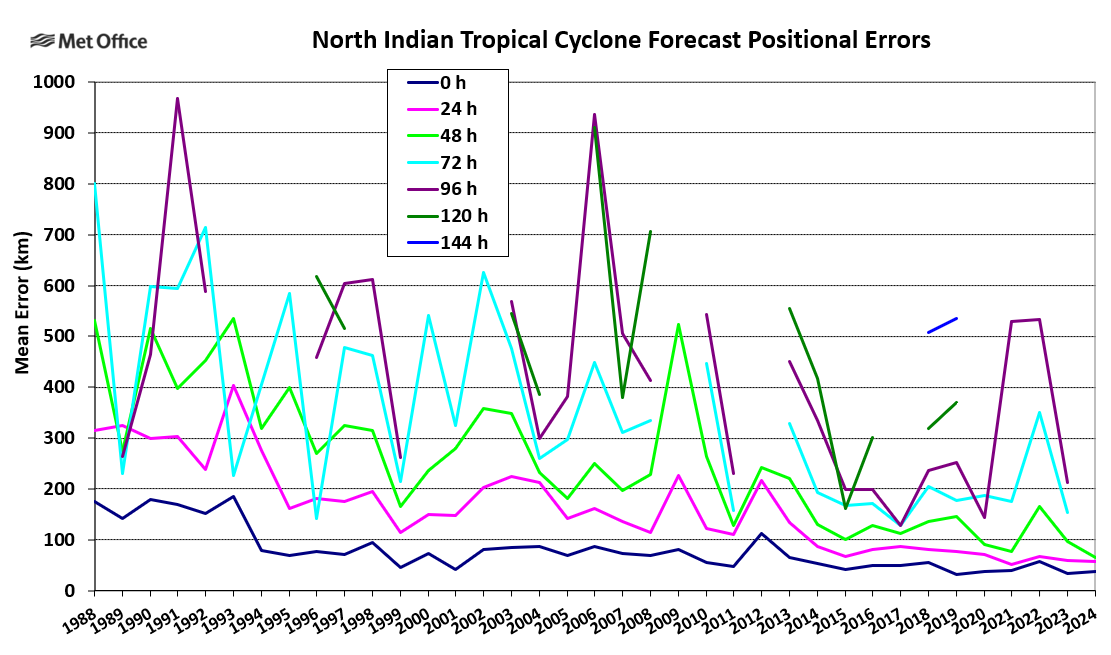
Track forecast errors in the North Indian basin
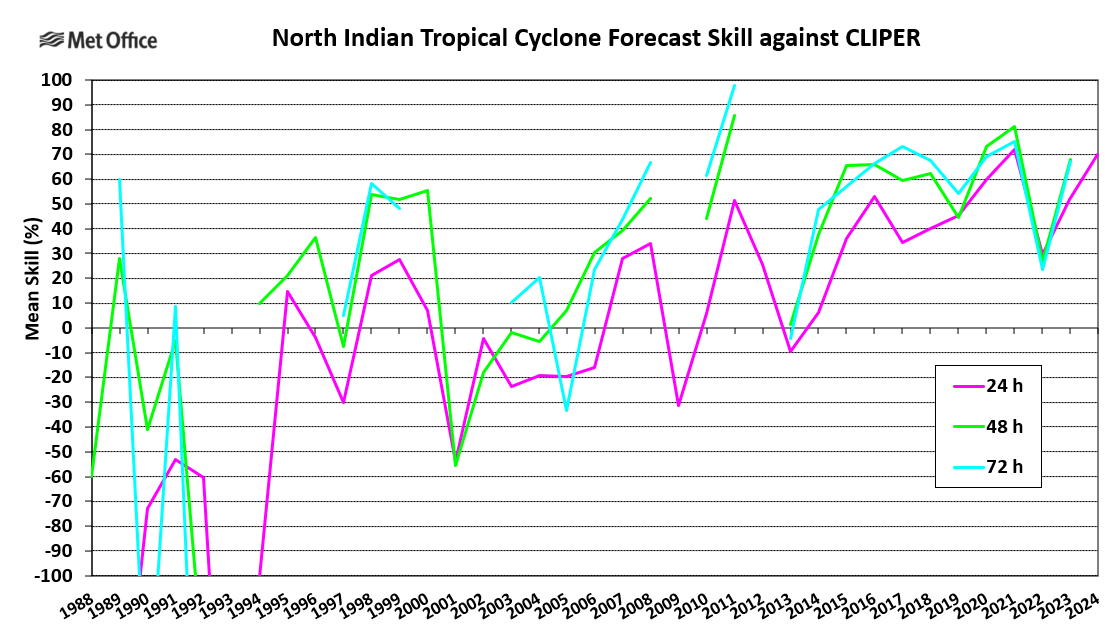
Track forecast skill in the North Indian basin
2020 again saw a high number of hurricane strength tropical cyclones. However, most tropical cyclones were short-lived with very few forecasts verified beyond 48 hours. Track forecast errors were near to the 5-year running mean and skill scores were high. There was a low bias in forecasts (as measured by central pressure).
3.5 Combined statistics for whole northern hemisphere
| T+0 | T+24 | T+48 | T+72 | T+96 | T+120 | T+144 | T+168 | |
| Possibly verified | 545 | 398 | 286 | 195 | 128 | 81 | 50 | 35 |
| Detection rate (%) | 100 | 98 | 98 | 100 | 99 | 98 | 84 | 69 |
| AT error (km) | 0 | -7 | -27 | -62 | -124 | -198 | -322 | -432 |
| CT error (km) | 1 | -5 | -19 | -20 | -4 | 37 | 118 | 330 |
| Track skill (%) | ***** | 66 | 72 | 72 | ***** | ***** | ***** | ***** |
| * 2015-19 skill (%) | ***** | 58 | 68 | 69 | ***** | ***** | ***** | ***** |
| DPE (km) | 34 | 70 | 124 | 199 | 294 | 410 | 619 | 864 |
| * 2015-19 DPE (km) | 34 | 71 | 122 | 185 | 256 | 339 | 440 | 555 |
| Central pressure bias (mb) | 1.5 | 2.1 | 0.2 | -4.1 | -6.6 | -5.9 | -2.0 | 0.5 |
* 5-year running mean DPE and skill for all northern hemisphere storms for 2015-19
2020 saw a storm count close to average, but with a lower than normal proportion of hurricane strength tropical cyclones. The active Atlantic was counterbalanced by the quiet Pacific and long lead time forecasts were produced primarily by just a few Atlantic storms.
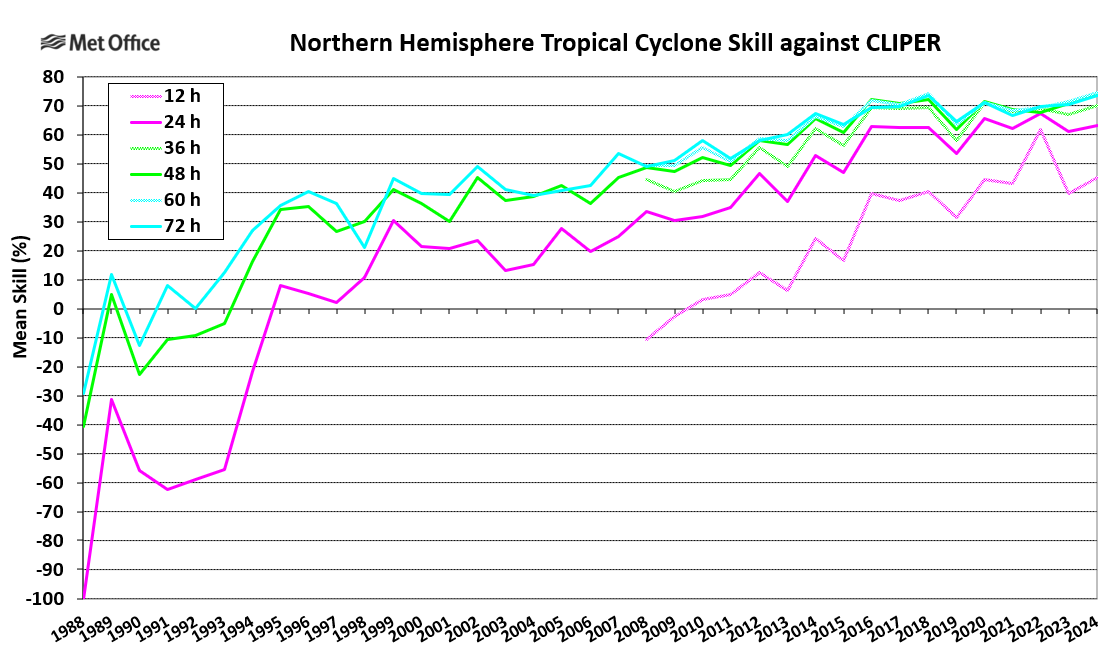
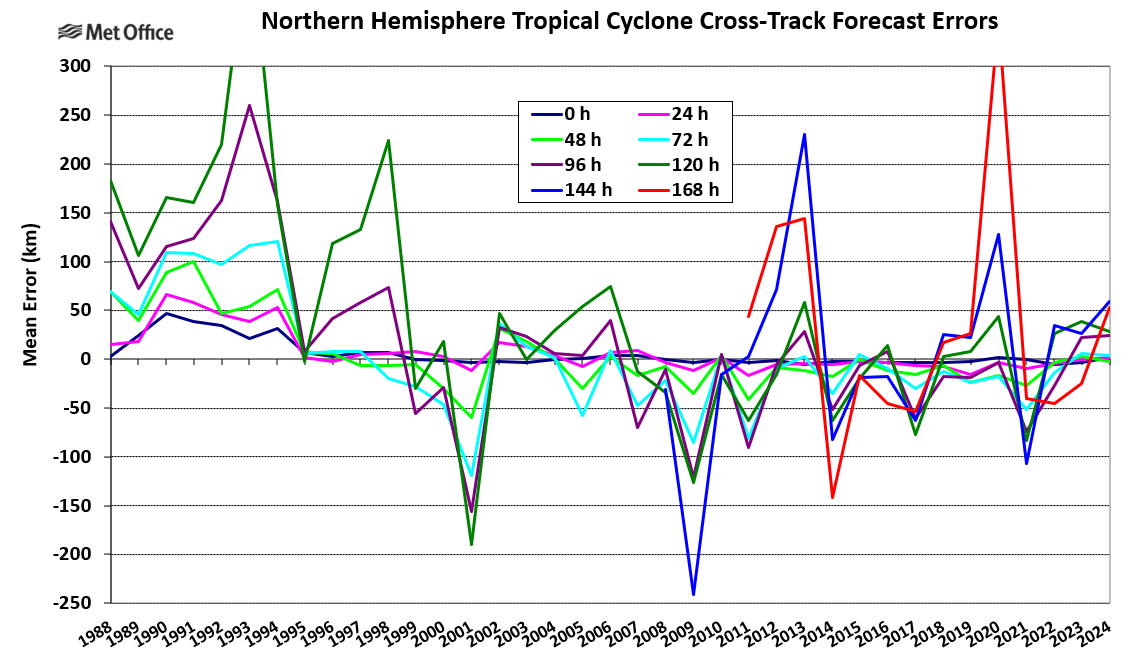
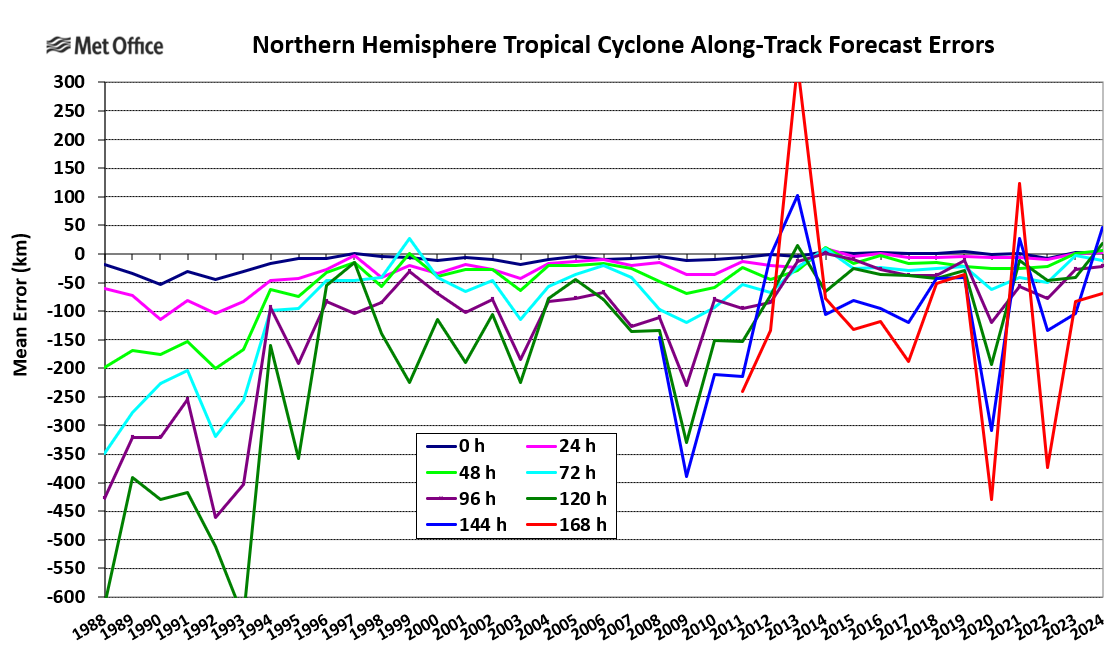
Track forecast errors were near to the 5-year running mean up to 72 hours and skill scores against CLIPER were high. However, longer lead time errors were very high mostly due to large errors for a few Atlantic storms. Cross track errors were small except at long lead times. There was a large slow bias at longer lead times. Detection percentages were mostly high, but dropped off at longer lead times.
Track forecast errors for the whole northern hemisphere
Track forecast skill for the whole northern hemisphere
Cross-track errors for the whole northern hemisphere
Along-track errors for the whole northern hemisphere
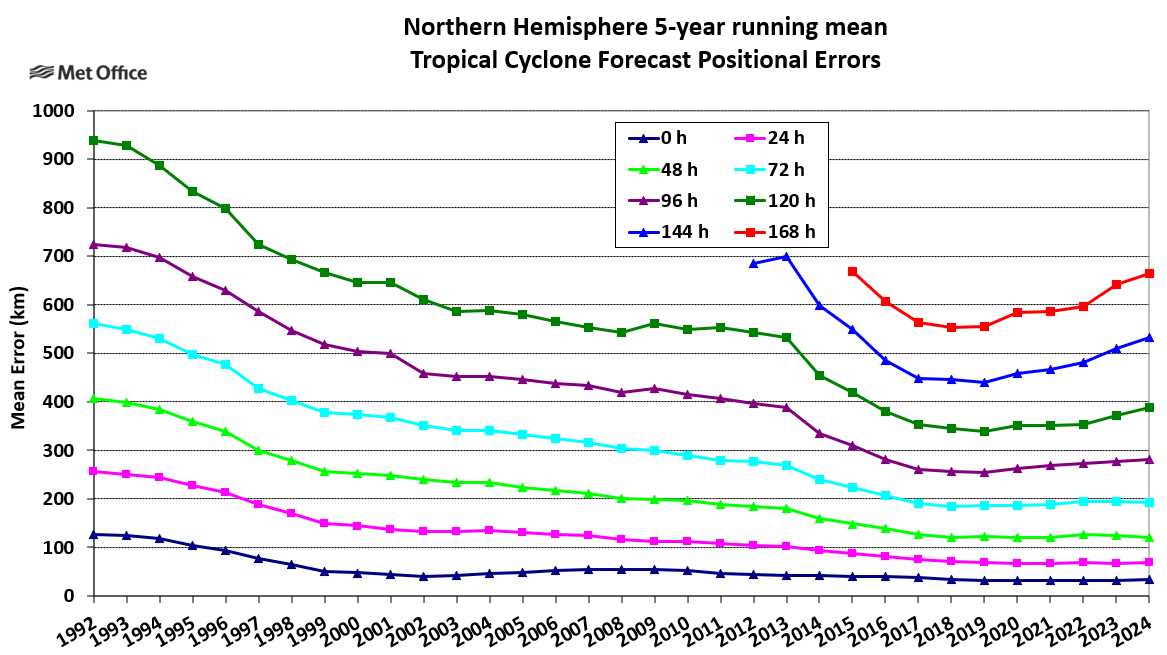
The 5-year running mean of track forecast errors is starting to flat line after years of reductions and there is a slight upturn in longer lead time errors.
5-year running mean track forecast errors for the whole northern hemisphere
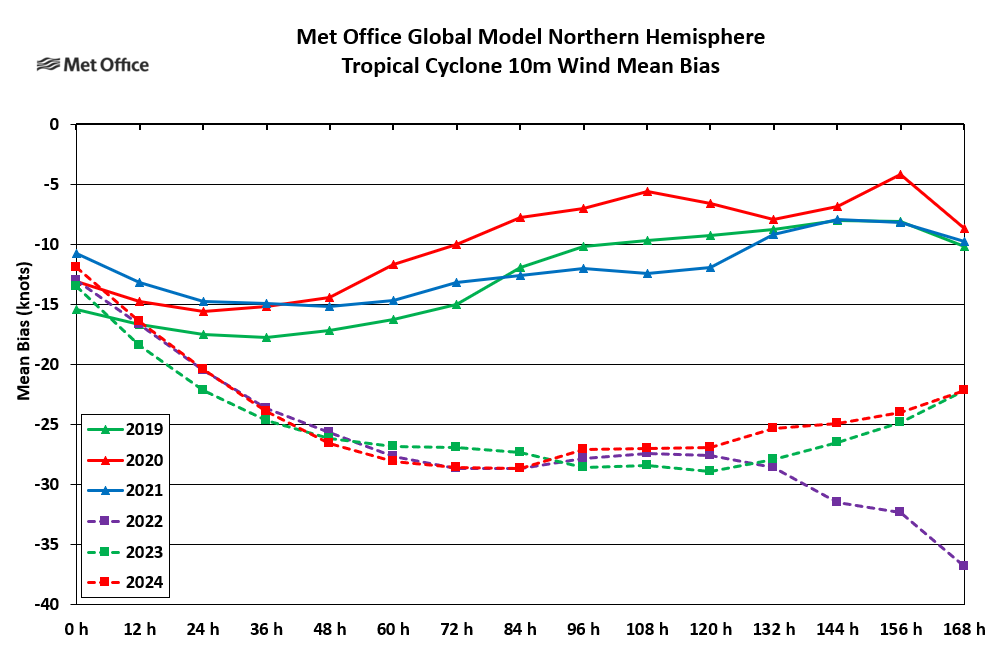
The intensity bias as measured by central pressure was small at short lead times and became negative (strong bias) at longer lead times, although the growth in the bias reversed for the longest lead times. 10m winds had a weak bias which reduced with lead time.
Central pressure forecast bias for the whole northern hemisphere
Peak 10m wind forecast bias for the whole northern hemisphere
4. Further tropical cyclone information
The Met Office tropical cyclone web pages contain information on tropical cyclone forecasting at the Met Office. Monthly updates of tropical cyclone activity and forecasts are made, together with observed and forecast information of recent storms, track and intensity prediction error statistics, lists of names and real time tropical cyclone forecast guidance.
For further information on tropical cyclone forecasting email the Met Office.

