

Aviation Performance and Consultations
We enhance our services via MOAUF and NR23 consultations, and provide aviation performance reports including CAA and LVP verification.
Consultations
The Met Office Aviation User’s Forum (MOAUF) is held annually on behalf of the CAA, and serves as the main consultation platform for UK aviation stakeholders. Open to organisations using Met Office aviation products, it includes representatives from the CAA, airfield operators, airline associations, airlines, and air traffic service providers. Attendees discuss aviation meteorological services, including national and international provisions.
For a copy of the latest MOAUF minutes and presentations, please email [email protected]
NR23 outlines the Met Office’s proposed aviation plans for 2023–2027. Held every five years in agreement with the CAA, the consultation ensures our services meet industry needs. The 2023 meeting included presentations and discussions, with feedback helping shape our plans for the next five years. The consultation is aimed at those flying in UK airspace and paying the en-route charge.
Stay informed about our consultations by following our LinkedIn Aviation page or contact us at [email protected] for questions or further information.
Forecast Performance
Civil Aviation Authority (CAA) Verification Reports
We provide monthly CAA Verification Reports, assessing Timeliness of short-term landing forecasts (TRENDS), Global Model performance, and Accuracy of Terminal Aerodrome Forecasts (TAF) accuracy. Metrics ensure accuracy, timeliness, and compliance, supporting safe aviation decisions. Performance is monitored against CAA-agreed KPIs, reported monthly, and reviewed quarterly.
CAA Verification Reports
- March 2025
- April 2025
- May 2025
- June 2025
- July 2025
- August 2025
- September 2025
- October 2025
- November 2025
- December 2025
- January 2026
- February 2026
NATS Low Visibility Procedure (LVP) Matrix
We help Air Traffic Service (ATS) units manage airport capacity with advance forecasts of low visibility and cloud base. Our risk-based LVP forecasts cover many airports, with Verification Reports summarising occurrences at six key locations. Based on forecasts issued 12 hours ahead and early morning updates, the report is updated annually by 30 June.
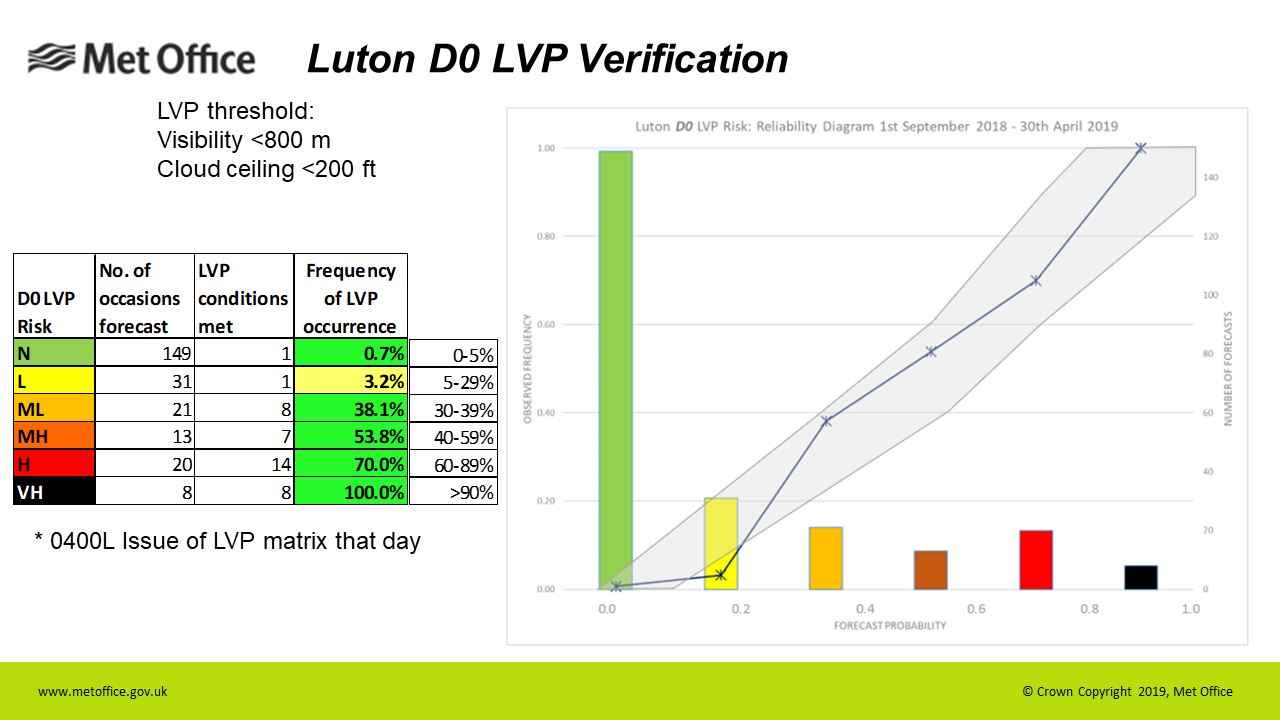
An example of an LVP verification report
Understanding the LVP Verification Report
- The shaded area shows where forecast LVP risk levels match expected event frequency.
- A plotted line represents risk probability against observed LVP frequency.
- If the line stays within the shaded area, it appears green in the table.
- If the line falls outside, it appears yellow, indicating under- or over-forecasting.
Get in touch
Call us
We are available 24/7.
0370 900 0100Email us
Fill out this short form and we'll get back to you.
Contact Us formFollow us
Linkedin XGet in touch
Call us
We are available 24/7.
0370 900 0100Email us
Fill out this short form and we'll get back to you.
Contact Us form