World Area Forecast Centre (WAFC)
Here you'll find an overview of a WAFC, what we provide and how it will evolve in the future.
What is a WAFC?
In the early 1980s, the International Civil Aviation Organization (ICAO) developed the World Area Forecast System (WAFS) to provide seamless forecasts of upper air winds, temperatures, and significant weather hazards, enhancing safety and identifying potential delays. Two World Area Forecast Centres (WAFCs) were established to deliver this information: one operated by the National Oceanic and Atmospheric Administration (NOAA) in the USA and the other by the UK Met Office.
Our performance is verified across various regions to ensure forecast accuracy. Click here to learn more about our WAFC London performance indicators
What Does a WAFC Provide?
SIGWX Forecasts:
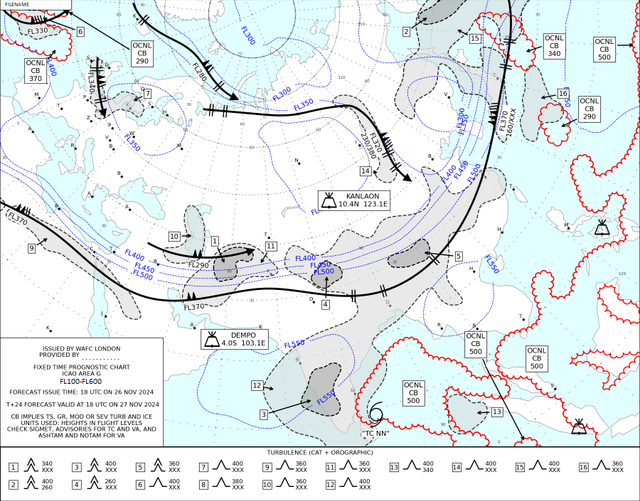
SIGWX charts are essential for pilots, providing a broad overview of significant weather relevant to their flight. Elements visible in these charts include jet streams (wind speeds exceeding 80 knots), areas of cumulonimbus clouds and turbulence, erupting volcanoes, and tropical cyclones.
Global gridded WAFS data sets:
We produce global gridded data sets of wind and temperature for efficient flight planning, as well as gridded data sets of hazardous phenomena like cumulonimbus clouds, clear air turbulence, and icing. This data can be integrated into flight planning software, playing a crucial role in decision-making. Full details of the WAFS data sets available via SADIS can be found on our SADIS pages. Click here to learn more
Past Changes and The Future of WAFS
The UK Met Office and NOAA, as WAFCs, are collaborating to ensure the next generation of WAFS data sets deliver accurate meteorological data to the evolving aviation industry, aligning with ICAO’s Global Air Navigation Plan (GANP) and Aviation System Block Upgrades (ASBU). These improved data sets will help limit the environmental impact of air travel, manage increased traffic and capacity demands, and support air traffic management strategies to mitigate hazardous weather conditions.
To keep up to date on upcoming changes visit our Aviation Services LinkedIn page
Past changes include:
In January 2025 changes to the content of WAFS SIGWX forecasts were made.
In April 2025, multi-timestep SIGWX forecasts were introduced, providing T+6 to T+48 forecasts at 3-hour intervals instead of just a single T+24 forecast. This data is available only via the SADIS API.
Probabilistic WAFS forecasts
The WAFC’s plan to introduce probabilistic WAFS hazard data sets in November 2027, becoming fully operational in November 2028. These will include:
-
Probability of Turbulence Severity with Eddy Dissipation rates above set thresholds (moderate or greater intensity)
-
Probability of Icing Severity being moderate or greater
-
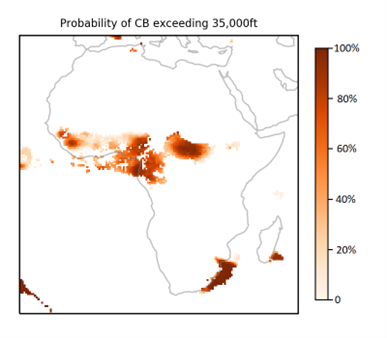
Probability of cumulonimbus cloud tops exceeding height thresholds
Initially, there will be 6 turbulence levels and 5 icing levels at a 0.5-degree horizontal resolution. Data will cover the 6-hour to 48-hour forecast period at 3-hour intervals. Preliminary example plots are shown below:
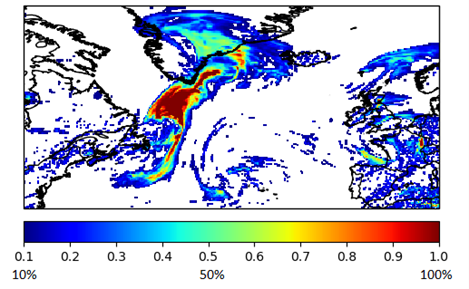
1) Probability that the Turbulence Severity Eddy Dissipation rate will exceed 0.2.
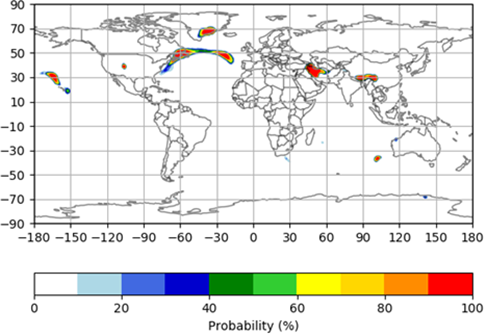
2) Probability that the Icing Severity will be moderate or greater in intensity
3) Probability that the cumulonimbus cloud tops will exceed 35,000ft.