
Annual climate stocktake shows weather records and extremes now the norm in UK Climate
Record breaking and extreme weather has become increasingly commonplace in the UK as our climate has changed over the last few decades.
The latest assessment of the UK’s climate shows how baselines are shifting, records are becoming more frequent, and that temperature and rainfall extremes are becoming the norm. The latest State of the UK Climate report, published by Wiley in the Royal Meteorological Society’s ‘International Journal of Climatology’, provides insight into the UK’s changing climate.
The report highlights how the UK’s climate has warmed steadily from the 1980s onwards, albeit with individual cooler years, with the greatest implications from the increasing frequency and intensity of daily temperature extremes.
The last three years have been in the UK’s top five warmest on record, with 2024 the fourth warmest year in records dating back to 1884. In 2024 specifically, we saw the UK’s second warmest February, warmest May, fifth warmest December, fifth warmest winter and warmest spring on record. Statistics like this are typical of recent years in the UK’s climate records and some of these have already been surpassed in 2025.
The report shows how the UK has warmed at a rate of approximately 0.25°C per decade since the 1980s, with the most recent decade (2015-2024) 1.24°C warmer than 1961-1990. Looking even further back, the Central England Temperature series shows that recent warming has far exceeded any observed temperatures in at least 300 years.
The report is based on observations from a network of several hundred weather stations, with temperature and rainfall data from these extending back to the 19th Century providing long term context. These data tell us how our climate has already changed here in the UK.
Extremes becoming the norm
New analysis in the report examines the shifting frequency and intensity of heat and rainfall extremes. Understanding how these extremes are changing is particularly important because these tend to cause the greatest impacts, such as heatwaves or floods.
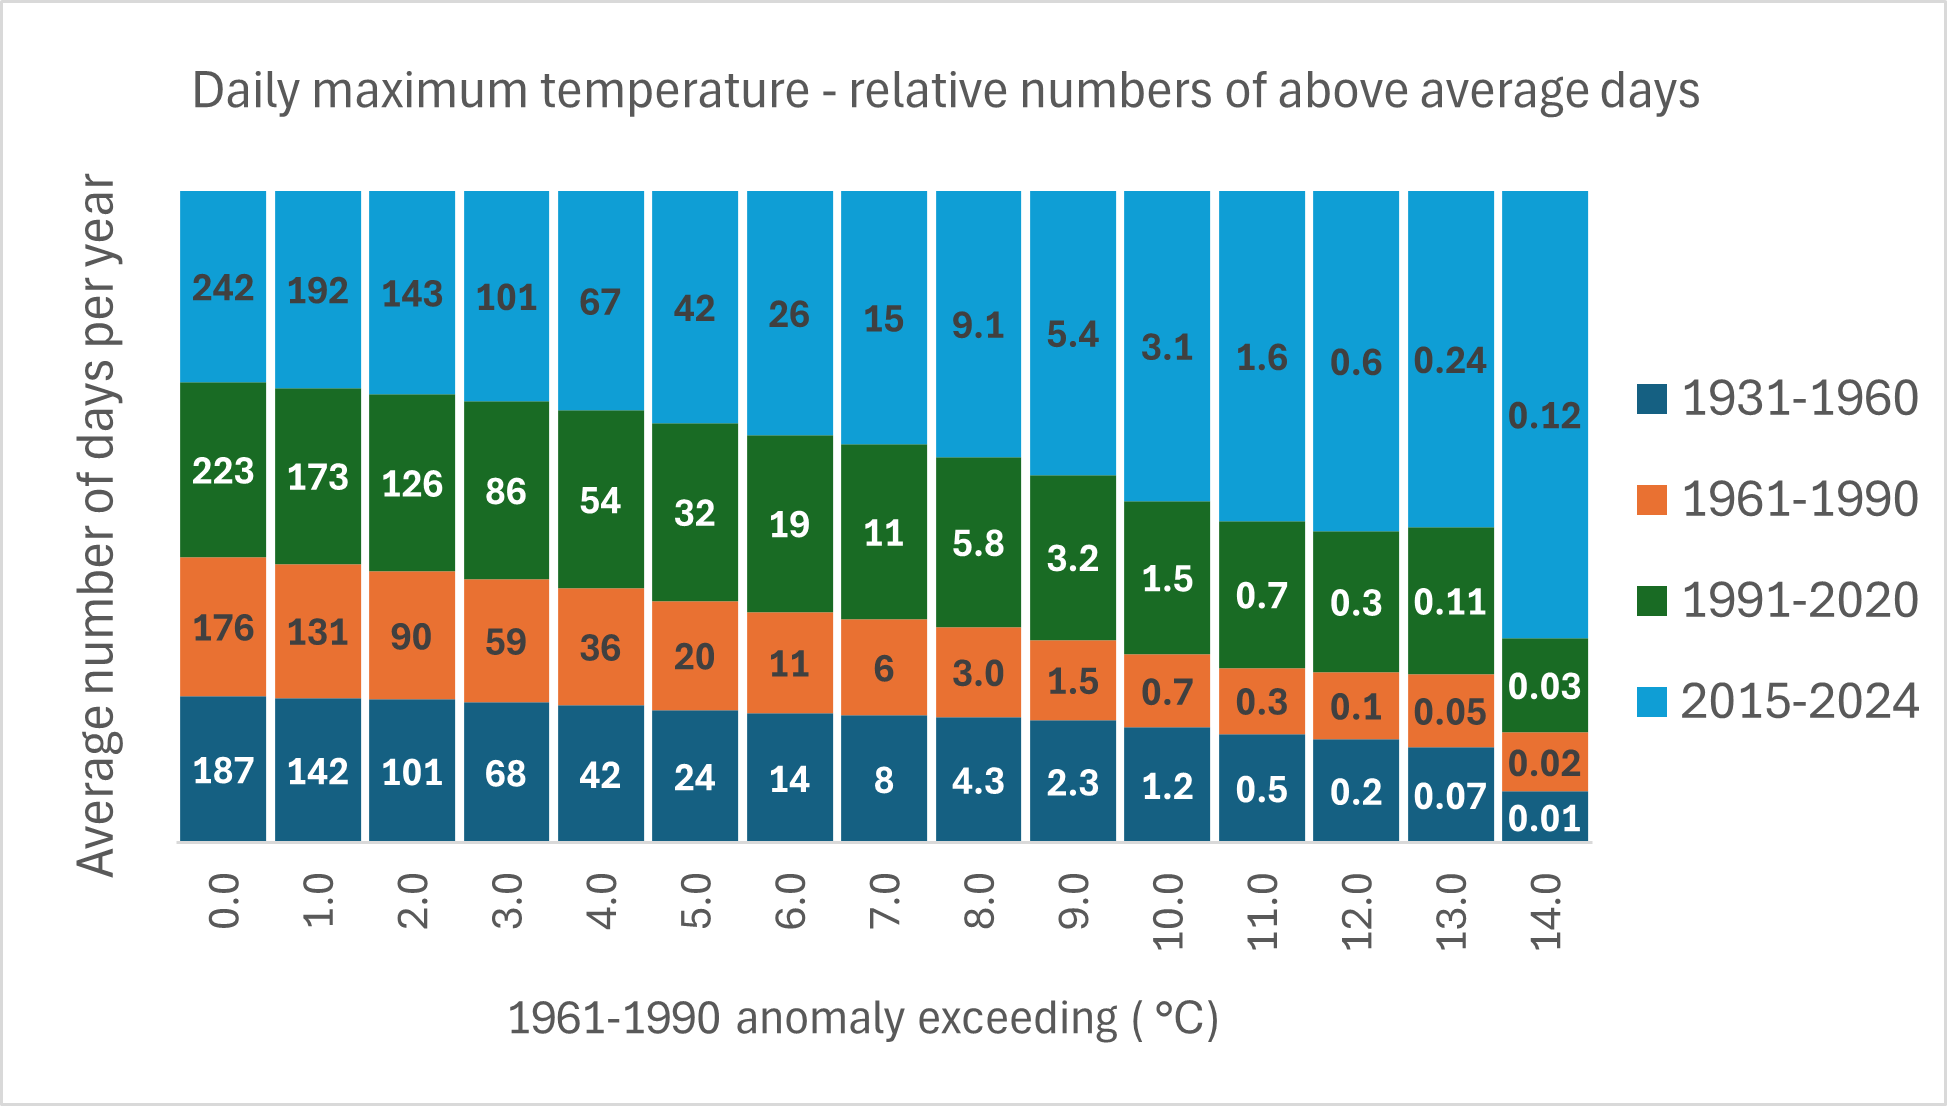
The number of days with temperatures 5°C above the 1961-1990 average has doubled for the most recent decade 2015-2024 compared to 1961-1990. For 8°C above average the number has trebled and for 10°C it has quadrupled. This shows how the hottest days we experience in the UK have increased in frequency dramatically in just a few decades.
When comparing the most recent decade 2015-2024 to 1961-1990, the hottest summer days and coldest winter nights have warmed around twice as much as average summer days and winter nights have in some parts of the UK.
At the same time, the frequency of the coldest nights we experience has also dropped dramatically.
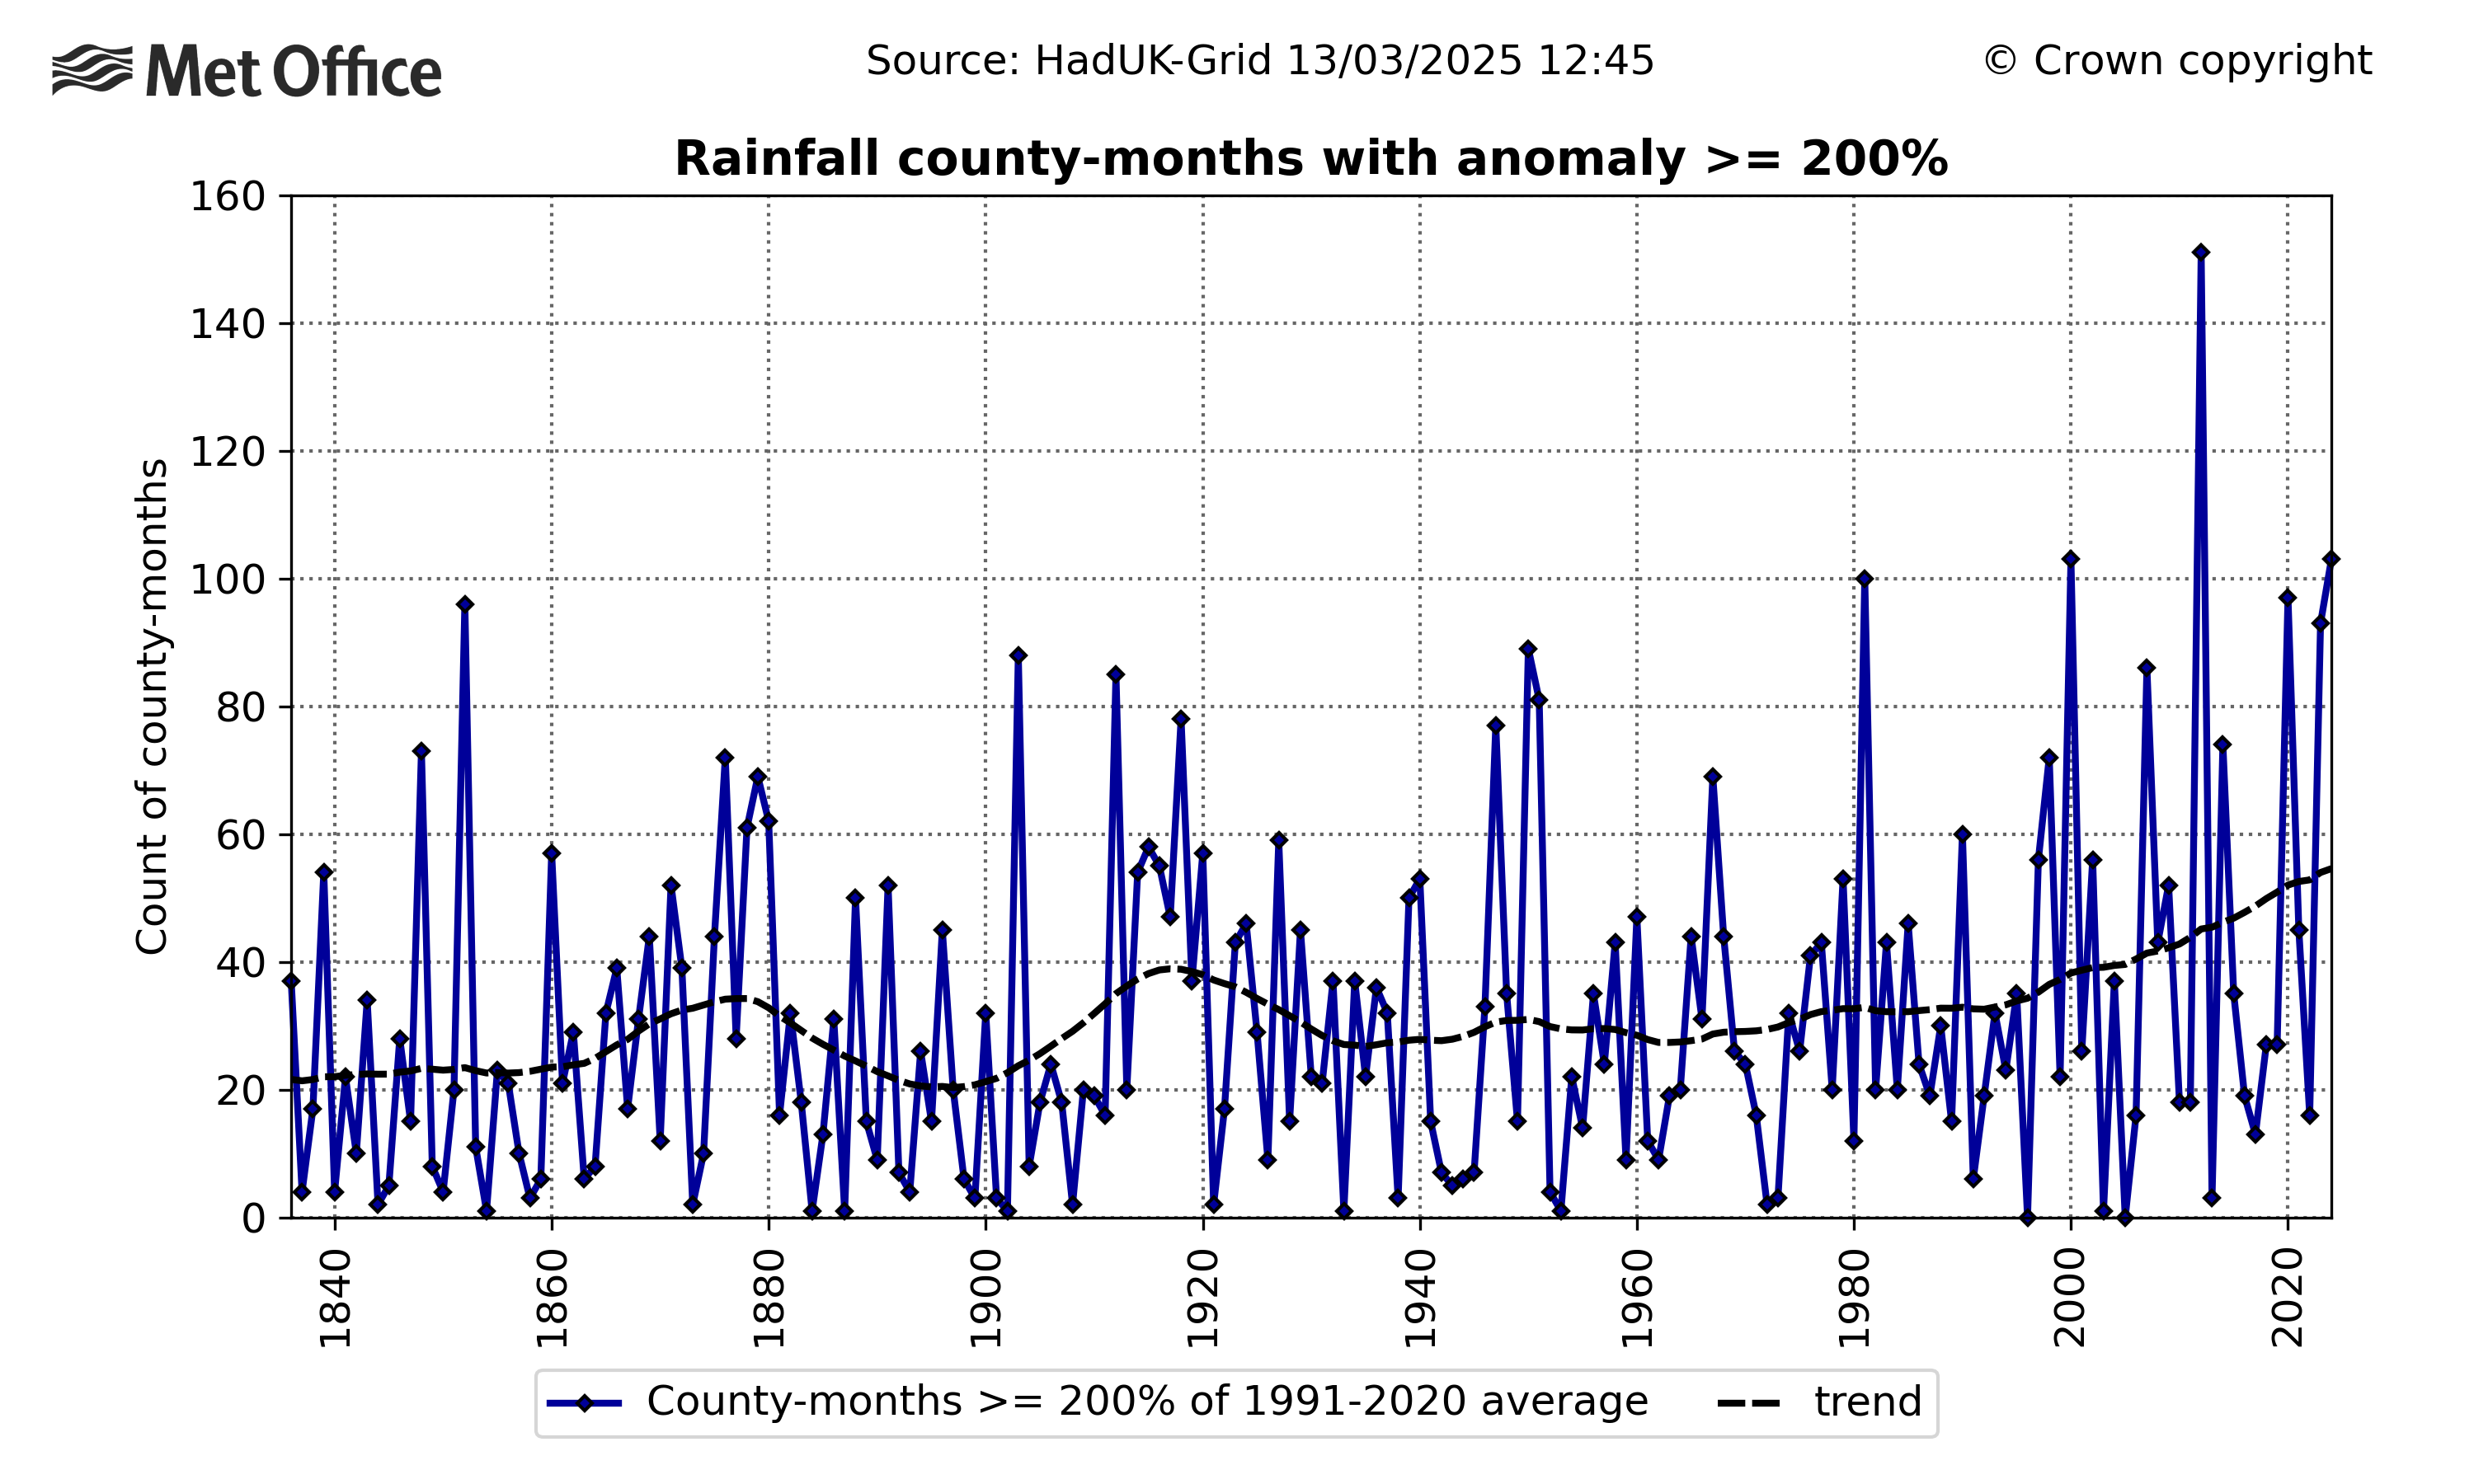
Although there is much more variability with rainfall, it is still possible to see how extremes are being impacted here too. For the most recent decade 2015-2024, the number of months where counties are recording monthly rainfall totals of at least twice the 1991-2020 monthly average has increased by over 50% compared to the number in 1961-1990.
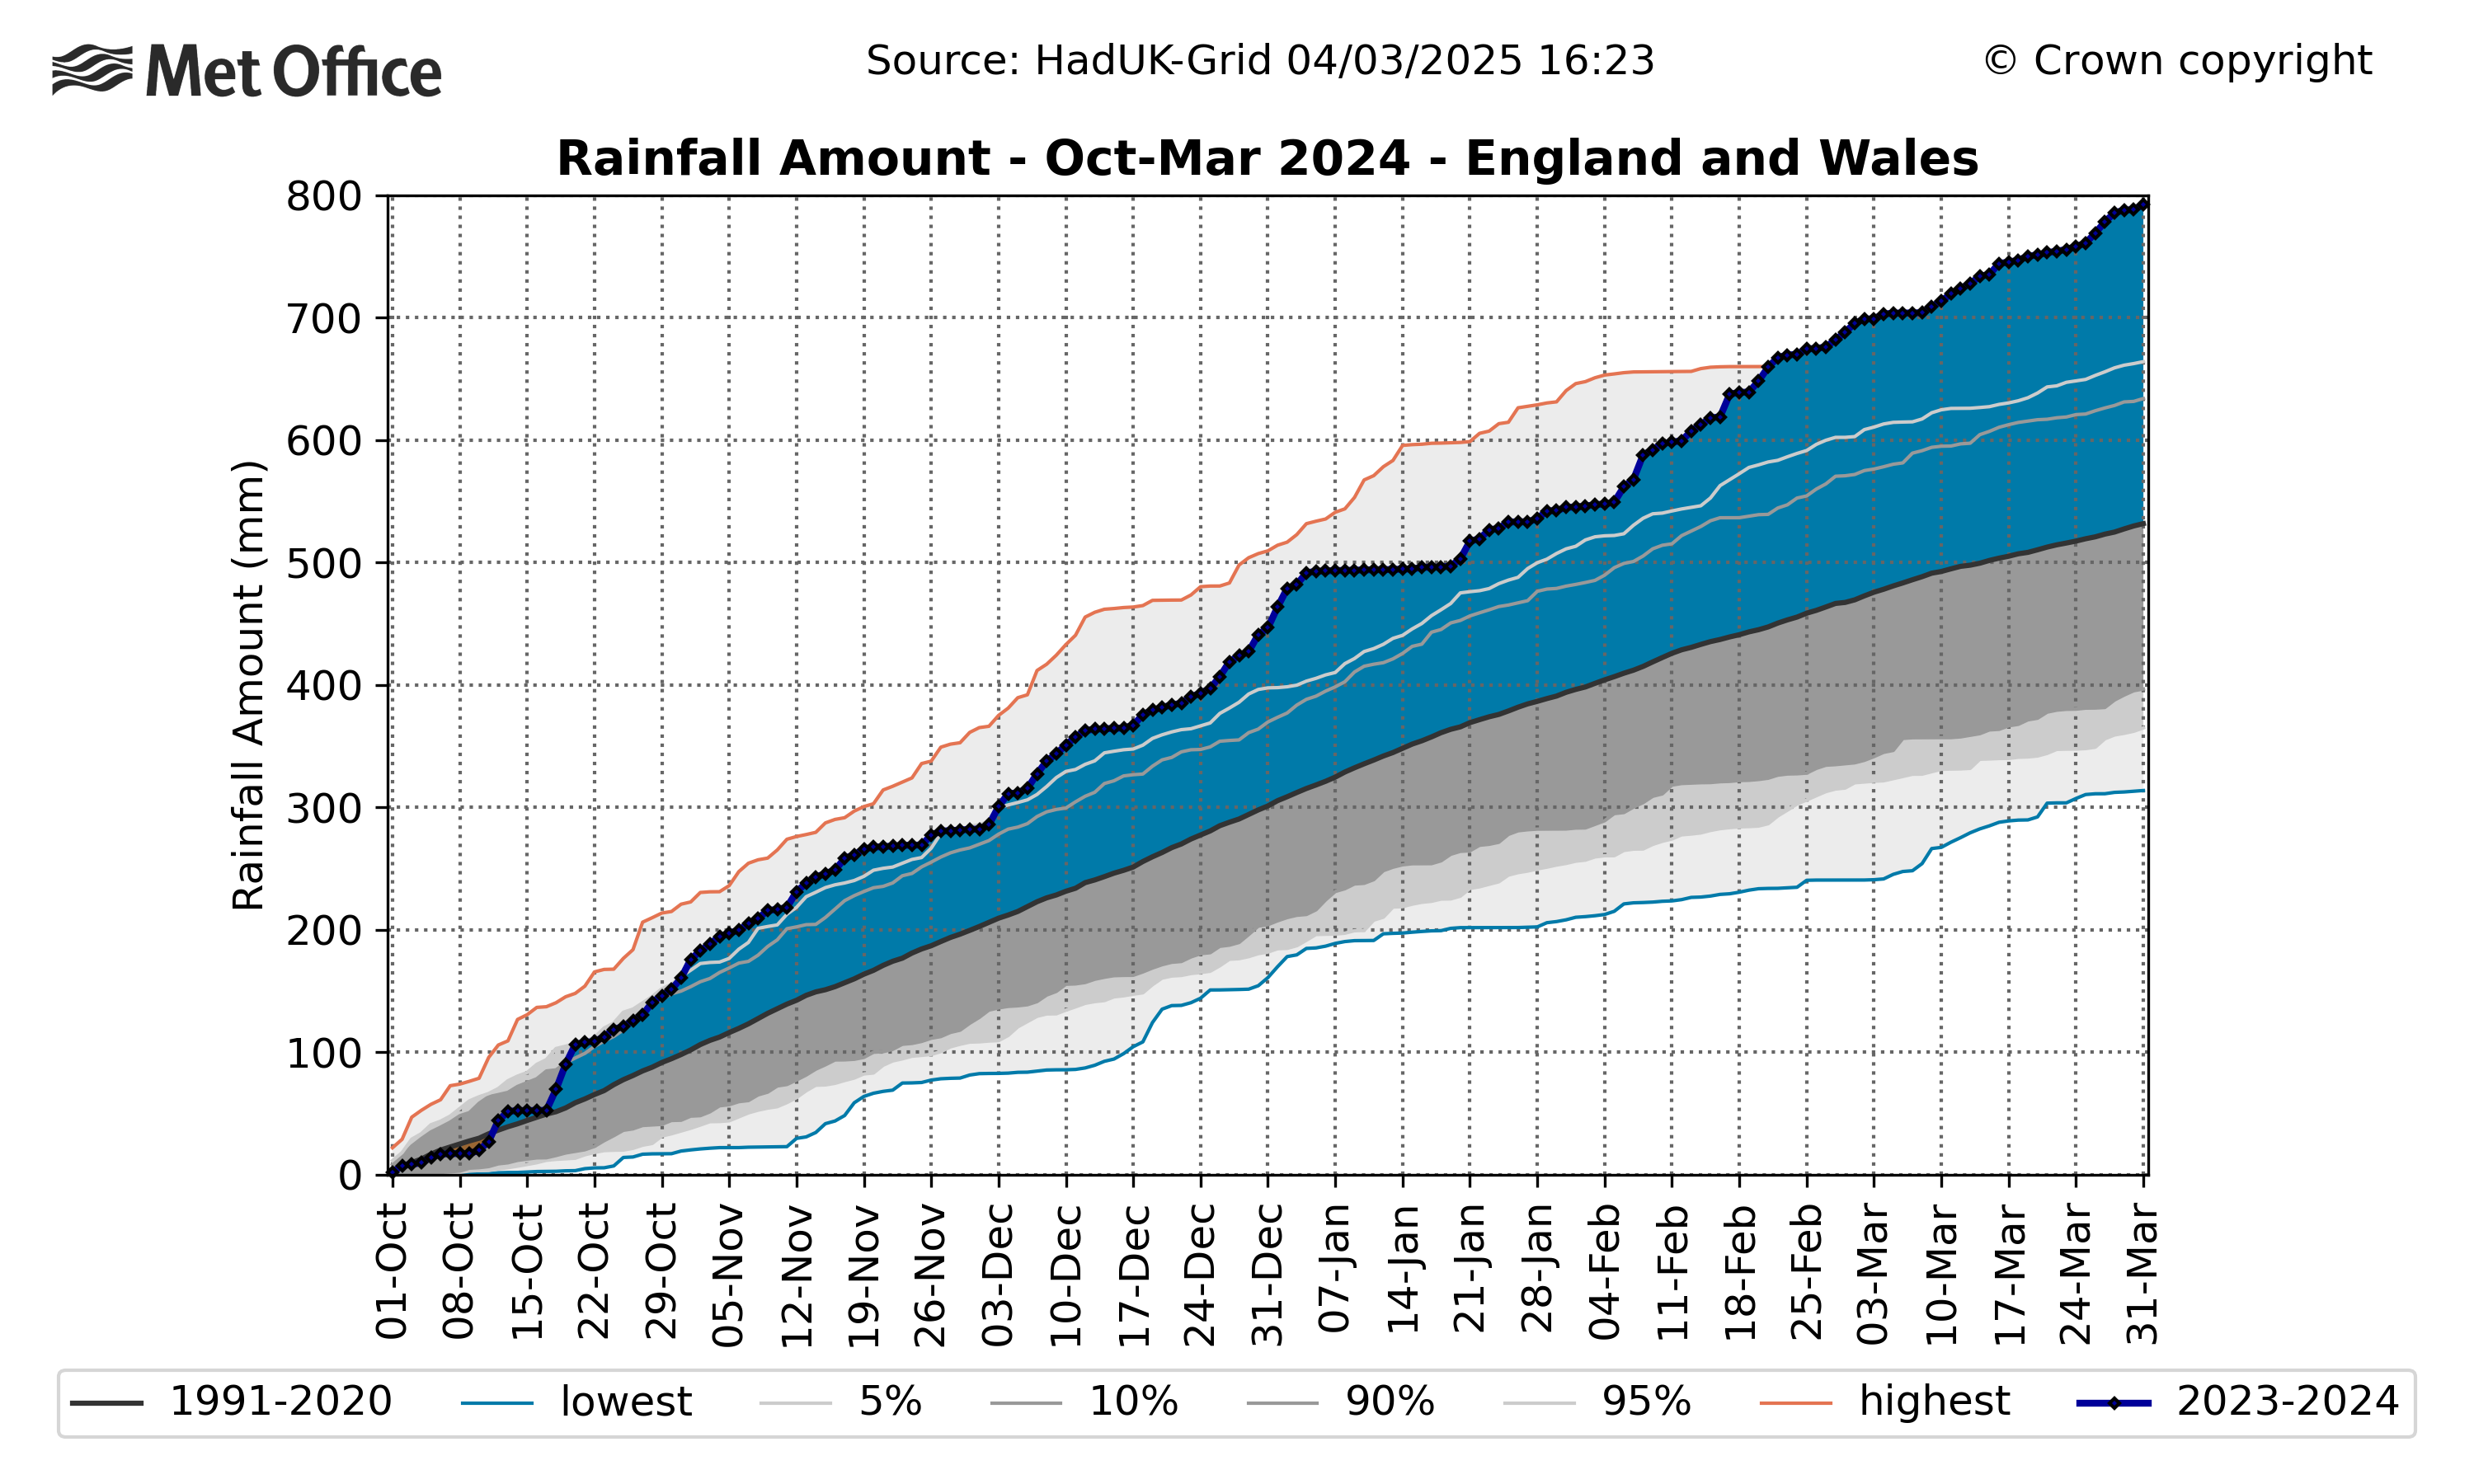
As the UK’s climate warms, it is also becoming wetter, with this report showing that the increase in rainfall is entirely due to an upward trend in the winter half-year (October to March). For 2015-2024 the winter half-year is now 16% wetter than 1961-1990 for the UK.
 Met Office Climate Scientist and Lead Author of the State of the UK Climate report, Mike Kendon, said: “Every year that goes by is another upward step on the warming trajectory our climate is on. Observations show that our climate in the UK is now notably different to what it was just a few decades ago. We are now seeing records being broken very frequently as we see temperature and rainfall extremes being the most affected by our changing climate.
“This pace of change and clustering of consecutive records is not a natural variation in our climate. Numerous studies have shown how human emissions of greenhouse gasses are warming the atmosphere and changing the weather we experience on the ground. Our climate in the UK is now different to what it was just a few decades ago, this is clear from our observations.”
Weather extremes in 2024
As in recent years, floods and storms brought the worst severe weather impacts to the UK in 2024.
There was widespread flooding in early January associated with the run of named storms from the Autumn of 2023 including storms Babet, Ciarán, Debi, Elin, Fergus, Gerrit, Henk, Isha and Jocelyn. October 2023 to March 2024 was the wettest winter half-year on record for England and Wales in over 250 years with areas affected by flooding including eastern Scotland, Derbyshire, Nottinghamshire and the West Midlands.
Parts of central England experienced extreme rainfall in late September from three successive low pressure systems. The Oxford Radcliffe Observatory recorded its wettest 2-day period in a near 200-year daily record and wettest calendar month since 1774; some locations recorded three to four times the monthly average rainfall for September. There was widespread disruption with several hundred properties flooded.
Parts of South Wales experienced severe flooding from storm Bert in late November 2024, with 100 to 150mm or more of rain falling across high ground. This was a multi-hazard storm with heavy rain, strong winds and some snow, and several deaths reported.
Red warnings were issued for storm Isha in January and storm Darragh in December – a reminder that such storms are an integral part of our climate due to the UK’s position in the Atlantic storm track. The unusual north-westerly to northerly direction of winds from Darragh is likely to have contributed to the number of trees brought down by this storm. However, observations do not currently suggest that the UK is becoming windier or stormier.
Met Office Chief Scientist, Prof Stephen Belcher, said: “We are experiencing more severe weather events in the UK due to climate change. They are a potent reminder of our responsibility to citizens now, and to future generations, to accelerate efforts to adapt our society and infrastructure to cope with these weather extremes. The climate is likely to continue to change, and so we need to prepare for the impacts that will have on the weather we experience on the ground.”
Wider climate monitoring
Aside from high temperatures and extreme rainfall, the report highlights a range of other metrics which chart the UK’s changing climate. Both air and ground frosts have steadily declined from the 1980s, with now more than two weeks’ fewer air frosts in the most recent decade (2015-2024) compared to the period between 1931-1990.
UK near-coast sea surface temperatures have been on average 0.3°C warmer than a decade ago and nearly a degree warmer than 1961-1990. Five of the ten warmest years for these sea surface temperatures have occurred in the most recent decade (2015-2024), with 2024 ranked sixth warmest.
The number and severity of snow events in the UK has declined since the 1960s and the UK’s climate has become sunnier since the 1980s, primarily driven by increases in winter and spring sunshine.
Chief Executive of the Royal Meteorological Society, Professor Liz Bentley, said: “This latest edition of the State of the UK Climate report reinforces the clear and urgent signals of our changing climate, rooted in robust observational science. It documents changes in temperature, rainfall, sea level, and weather extremes that are affecting lives, infrastructure, and ecosystems across the UK.
“The report draws particular attention to the last decade that clearly shows how quickly our climate is evolving to inform policy, resilience planning, and adaptation. Perhaps most striking is the growing impact of extremes. While long-term averages are shifting, it is the extreme heat, intense rainfall and droughts that are having the most immediate and dramatic effects on people and nature. This report is not just a record of change, but a call to action.”
Sea level rise
Tide gauge records since the 1900s provide observational evidence that sea level rise around the UK is accelerating, with two-thirds of the observed sea level rise over that period happening in just over the last three decades. For the first time this report highlights the UK sea level is rising faster than the global average.
Looking at 2024 specifically, the most extreme sea levels were associated with Storm Kathleen in early April, which coincided with spring tides and was influenced by high background mean sea levels.
Dr Svetlana Jevrejeva from the National Oceanography Centre, said: “The storm surge events the UK experienced in 2024 demonstrate the potential for the UK to be affected by coastal flooding. As sea levels continue to rise around the UK, this risk is only going to increase further. The timing of storms relative to the spring-neap tidal cycle is critical, but, as we know from historical events, it is only a matter of time until the UK is next in the path of a major storm surge event. This extra sea level rise contribution is leading to an increase in the frequency of extreme sea levels and an intensification of coastal hazards”.
Phenology
In the UK, earlier springs may be Nature’s most noticeable reaction to the changing climate. The timing of seasonal activity in plants and animals (phenology) is recorded in the UK by a volunteer network, via the Nature’s Calendar citizen science project.
Records collected in 2024 show that Spring was earlier than average for 12 of the 13 spring events monitored, and the earliest in the series (1999-2024) for both frogspawn appearing and blackbird nesting. The 2024 tree ‘leaf-on’ season was also longer than the 1999–2023 baseline, mainly due to the earlier spring.
Dr Judith Garforth from the Woodland Trust, said: “Looking at the phenology data we can see examples of how nature is responding to both weather, in the short-term, and climate, in the long-term.
“For example, the particularly warm weather in February 2024 resulted in the earliest UK average frogspawn-sighting since the series began in 1999; but over the longer-term, hazel flowering, which can occur as early as December, is starting to show an advancing trend over the whole 26 years of the data series”