
Wet September to start meteorological autumn
September 2025 was a wet month for much of the UK, though not enough to trouble any longstanding records, according to provisional Met Office statistics.
After the hottest summer on record with below-average rainfall and areas reaching drought status, meteorological autumn has started with a wet month and temperatures around average for many.
Wet September for many
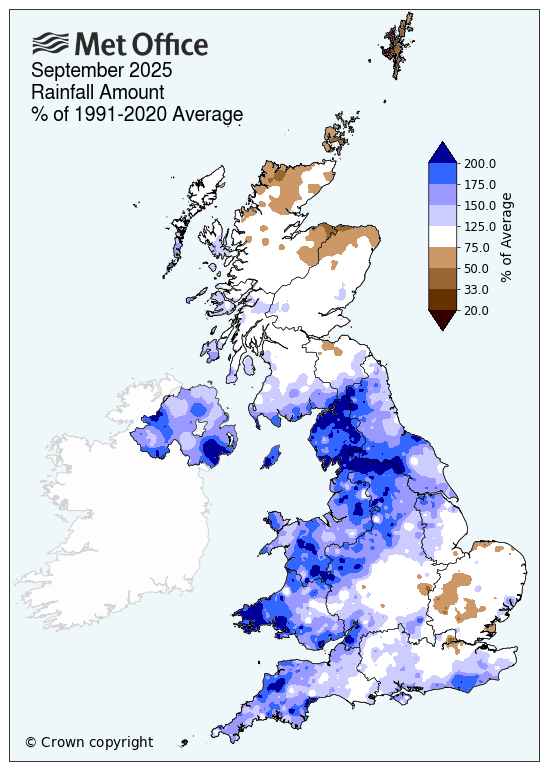
The UK provisionally saw 32% more rain than the long-term average in September, with a large swathe of England, Wales and Northern Ireland seeing generally seeing the wetter conditions.
Of the UK’s nations, Scotland was slightly drier, though even here still saw slightly above average rainfall, with 125.8mm or 2% more than the long-term average.
In contrast, Wales was the wettest nation in the month and had 74% more rain than average.
England and Northern Ireland also saw above average rainfall, with 102.0mm (49% more than average) and 144.6mm (65% more than average) of rain respectively. At a county level, Cumbria had its fourth wettest September in a series from 1836, and its wettest since 1950.
Dr Emily Carlisle is a scientist at the Met Office. She said: “In a change from recent months, September brought frequent rain as a succession of low pressure systems brought frontal rain across the country for the first few weeks of the month. We’ve also seen some heavy downpours at times from thunderstorms.
“While there have been drier interludes at times, not least further south in recent days, September 2025 goes down as a wet month, with temperatures and sunshine hours generally closer to average.”
Average temperatures for many
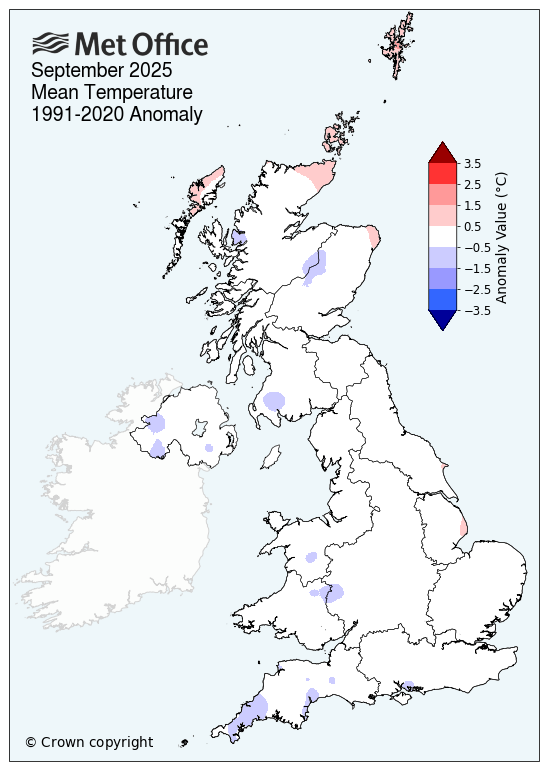
The average mean temperature for September 2025 was provisionally 12.8°C, which is slightly below the long-term meteorological average.
England, Wales, Scotland and Northern Ireland were all fractions of a degree from their long-term average mean temperature. Only the Northern Isles were significantly warmer than average.
The UK’s highest daily maximum temperature during September 2025 was 27.8°C, with the lowest overnight minimum temperature of -5.0°C giving a flavour of the variable conditions that are possible in a UK autumn.
Above average sunshine
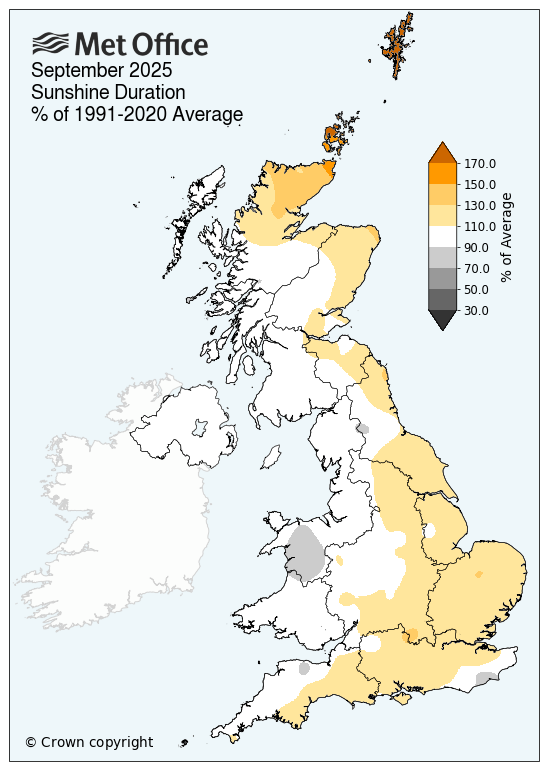
The vast majority of the UK had above average amounts of sunshine through the month, though to varying degrees.
With 140.3 hours of sunshine, the UK provisionally saw 10% more sunshine than average, with England and Scotland also seeing above average sunshine amounts.
Wales and Northern Ireland saw sunshine hours very slightly below their respective long-term averages for the month.
The sunniest skies compared to average were reserved for those further north, with northern Scotland particularly sunny, though not enough to get close to any national records.
|
Provisional September 2025 stats |
Mean temp (°C) |
Rainfall (mm/%) |
Sunshine (hours/ %) |
|||
|
Actual |
91/20 anom |
Actual |
91/20 anom |
Actual |
91/20 anom |
|
|
UK |
12.8 | -0.1 | 120.1 | 132 | 140.3 | 110 |
|
England |
13.8 | -0.1 | 102.0 | 149 | 158.9 | 112 |
|
Wales |
12.7 | -0.4 | 193.7 | 174 | 127.5 | 99 |
|
Scotland |
11.3 | 0.0 | 125.8 | 102 | 117.7 | 110 |
|
Northern Ireland |
12.2 | -0.3 | 144.6 | 165 | 111.1 | 98 |