
Summer 2025 is the warmest on record for the UK
Provisional Met Office statistics confirm that summer 2025 is officially the warmest summer on record for the UK.
Analysis by Met Office climate scientists has also shown that a summer as hot or hotter than 2025 is now 70 times more likely than it would be in a ‘natural’ climate with no human caused greenhouse gas emissions.
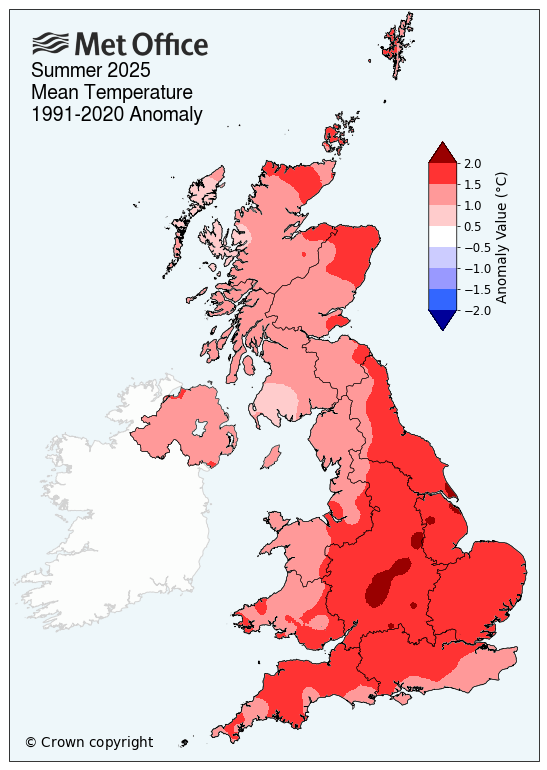
The UK’s mean temperature from 1 June to 31 August stands at 16.10°C, which is 1.51°C above the long-term meteorological average. This surpasses the previous record of 15.76°C, set in 2018, and pushes the summer of 1976 out of the top five warmest summers in a series dating back to 1884.
Met Office scientist Dr Emily Carlisle said: “Provisional Met Office statistics show that summer 2025 is officially the warmest on record with a mean temperature of 16.10°C, surpassing the previous record of 15.76°C set in 2018.
“The persistent warmth this year has been driven by a combination of factors including the domination of high-pressure systems, unusually warm seas around the UK and the dry spring soils. These conditions have created an environment where heat builds quickly and lingers, with both maximum and minimum temperatures considerably above average.”
1976, which had a mean temperature of 15.70°C, has now dropped out of the top five warmest summers since records began in 1884, leaving all five warmest summers having occurred since 2000.
The five warmest UK summers on record are now:
-
2025: 16.10°C
-
2018: 15.76°C
-
2006: 15.75°C
-
2003: 15.74°C
-
2022: 15.71°C
Consistently above-average temperatures
June and July both delivered consistently above-average temperatures. England recorded its warmest June on record, while Wales and the UK overall saw their third and second warmest Junes respectively. July continued the trend, making it the UK’s fifth warmest July on record.
Four heatwaves but no extreme peaks
Summer 2025 has seen four heatwaves, each relatively short-lived and interspersed with near-average conditions. The highest temperature recorded was 35.8°C in Faversham, Kent. This is just below the peak temperature of 35.9°C recorded in 1976 and also below the UK’s all-time high of 40.3°C, set in July 2022.
How does 1976 compare?
The summer of 1976 remains iconic, with 16 days exceeding 32°C, compared to nine days in 2025. The persistence of the 1976 heatwave means that 1976 still holds the record for the highest average summer maximum temperature, while the persistent warmth of 2025 means it holds the record for mean temperature.
Read more about UK temperature extremes and records most affected by climate change
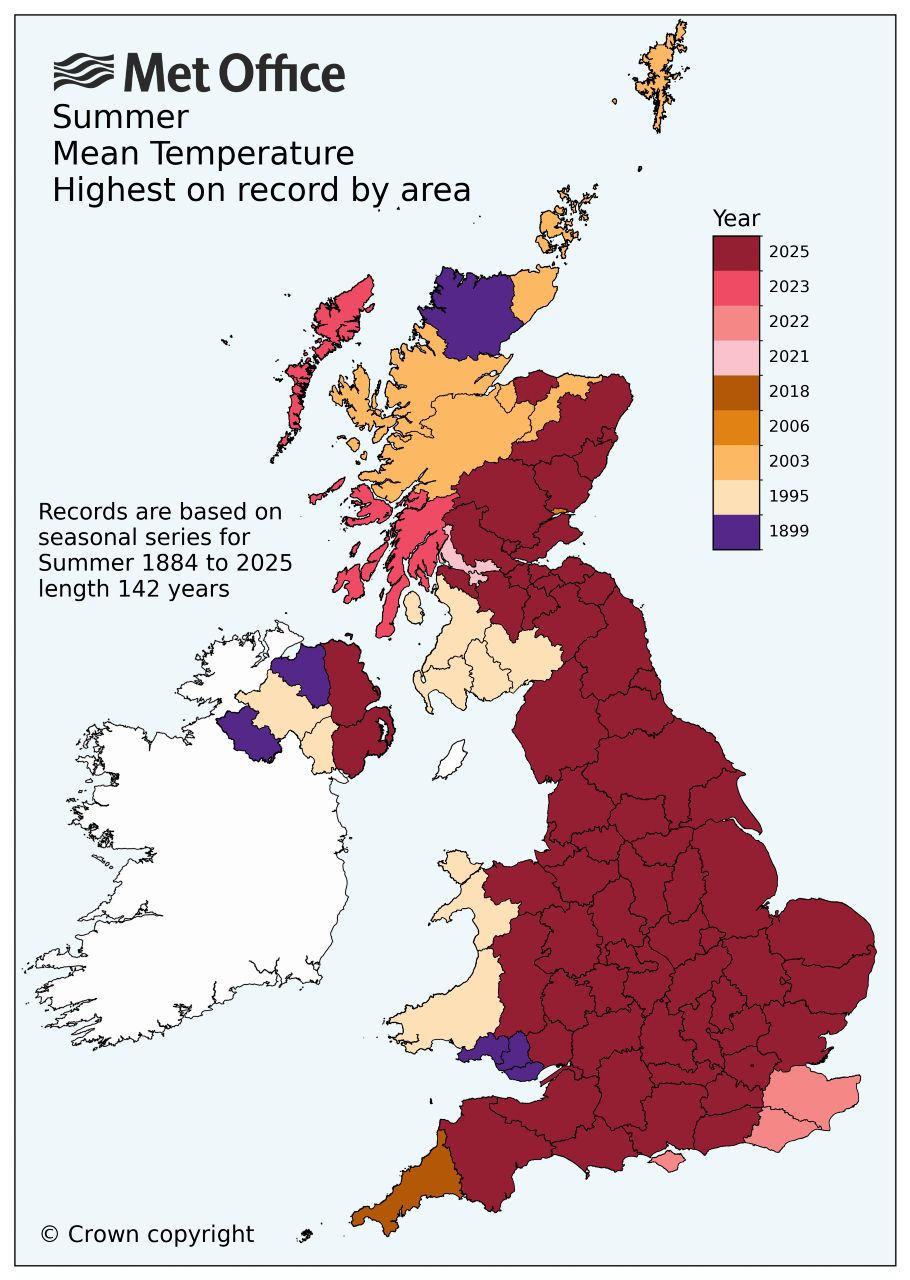
The below map shows the years with the highest UK mean summer temperature by area from 1884 to 2025.
Impact of climate change on 2025 record-breaking summer
Rapid analysis by Met Office climate scientistsusing peer-reviewed methods described in this technical report has shown that a summer temperature as high as 2025 has been made around 70 times more likely because of human induced climate change.
Head of climate attribution at the Met Office, Dr Mark McCarthy, said: “Our analysis shows that the summer of 2025 has been made much more likely because of the greenhouse gases humans have released since the industrial revolution. In a natural climate, we could expect to see a summer like 2025 with an approximate return period of around 340 years, while in the current climate we could expect to see these sorts of summers roughly 1 in every 5 years.
“Another interesting finding from our analysis is the context of this summer against other record-breaking summers, like that of 1976. Our analysis suggests that while 2025 has set a new record, we could plausibly experience much hotter summers in our current and near-future climate and shows how what would have been seen as extremes in the past are becoming more common in our changing climate"
An attribution study by Met Office scientists published in 2019 looking at the then record-breaking summer of 2018 estimated that record had a statistical return period of approximately 8-9 years. The summer of 2025 has broken that record in 7 years, consistent with these previous findings.
The mean summer temperature between 1991 and 2020, was 14.59°C, more than 0.8°C warmer than the 1961–1990 average. Climate projections indicate that UK summers will continue to become hotter, a trend already evident.
Climate change is reshaping our understanding of what constitutes a record-breaking summer. As baseline temperatures steadily rise, so too do peak temperatures and the frequency of warm spells. What was once considered exceptional is increasingly becoming typical. Against this elevated climate backdrop, higher temperatures are no longer anomalies, they’re becoming the new normal.
Find out more about the effects of climate change on UK weather events.
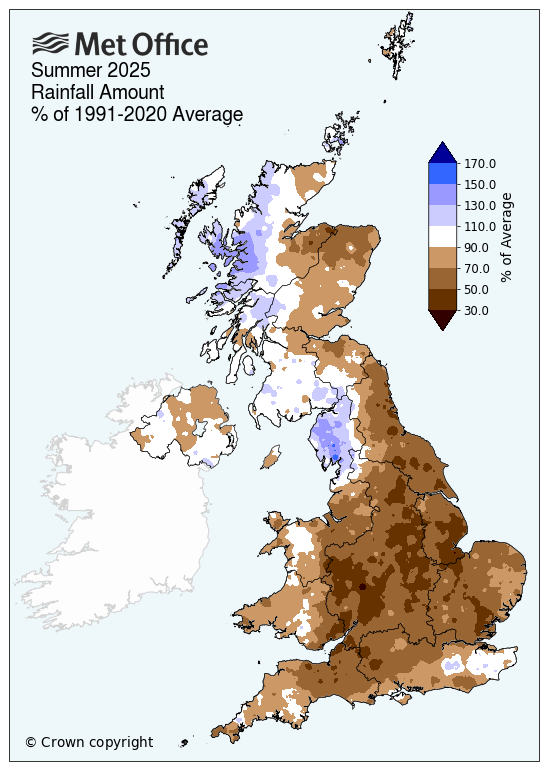
Below-average, but variable rainfall
Rainfall this summer is below average, with provisionally just 84% of the long-term seasonal average recorded. However, rainfall has varied significantly across the UK with central, southern and eastern parts of England and Wales especially dry, whilst north-western parts of the UK, especially Scotland, have been much wetter.
England is the driest of the UK nations, and Scotland the wettest. This follows England's driest spring in more than 100 years and the driest January–July period since 1929.
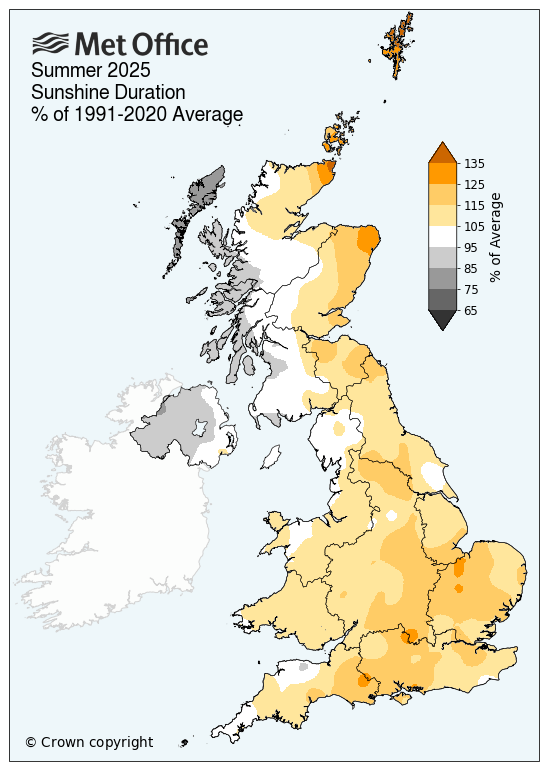
Above-average sunshine
Sunshine levels have been above average across the UK (110%), away from Northern Ireland (93%).
Why has it been so persistently warm?
Several factors have contributed to the persistent warmth:
-
High-pressure has dominated our weather this summer keeping conditions stable.
-
A significant marine heatwave around the UK has enhanced air temperatures.
-
Climate change continues to play a role, with the UK warming at a rate of approximately 0.25°C per decade.
Recent years reflect this trend: 2025, 2023, 2022, and 2018 all rank among the UK’s top ten warmest summers since records began in 1884.
A deeper dive into the summer 2025 statistics
Read: How does summer 2025 compare to summer 1976
|
Provisional Summer 2025 stats |
Mean temp (°C) |
Rainfall (mm/%) |
Sunshine (hours/ %) |
|||
|
Actual |
91/20 anom |
Actual |
91/20 anom |
Actual |
91/20 anom |
|
|
UK |
16.10 | 1.51 | 212.1 | 84 | 556.3 | 110 |
|
England |
17.42 | 1.69 | 142.1 | 69 | 640.0 | 113 |
|
Wales |
16.06 | 1.43 | 239.5 | 79 | 558.1 | 108 |
|
Scotland |
14.05 | 1.27 | 314.8 | 99 | 444.4 | 105 |
|
Northern Ireland |
15.35 | 1.29 | 250.6 | 93 | 394.0 | 93 |
August, a month of contrasts
August delivered a mix of weather, with a named storm, a heatwave, showers, thunderstorms, and drought conditions.
The sixth named storm of the year, Storm Floris, arrived on 4 August, bringing strong winds and heavy rain, particularly to northern Scotland.
Heatwave conditions were met in parts of central and eastern England between 11 and 15 August, contributing to a month of elevated temperatures.
Rainfall was variable, with Scotland recording 83% of its average rainfall compared to England at 42%.
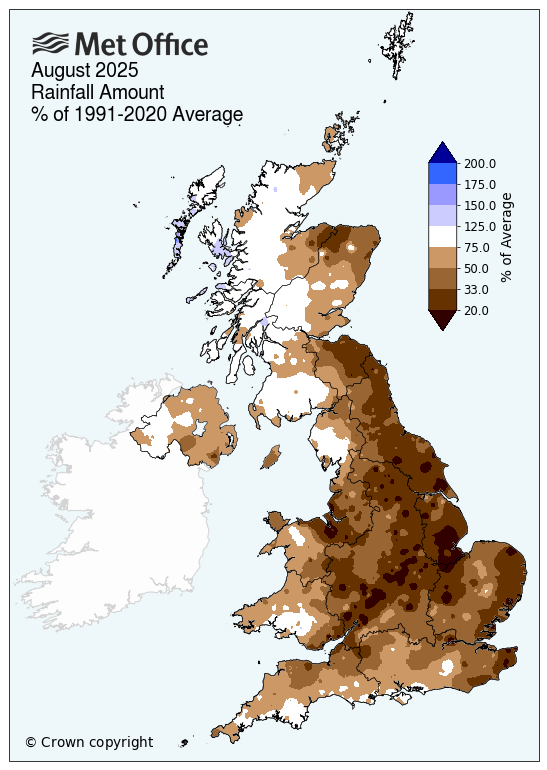
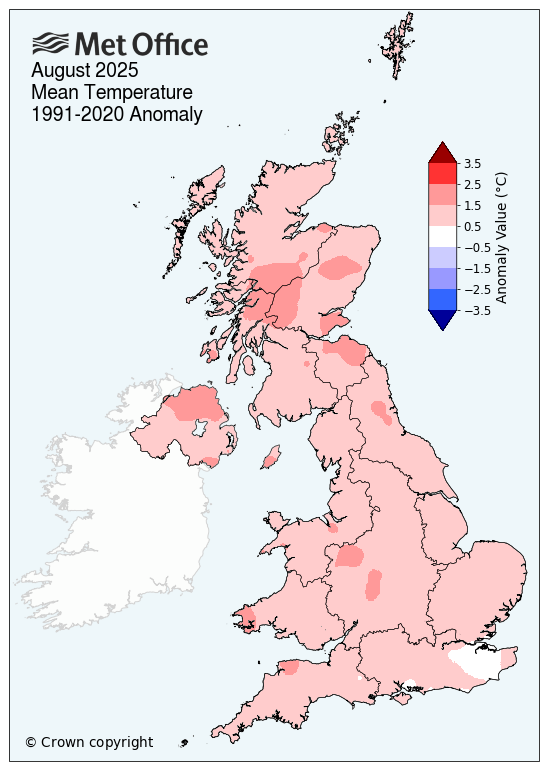
Mean temperatures across the UK were provisionally 16.3°C, 1.2°C above average, with maximum temperatures approximately 1.5 to 2°C above average for much of the country.
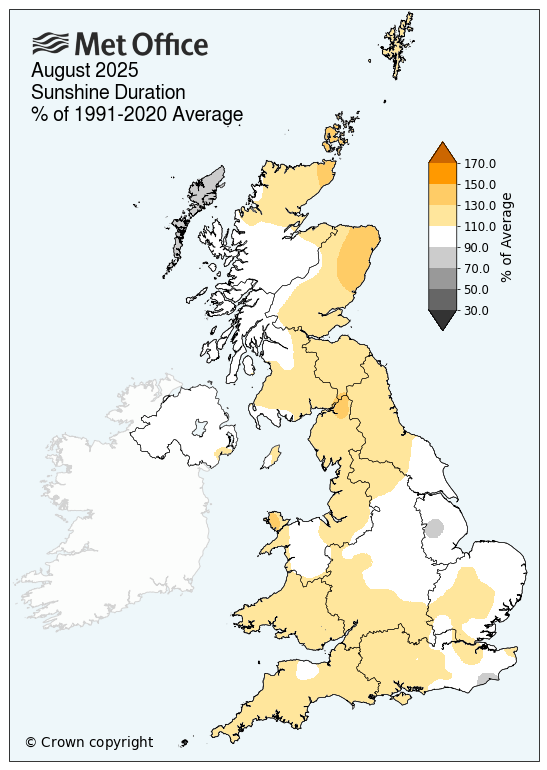
Sunshine hours were also above average, with the UK overall provisionally recording 180.7.3 hours, 112% of the long-term average.
|
Provisional August 2025 stats |
Mean temp (°C) |
Rainfall (mm/%) |
Sunshine (hours/ %) |
|||
|
Actual |
91/20 anom |
Actual |
91/20 anom |
Actual |
91/20 anom |
|
|
UK |
16.3 | 1.2 | 58.4 | 62 | 180.7 | 112 |
|
England |
17.4 | 1.1 | 31.3 | 42 | 200.7 | 111 |
|
Wales |
16.3 | 1.2 | 67.2 | 60 | 185.9 | 116 |
|
Scotland |
14.6 | 1.3 | 99.9 | 83 | 153.3 | 114 |
|
Northern Ireland |
15.9 | 1.4 | 66.8 | 67 | 138.7 | 102 |
How do we know when records are broken?
The answer lies in a Met Office dataset that's been quietly mapping our weather history for around the last two centuries.
Read: How do we know when weather records are broken?
Read: People spend over two days a year talking about the weather