Record breaking rainfall
Author: Press Office
11:18 (UTC) on Mon 2 Mar 2020
Wettest February on record and 5th wettest Winter.
February 2020
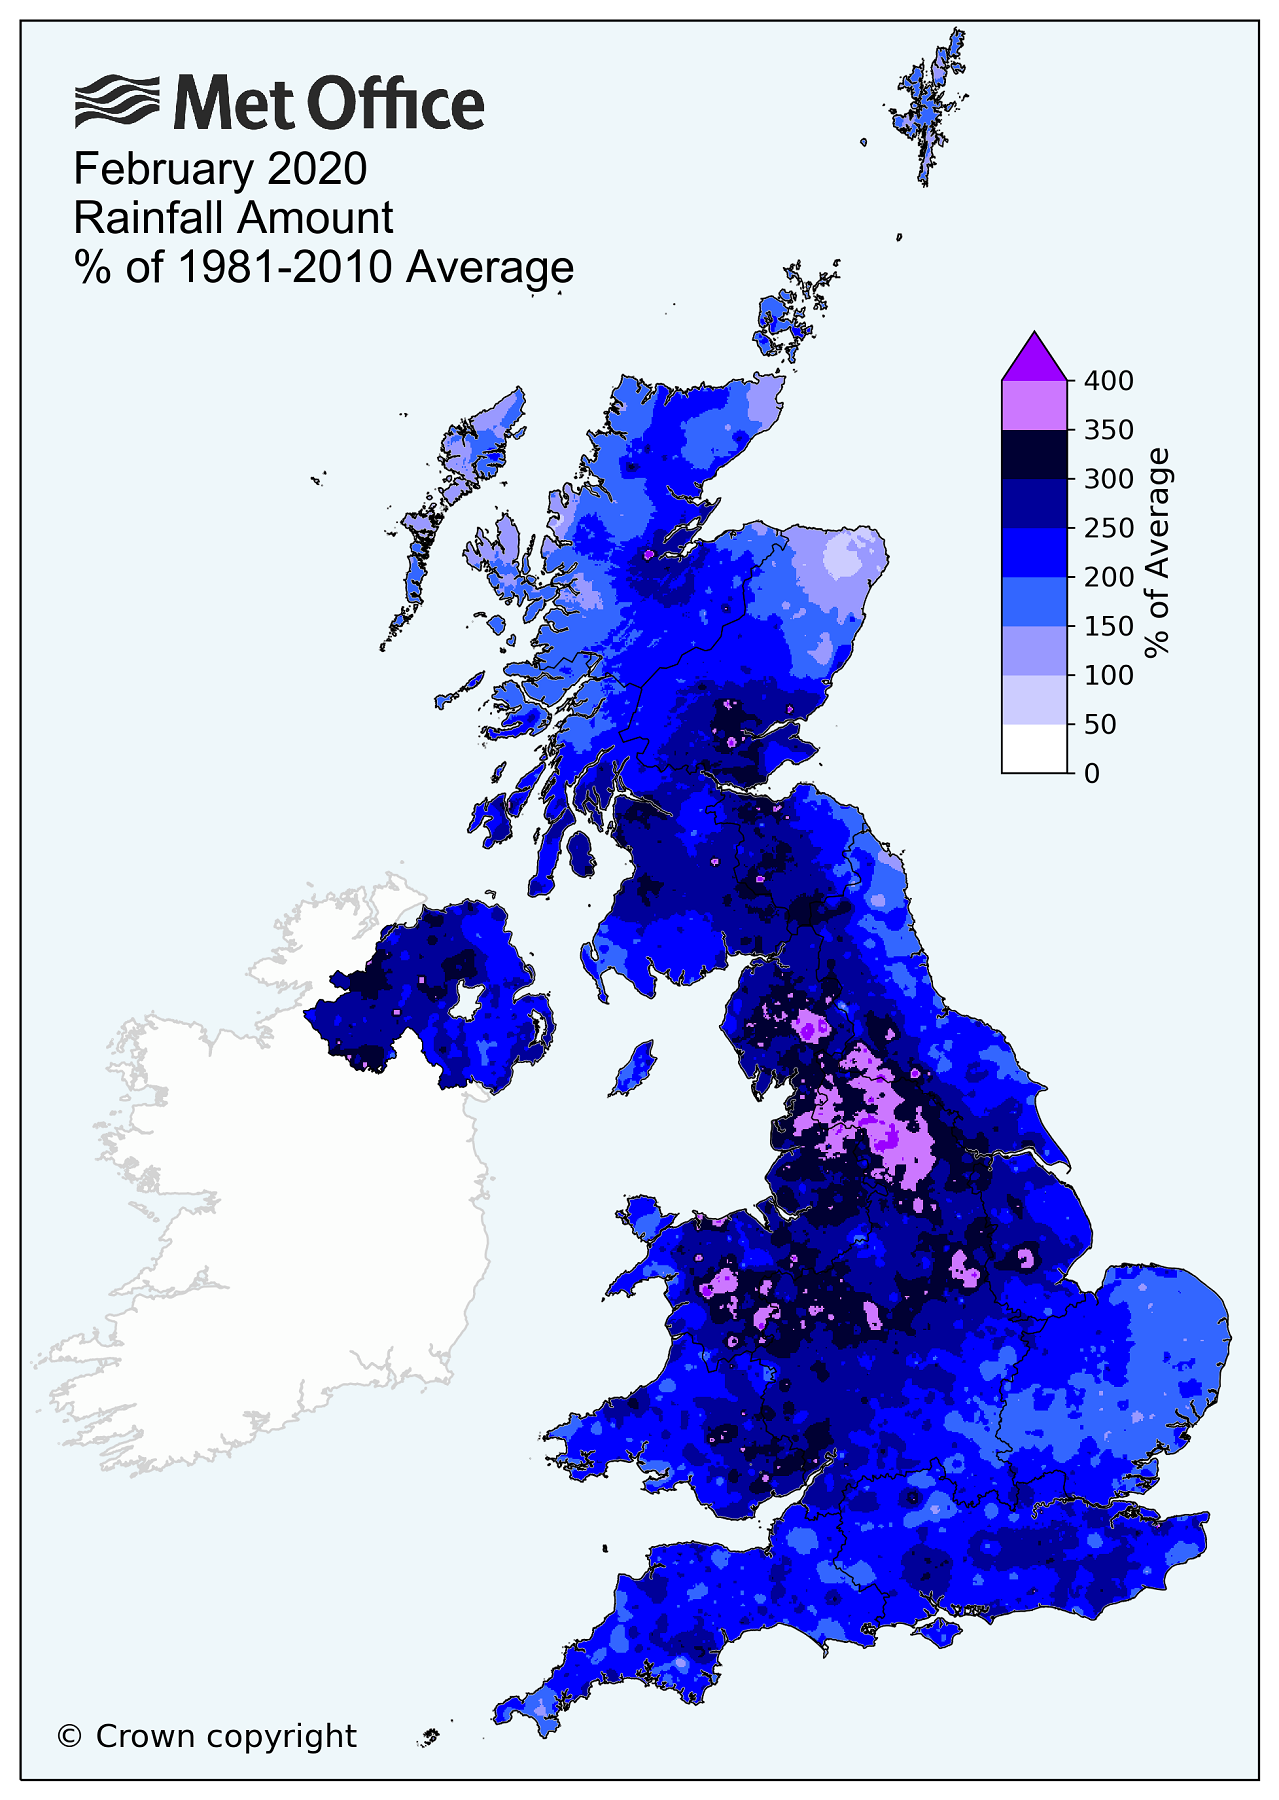
February 2020 has been the wettest February on record for UK, England, Wales and Northern Ireland, and the second wettest (behind February 1990) for Scotland. It has also been the fifth wettest of any calendar month in a series from 1862 behind only October 1903 (227mm), December 2015 (217mm), November 2009 (215mm), and December 1929 (213mm).
| Area | Rainfall | |
|---|---|---|
| Actual mm | % Anomaly 1981/2010 | |
| UK | 209.1 | 237 |
| England | 154.9 | 258 |
| Wales | 288.4 | 260 |
| Scotland | 275.6 | 213 |
| Northern Ireland | 222.7 | 267 |
‘Anomaly’ – refers to the anomaly relative to a 1981-2010 baseline climatology given as a percentage
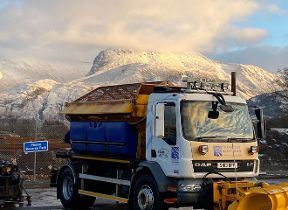
 Three named storms crossed the UK during February, Ciara, Dennis and Jorge. The heavy rainfall throughout the month resulted in some severe impacts with many areas flooded, including parts of Yorkshire, Wales and the Midlands.
John Curtin, Executive Director for Flood Risk Management at the Environment Agency said: “Record February rainfall and river levels have tested the nation’s flood defences; however we have been able to protect over 80,000 homes thanks to the action we have taken.
“Every flooded home is a personal tragedy, and with a changing climate we will need to become more resilient to flooding. I’d urge the public to be aware of their flood risk, sign up to flood warnings, and make a flood plan if they are at risk. “
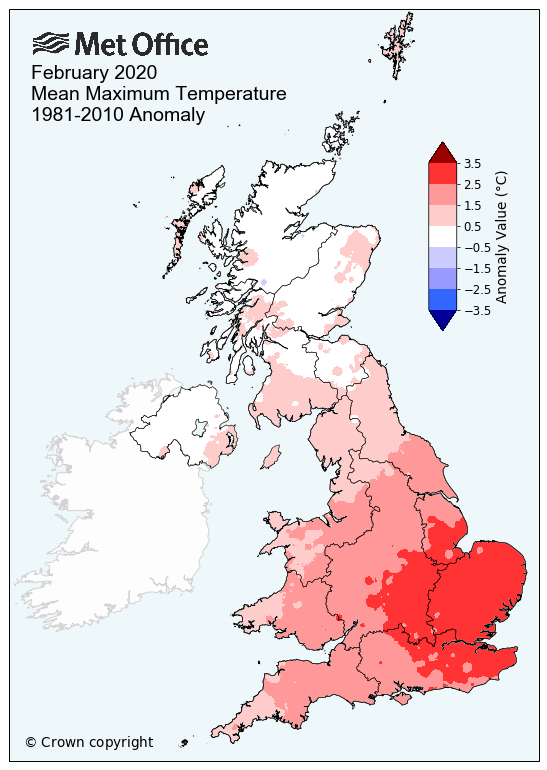
February has been a notably mild, but not record breaking, month for temperature.
| Area | Max Temp | Mean Temp | Sunshine | |||
|---|---|---|---|---|---|---|
| Actual °C | Anomaly | Actual °C | Anomaly | Actual hours | % Anomaly | |
| UK | 8.0 | 1.4 | 5.1 | 1.4 | 72.09 | 104 |
| England | 9.3 | 2.1 | 6.2 | 2.1 | 79.4 | 107 |
| Wales | 8.4 | 1.6 | 5.8 | 1.6 | 63.8 | 91 |
| Scotland | 5.9 | 0.3 | 3.1 | 0.4 | 65.1 | 104 |
| Northern Ireland | 7.7 | 0.3 | 4.6 | 0.3 | 70.1 | 105 |
‘Anomaly’ – refers to the anomaly relative to a 1981-2010 baseline climatology given as a difference (temperature) or as a percentage (rainfall and sunshine)
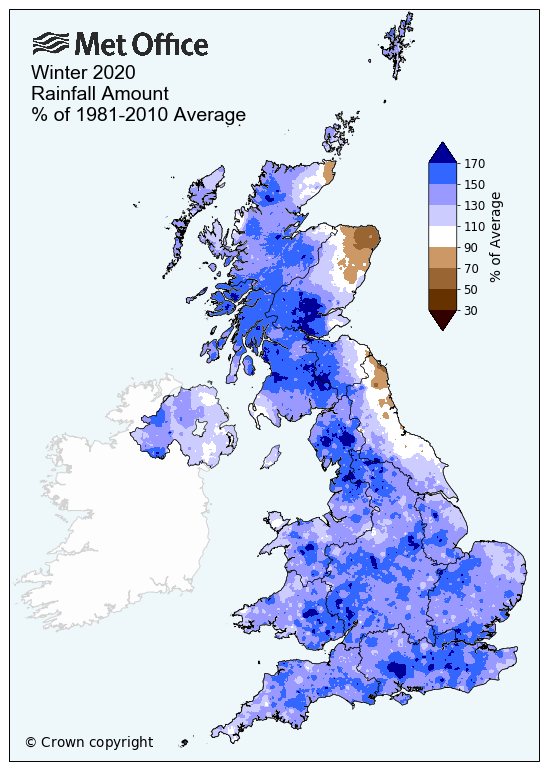
Winter 2020
This winter (December, January, February) has been the 5th wettest winter on record (data back to 1862) for the UK as a whole as well as the 5th mildest.
December was slightly wetter than average for the UK overall, just 16% above average, particularly for southern England and East Anglia, which was 30-50% above average. While January was wetter than average across north west Scotland and drier than average for north east England and eastern Scotland, and average for the UK overall.
| Area | Mean temp | Rainfall | Sunshine | |||
|---|---|---|---|---|---|---|
| Actual °C | Anomaly | Actual mm | % Anomaly | Actual Hours | % Anomaly | |
| UK | 5.28 | 1.56 | 469.7 | 143 | 163.7 | 104 |
| England | 5.98 | 1.78 | 329.4 | 143 | 194.1 | 110 |
| Wales | 5.76 | 1.57 | 611.2 | 141 | 149.0 | 93 |
| Scotland | 4.01 | 1.32 | 676.3 | 145 | 119.0 | 93 |
| Northern Ireland | 5.13 | 0.76 | 399.8 | 127 | 153.9 | 104 |
Why has it been so wet recently?
Not only has there been a very strong jet stream high in the atmosphere, but it has also been further south than normal. This has allowed a succession of Atlantic storm systems to cross the UK, including Storms Ciara, Dennis and Jorge.
Is this due to climate change?
Met Office records show there is a recent trend of increasing rainfall on seasonal and annual timescales. Since 1998, we have seen six of the ten wettest years on record. However, rainfall patterns in the UK have always shown a large range of natural variation, which makes it more difficult to unambiguously identify long term trends linked to climate change. However, wetter winters have been observed and is consistent with what we expect to happen in the future with continued climate change.
Additionally, there is evidence that the rainfall experienced in single extreme events has been affected by climate change – for example, a study on Storm Desmond, which brought widespread flooding to Northern England and Southern Scotland in 2015, found such events have been made 59% more likely by climate change.
Looking ahead
The weather looks likely to remain rather wet and windy into the middle of March, especially in the north, more settled conditions may start to develop from the south towards the end of the period. It will be predominantly rather cold with overnight frosts likely during any calmer interludes and only occasional milder days, these being more likely later in the period.
You can check the latest weather warnings on our severe weather warnings pages and you can get the most accurate and up to date forecast for your area using our forecast pages and by following us on Twitter and Facebook, as well as using our mobile app which is available for iPhone from the App store and for Android from the Google Play store.