

More extreme weather events with planetary warming
Author: Grahame Madge
15:00 (UTC+1) on Thu 2 Jul 2020
As the planet warms, the intensity, frequency and duration of extreme weather events such as heatwaves and heavy rainfall is expected to increase.
Corresponding decreases in cool weather events along with changes to dry spells are also expected.
Weather data from 36,000 weather stations
Understanding and quantifying this change is the focus of an updated dataset examining weather data from more than 36,000 weather stations between 1901 and 2018. An international team of scientists from 39 different institutions – led by the Met Office – has gathered data to compile a dataset known as HadEX3 containing 29 indices of weather extremes (17 relating to temperature and 12 relating to precipitation). The development and initial analysis of HadEX3 have today been published in a paper in the Journal of Geophysical Research - Atmospheres.
Dr Robert Dunn of the Met Office is the lead author. Commenting on the update, he said: “Looking at the changing climate by studying the frequency of extreme weather events provides a different perspective on climate change, complementing other metrics such as annual average temperature rise.
“It is extreme weather events which make the impacts of climate change real for people, and these events also present the greatest shocks to human health and well-being, financial economies and of course, the biosphere.”
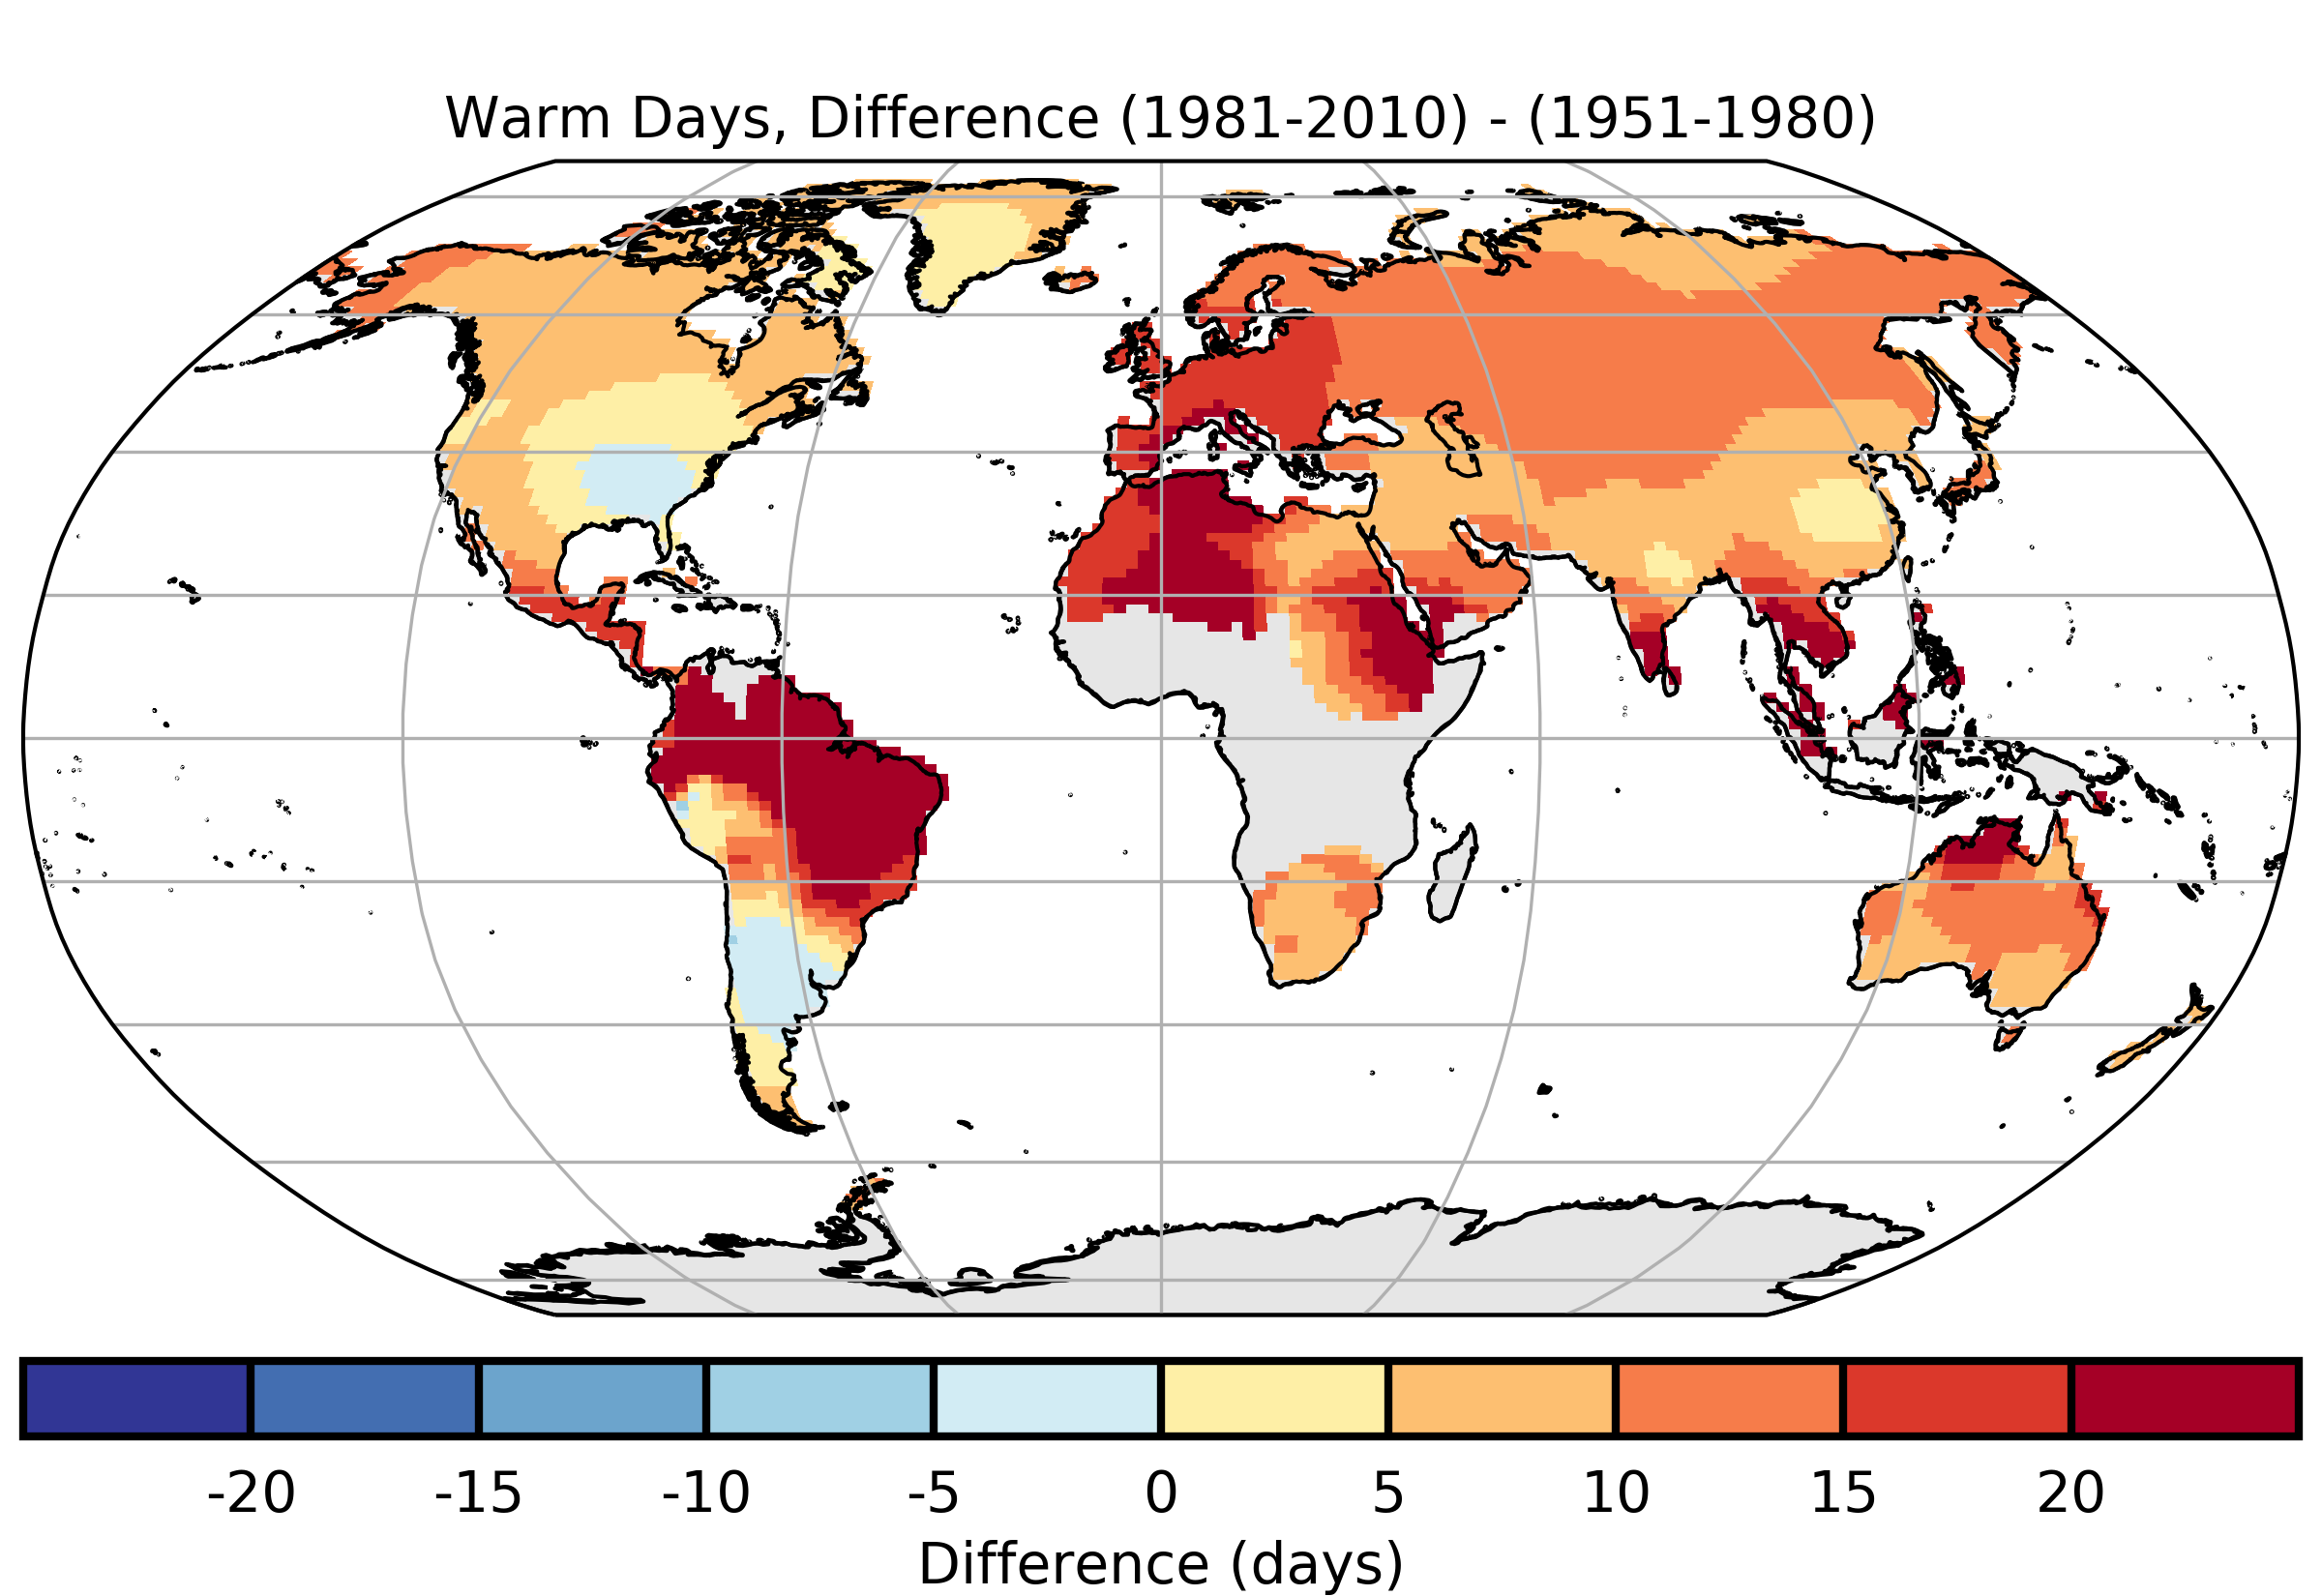
Clear increase in warm days globally
One of the clearest indices tracks the upward trend in daily maximum temperature, showing a clear increase in the number of warm days globally, when compared with the number of warm days between 1961-1990. As the map above shows, the greatest increase is observed in tropical regions of South America, Northern Africa and through Asia. Similarly, the number of warm nights in these regions have increased by over eight days per decade, leading to a doubling since the late 1970s.
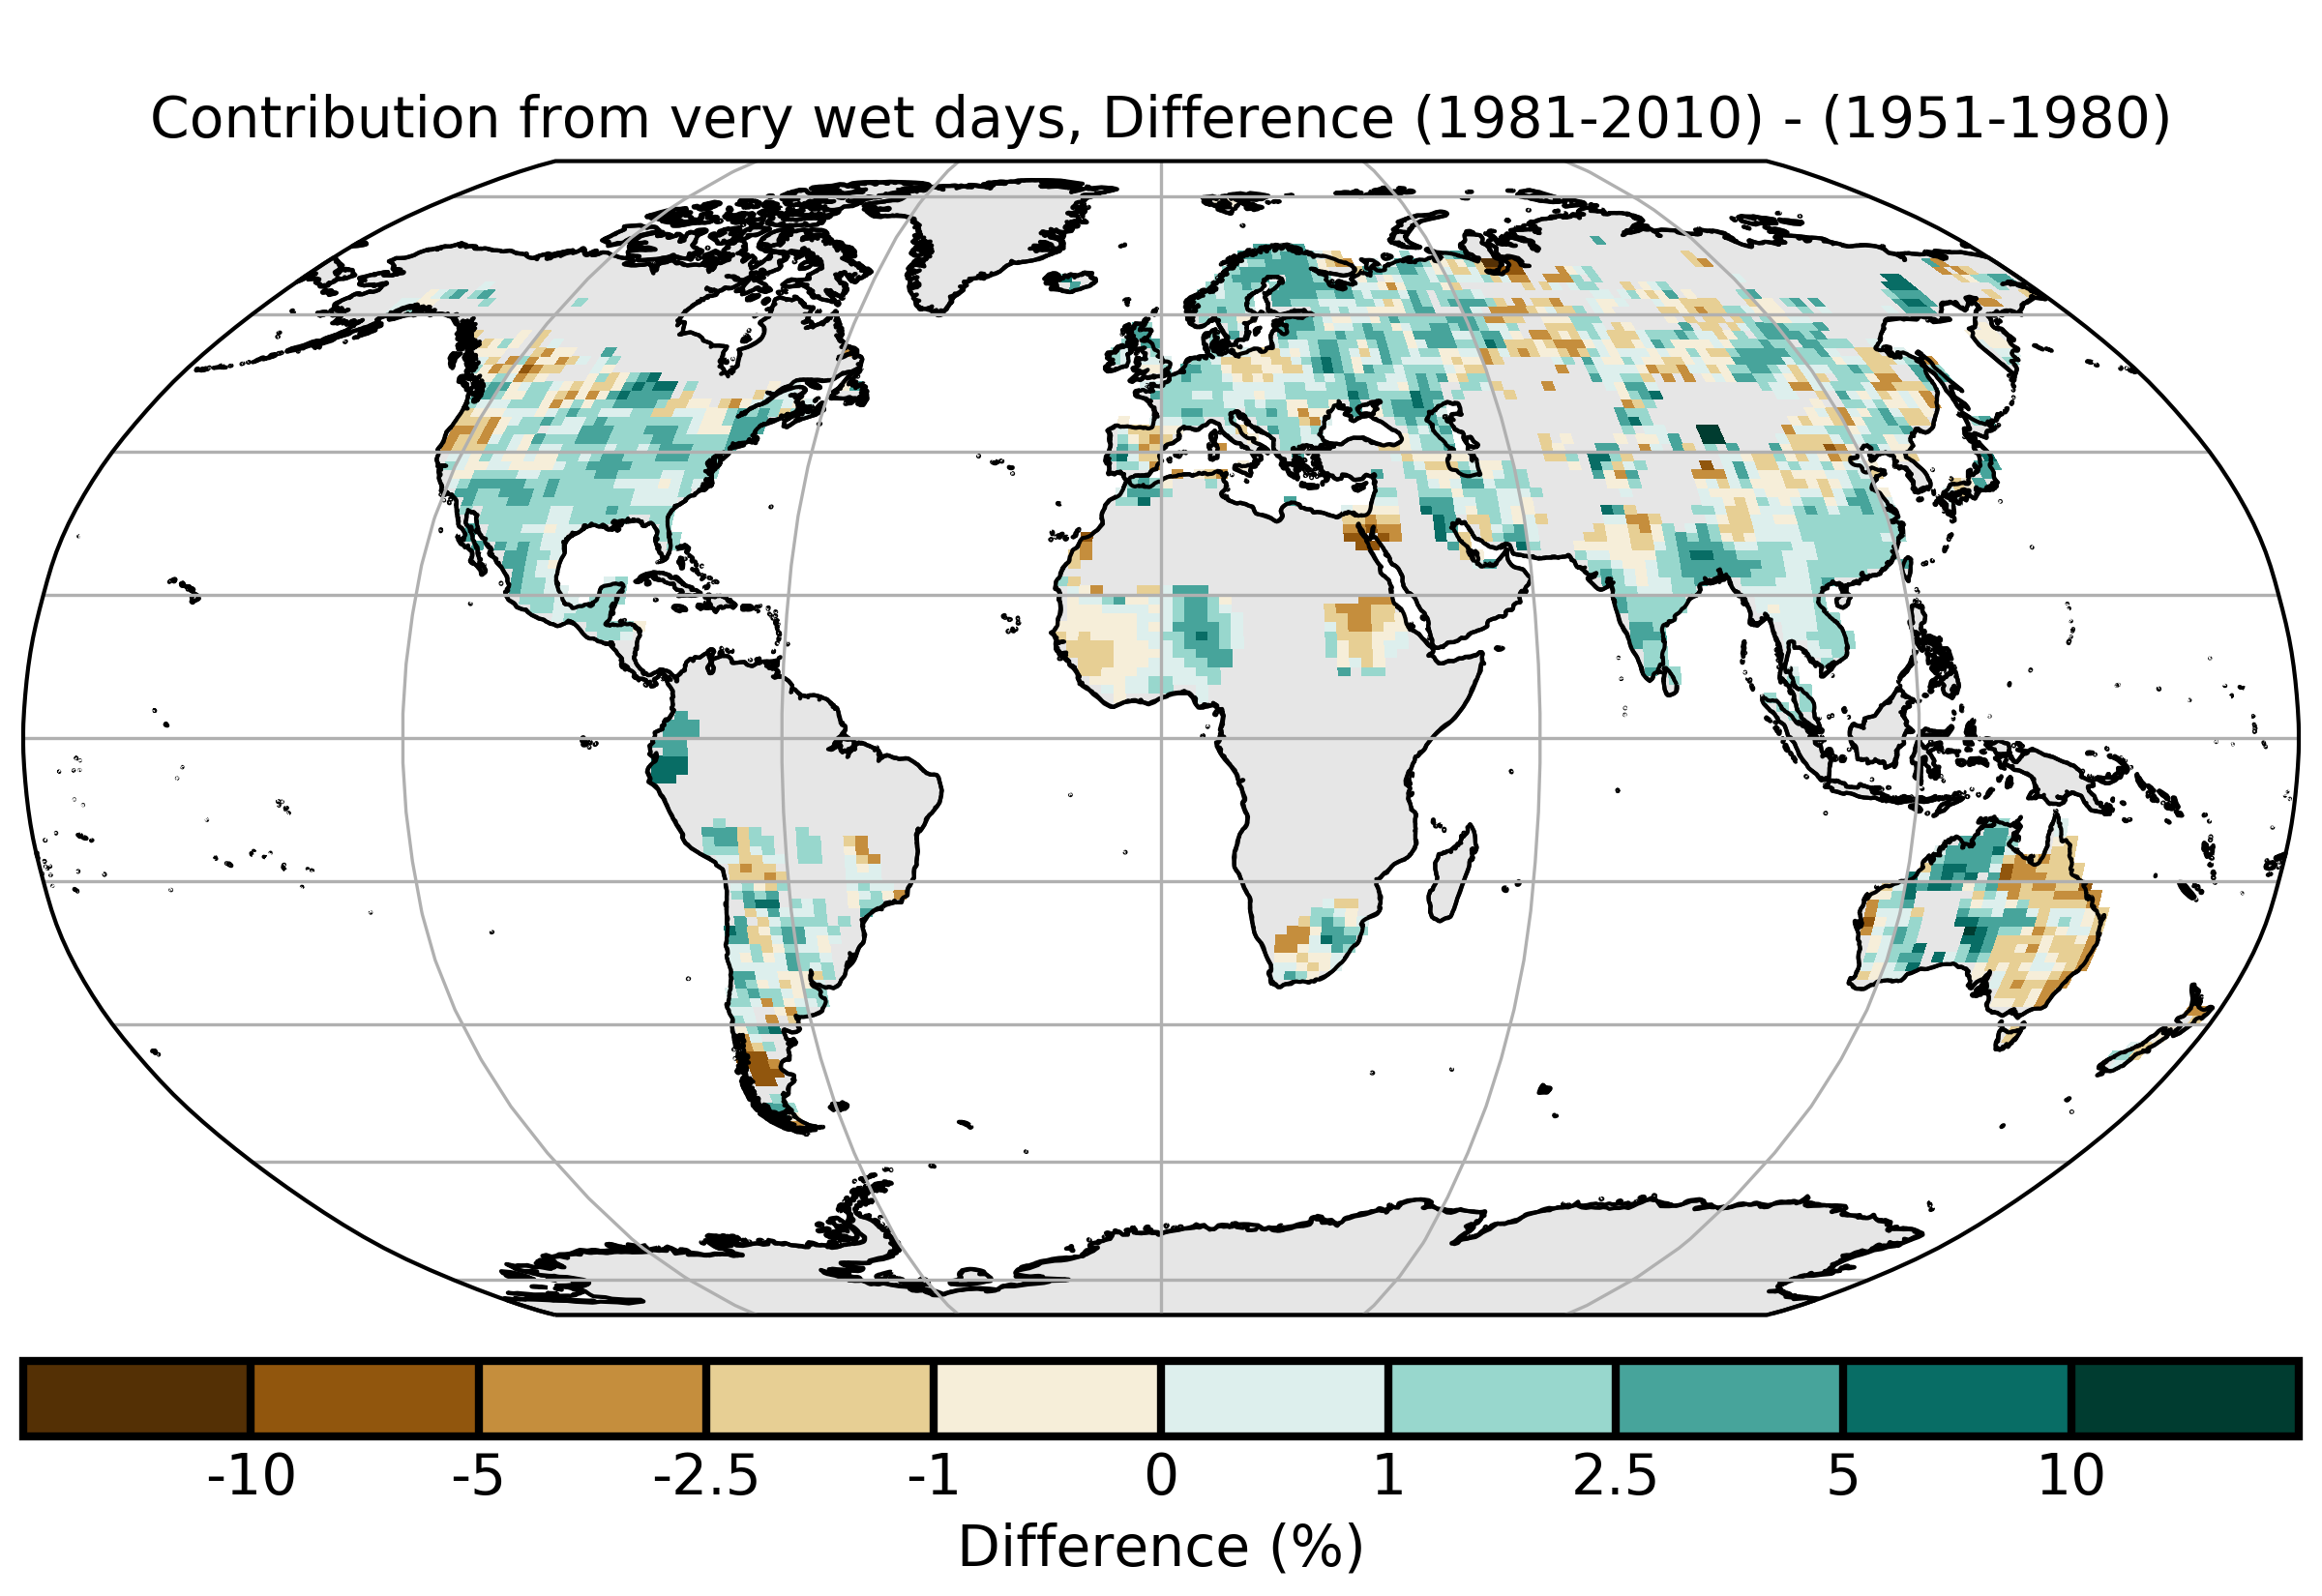
The variability of rainfall over space and time tends to be greater than temperature, so the trend is perhaps less clear, although there is a trend of an increasing contribution to total annual rainfall from very wet days, with an extra two per cent of precipitation falling compared to 1961-90.
The map above compares differences between two periods:1951-1980 and 1981-2010. Some areas such as the equatorial region of eastern South America and north of the Bay of Bengal seeing more rain failing in heavy events, but other areas such as eastern Australia have seen a corresponding decrease.
HadEX3 dataset
HadEX3 is the third version of the HadEX dataset, which was originally released in 2006. HadEX was the first global dataset to contain all 29 indices (17 temperature, 12 precipitation) defined by the WMO/WCRP/JCOMM Expert Team on Climate Change Detection and Indices, and covered the period of 1951-2003. A follow-up effort a few years later resulted in the HadEX2 dataset, released in 2013, which contained data from 1901 to 2010. HadEX3 is available under an Open Government Licence here.