
2020 ends earth’s warmest 10 years on record
Author: Press Office
16:00 (UTC) on Thu 14 Jan 2021
The latest data confirms 2020 concludes the earth’s warmest 10-year period on record.
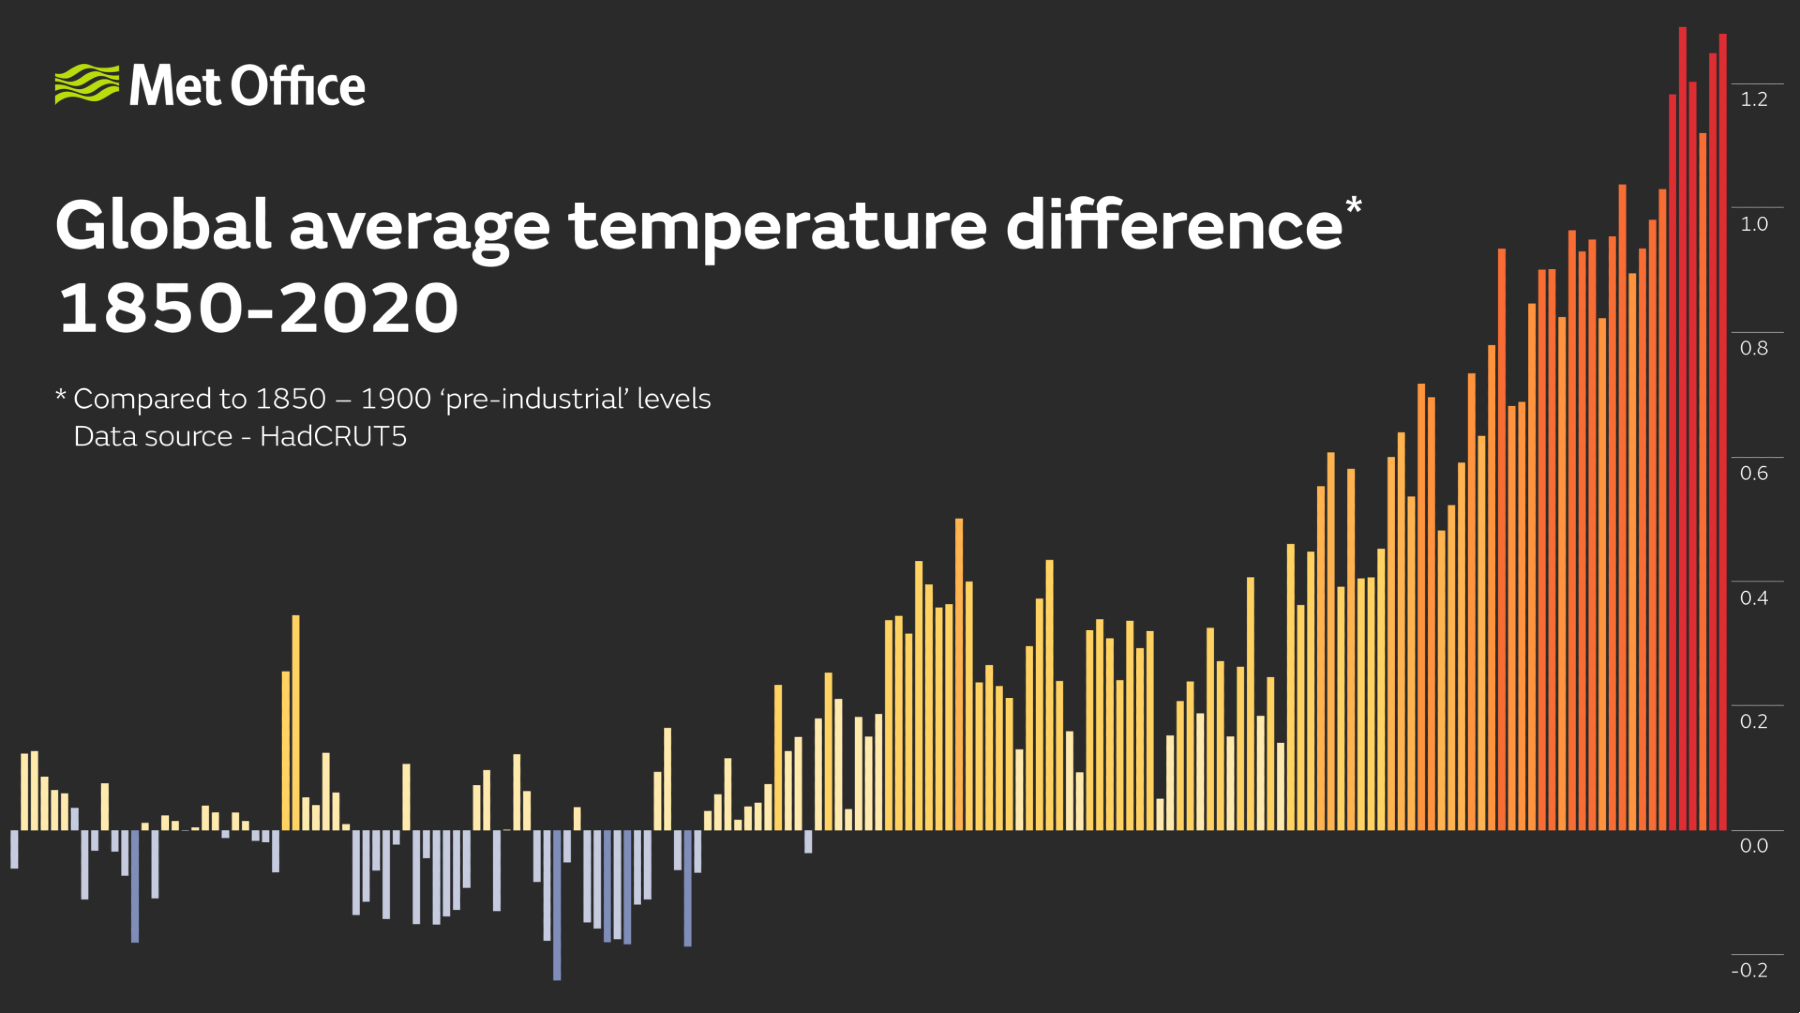
The HadCRUT5 global temperature series, produced by the Met Office, University of East Anglia and UK National Centre for Atmospheric Science, shows that the average for 2020 as a whole was 1.28±0.08°C above pre-industrial levels, taken as the average over the period 1850-1900. This makes 2020 nominally the second warmest year in the dataset’s record.
Data from a number of climate monitoring centres including the Met Office, NASA and NOAA are compiled by scientists at the Met Office for the World Meteorological Organization (WMO) to create its central annual global mean temperature estimate. The collection of datasets that make up the WMO figure all show that the previous 10 years were the warmest on record. In addition, they also all place 2020 in the top three years on record.
The ranking of second warmest in the HadCRUT5 dataset’s record is despite a transition into La Niña conditions in late 2020, which typically suppress global temperatures. Temperatures in the warmest year, 2016, were elevated by El Niño conditions which can increase global temperatures by around +0.2°C.
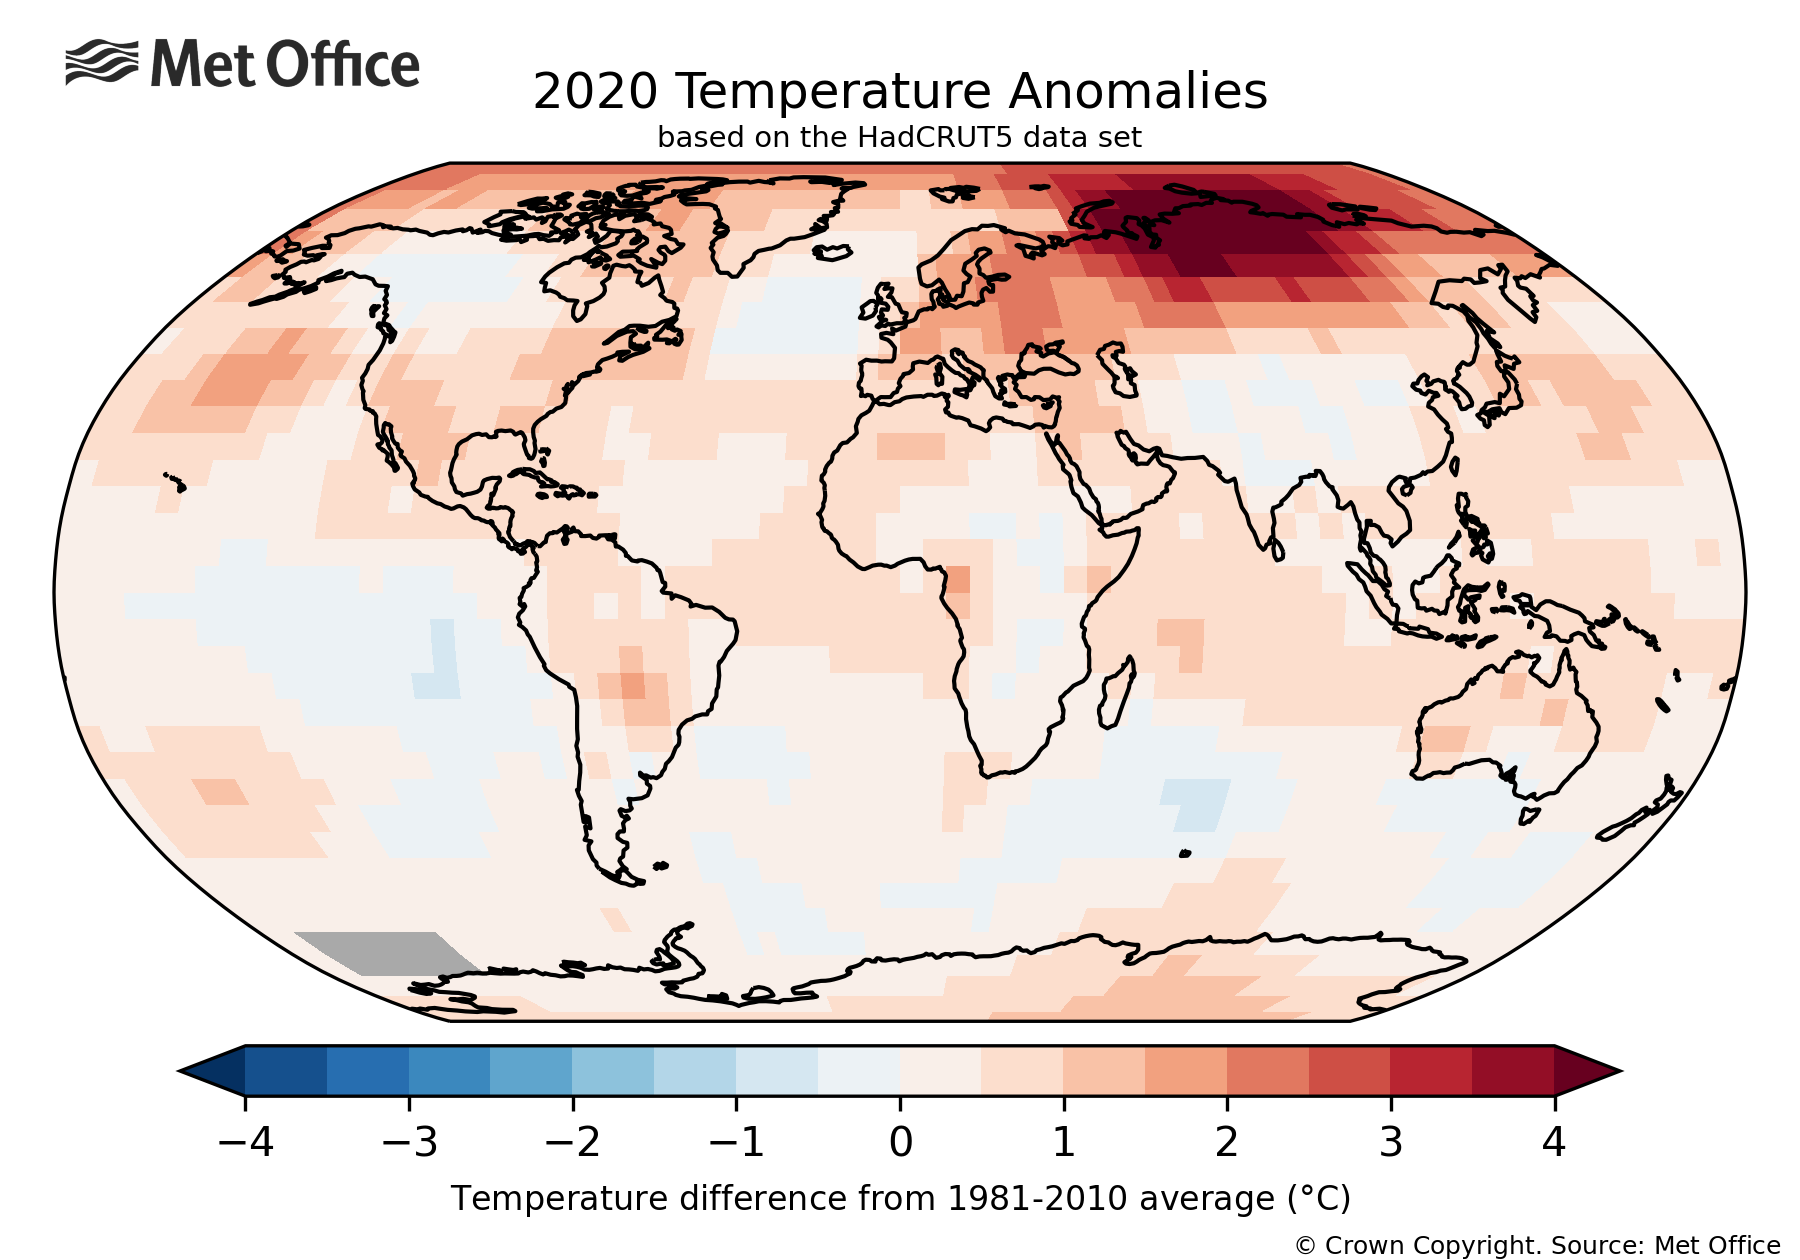
Notable regional warmth was observed in northern Asia extending into the Arctic, parts of eastern Europe and Central America.
 Dr Colin Morice, senior scientist in the Met Office’s climate monitoring team, said: “2020 has proved to be another notable year in the global climate record. For the global average temperature in 2020 to be yet another warm year, the second warmest on record even when influenced by a slight La Niña, is a sign of the continued impact of human induced climate change on our global climate. With all datasets showing a continued rise in global average temperature, the latest figures take the world one step closer to the limits stipulated by the Paris Agreement.”
Monitoring global mean temperature is important as it is the benchmark used to create and measure governmental policy commitments such as the Paris Agreement. The Paris Agreement commits to holding the increase in the global average temperature to well below 2 °C above pre-industrial levels and pursuing efforts to limit the temperature increase to 1.5 °C above pre-industrial levels. It is worth noting however that thresholds like the Paris Agreement’s goals are relevant to long-term averages, not to individual years. Exceeding these goals in individual years does not mean the Paris Agreement would be breached.
Tim Osborn, Director of UEA's Climatic Research Unit said: "For the last 50 years, our global climate has been warming at about 0.2°C each decade. This underlying warming, due primarily to society's use of coal, oil and gas, is what matters for monitoring climate change and tracking our progress against the goals of the Paris Agreement, more so than the warmth of an individual year. Nevertheless, it is notable that we have just experienced, globally, the second warmest year of the warmest decade on record."
2020 is the first year that the new HadCRUT5 data set has been used to assess global surface temperature change. Scientists at the Met Office Hadley Centre, the University of East Anglia's Climatic Research Unit and the UK National Centre for Atmospheric Science produce the new HadCRUT5 dataset.
The latest improvements to the HadCRUT dataset have included updated adjustments to handle sea-surface temperature measurements, a significant increase in the number of weather stations used over land and the use of statistical methods to extend the data set’s coverage in the early record and in areas that are still data-sparse today.
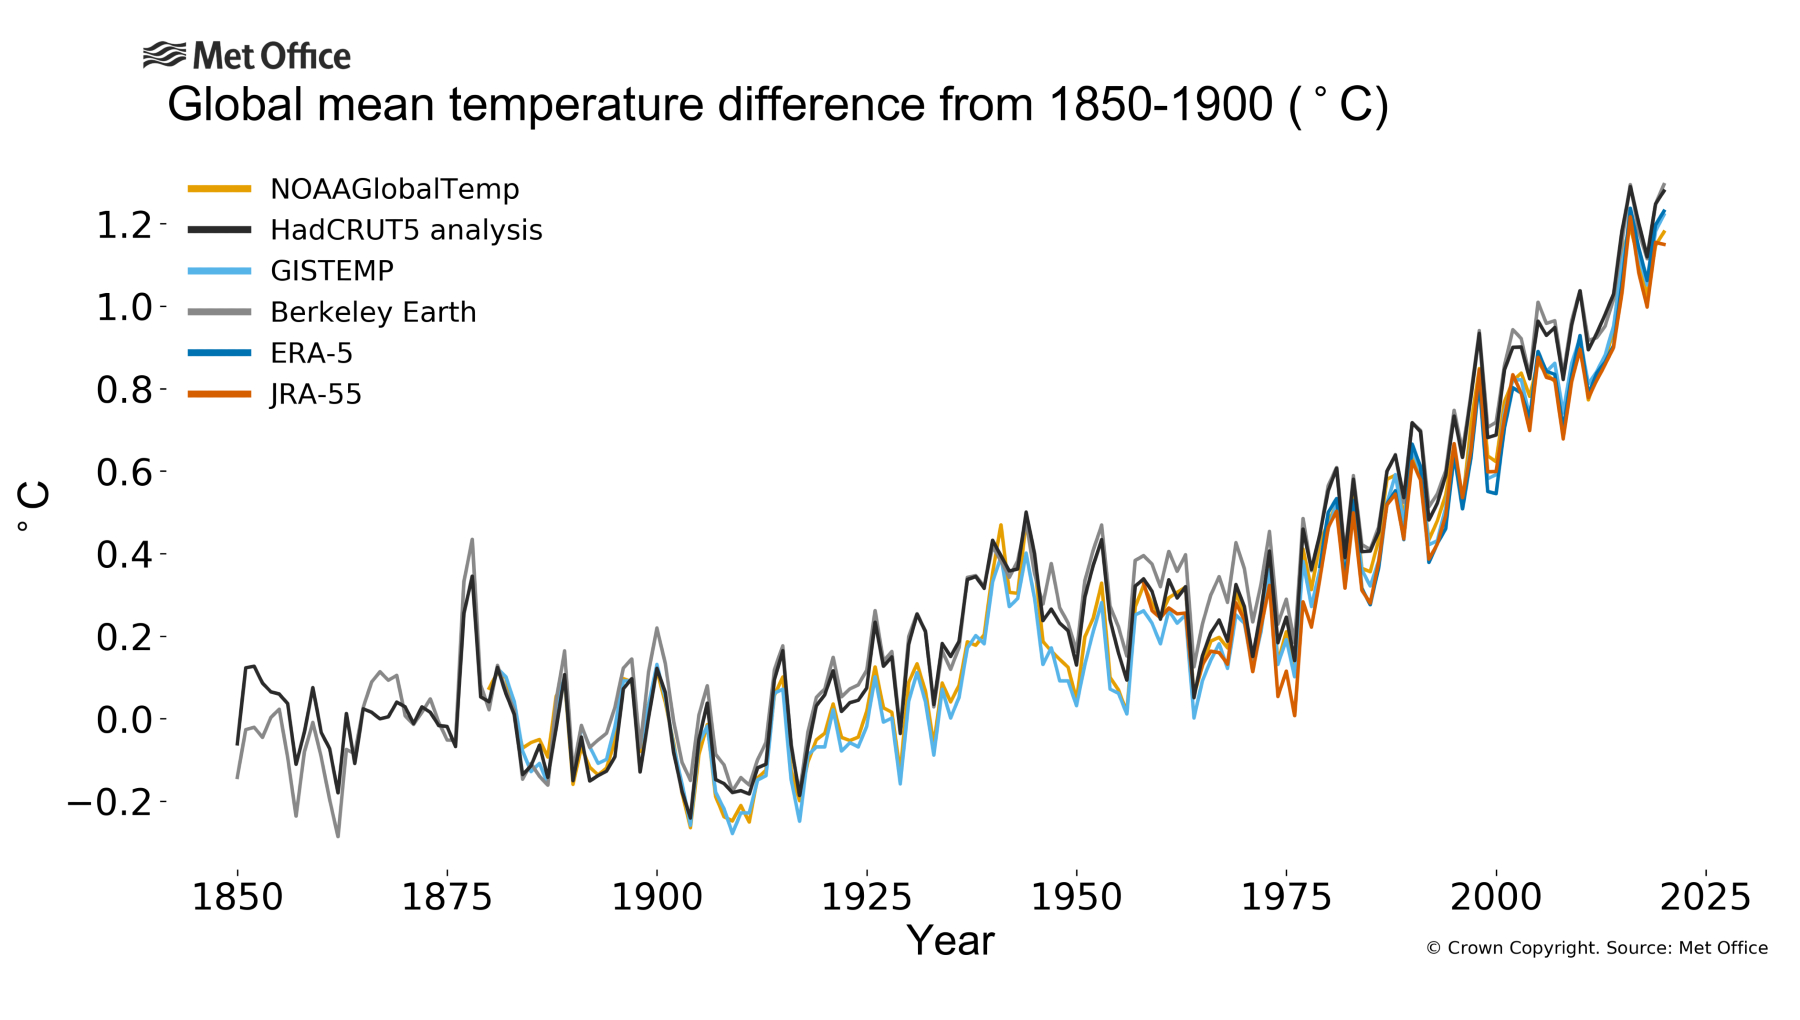
Multiple datasets are used from different organisations to establish the WMO central annual global mean temperature. Although all datasets show the same general warming evolution over the climatological record, there are some small differences between them. These differences are usually down to how the datasets represent data sparse areas such as the poles and how they deal with the fact that methods of recording temperature have changed over time. By using multiple datasets, it is possible to reduce some of the uncertainty in such complex global calculations. The important message is that the same general evolution of increasing global mean temperature is shown by all datasets: HadCRUT5; GISTEMP; NOAAGlobalTemp; ERA5; JRA-55; Berkeley Earth and Cowtan and Way.
| Year | HadCRUT5 (°C) |
|---|---|
| 2020 | 1.28 |
| 2019 | 1.25 |
| 2018 | 1.12 |
| 2017 | 1.20 |
| 2016 | 1.29 |
| 2015 | 1.18 |
| 2014 | 1.03 |
| 2013 | 0.98 |
| 2012 | 0.93 |
| 2011 | 0.89 |
| 2010 | 1.04 |
Table 1: Global average temperatures (°C) relative to the pre-industrial period 1850-1900 from HadCRUT5. The HadCRUT5 data and other centres’ data can be downloaded from the Met Office Climate Monitoring Dashboard.
The main contributor to warming over the last 170 years is human influence on climate from increasing greenhouse gases in the atmosphere. The effects of human-induced climate change are not limited to surface temperature. Warming of the climate system is seen across a range of climate indicators that build a holistic picture of climate change far beyond our expectations from natural variability across the land, atmosphere, oceans and ice.