

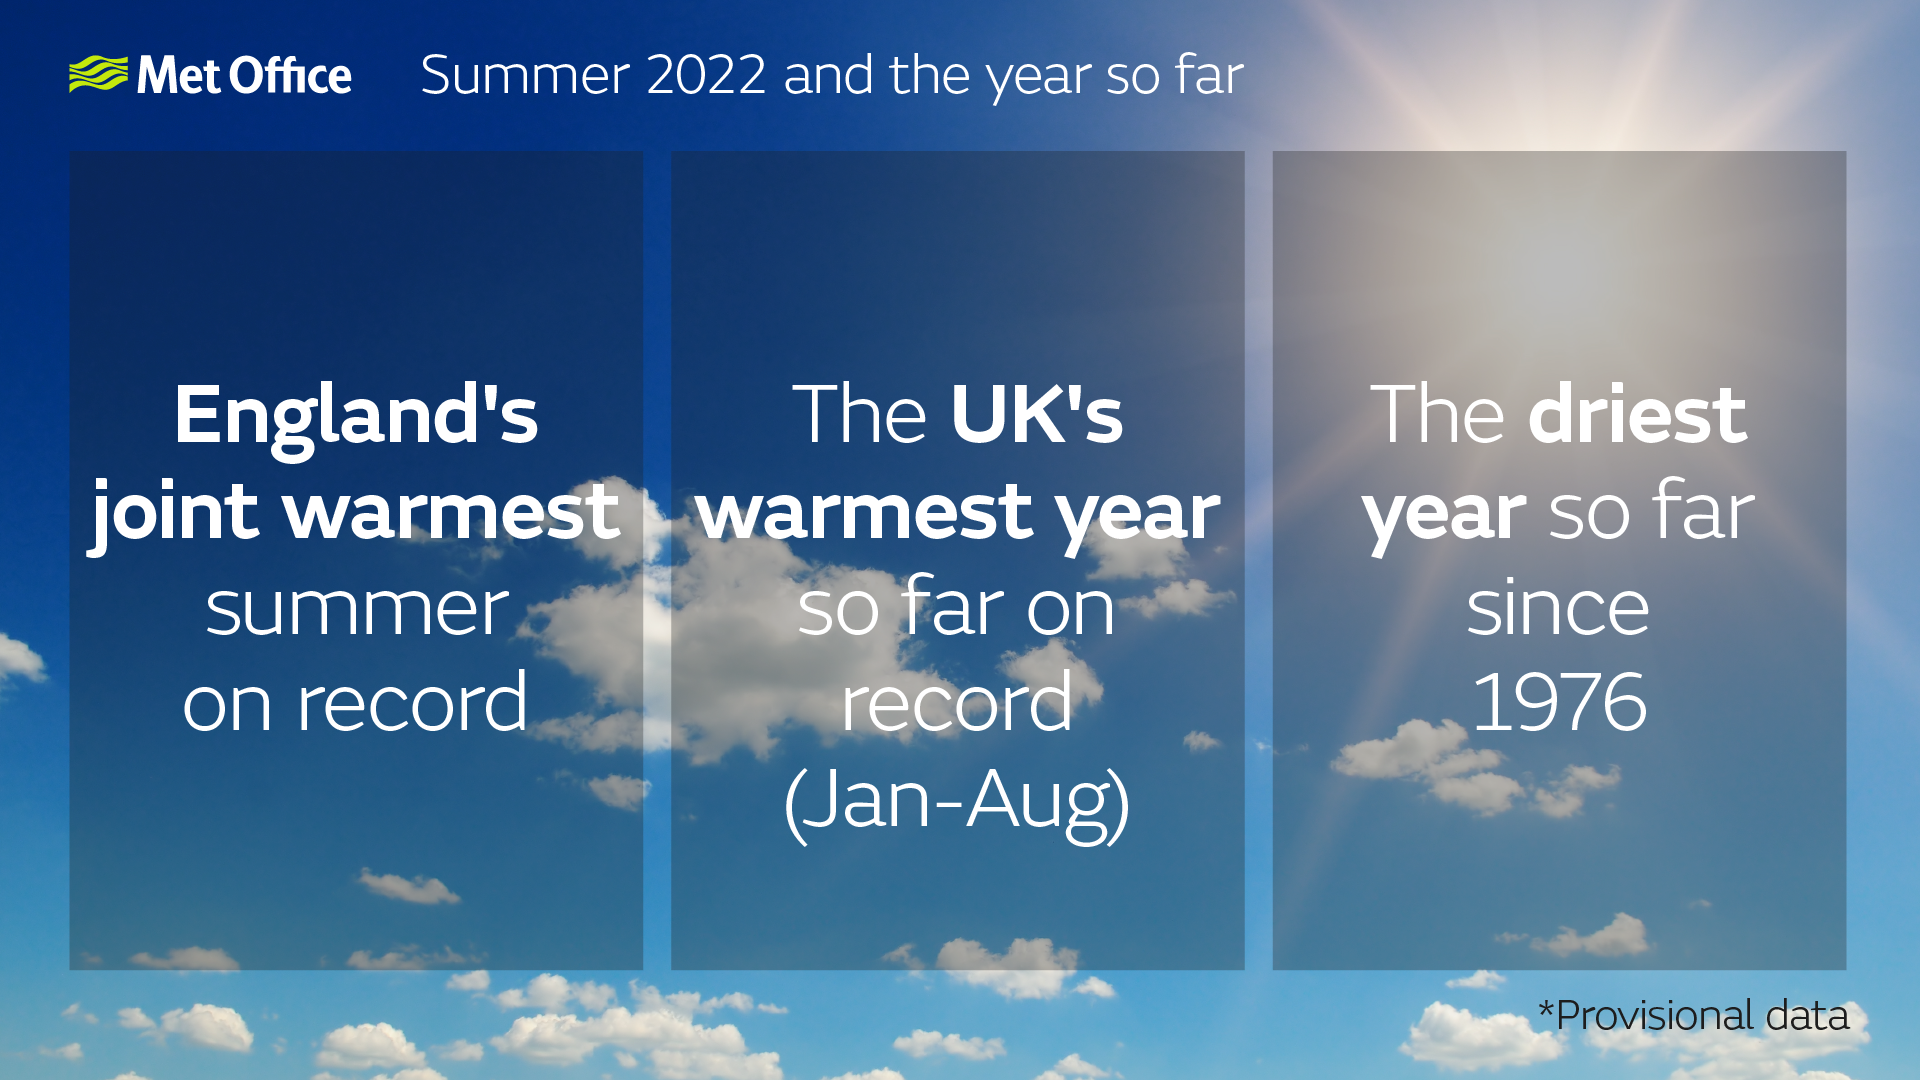
Joint hottest summer on record for England
Author: Press Office
15:43 (UTC+1) on Thu 1 Sep 2022
England had its joint hottest summer in a series which runs from 1884, according to provisional statistics from the Met Office.
Summer 2022
The summer of 2022 will be remembered as a dry and sunny three months, and for England, the joint warmest summer on record according to mean temperature*. This means that four of the five warmest summers on record for England have occurred since 2003, as the effects of human-induced climate change are felt on England’s summer temperatures.
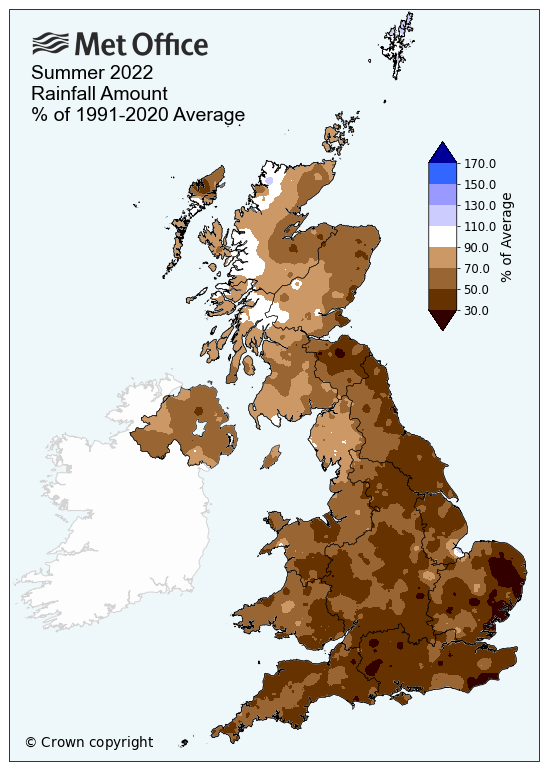
High pressure has dominated the UK weather this summer bringing long spells of dry and warm weather to many areas allowing heatwaves to develop each month, but most notably in July. Overall, the UK has seen 62% of its summer rainfall and mean temperatures were 1.1°C above the average of 14.6°C.
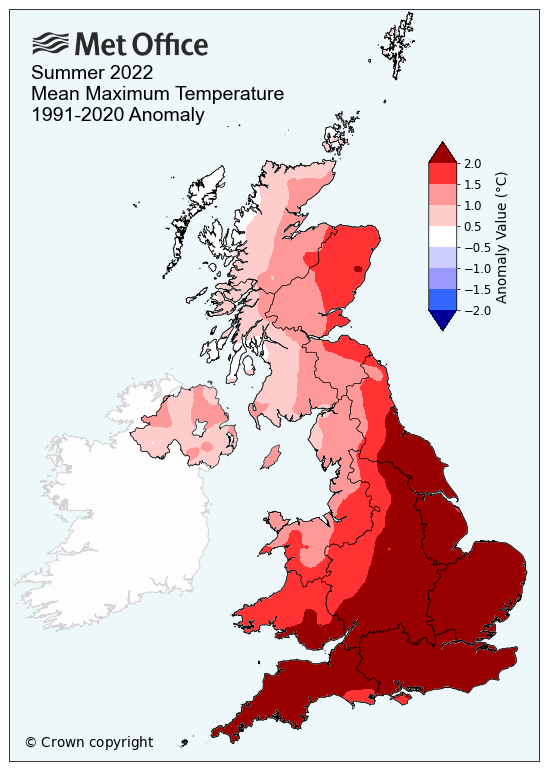
In England the warm and dry conditions have been more notable, with the mean temperature the joint warmest ever recorded (17.1°C) equalling that of summer 2018, and some areas have seen less than 50% of their typical summer rainfall. The warmest and driest areas relative to average were in the East and for East Anglia and parts of northeast England it was the hottest summer on record.
The hot weather was not confined to England. It was provisionally the fourth warmest summer for the UK overall. The UKs warmest summers are all very close with not much separating them. 2018 (15.8°C), 2006 (15.8°C), 2003 (15.7°C), 2022 (15.7°C), 1976 (15.7°C). It was the eighth warmest summer for both Scotland and Wales and 12th warmest for Northern Ireland
For England 2022 was the 6th driest summer on record (103mm), and driest since 1995 (66mm), in a series from 1836. For the UK overall it was the 10th driest summer (156mm) and driest since 1995 (106mm). Some of the driest regions relative to average were in East Anglia. Suffolk had its 2nd driest summer behind 1921, and Norfolk its 3rd driest (behind 1921 and 1983).
Dr Mark McCarthy of the National Climate Information Centre said: “For many this summer’s record-breaking heat in July – where temperatures reached 40.3°C at Coningsby in Lincolnshire - will be the season’s most memorable aspect. However, for England to achieve its joint warmest summer takes more than extreme heat over a couple of days, so we shouldn’t forget that we experienced some persistently warm and hot spells through June and August too.”
Provisional Summer 2022 statistics
| Maximum temp | Minimum temp | Mean temp | Rainfall | Sunshine | ||||||
|---|---|---|---|---|---|---|---|---|---|---|
| Area | Actual temp (°C) | Anomaly (°c) | Actual temp (°C) | Anomaly (°C) | Actual temp (°C) | Anomaly (°C) | Actual (mm) | Anomaly (%) | Actual (hours) | Anomaly (%) |
| UK | 20.6 | 1.7 | 10.9 | 0.5 | 15.7 | 1.1 | 156.1 | 62 | 582.4 | 115 |
| England | 22.5 | 2.2 | 11.7 | 0.6 | 17.1 | 1.4 | 102.9 | 50 | 676.5 | 120 |
| Wales | 20.4 | 1.7 | 10.9 | 0.3 | 15.6 | 1 | 163.9 | 54 | 597 | 116 |
| Scotland | 17.7 | 1 | 9.6 | 0.5 | 13.6 | 0.8 | 239.4 | 76 | 453.7 | 108 |
|
N. Ireland |
19 | 0.9 | 10.7 | 0.6 | 14.9 | 0.8 | 174.9 | 65 | 392.4 | 93 |
Year so far
2022 started as it meant to go on with the warmest New Year’s day on record, and since then every month has been warmer than average through 2022 bringing the UK, the warmest first eight months of the year in a series that goes back to 1884.
Dr Mark McCarthy explained: “The average temperature for January to August for the UK in 2022 has been 10.51°C, making this year so far warmer than the previous record of 10.2°C in 2014. It is too early to speculate on how the year overall will finish, but the persistent warm conditions are certainly notable and have certainly been made more likely by climate change”
Driest year so far since 1976
Following southern England’s driest July on record, August has supplied some respite from the aridity, with rain and thunderstorms mid-month. However, this hasn’t been enough to bring us closer to our usual levels by this point in the year.
Mark continued: “Through August, the UK received 54% of the average rainfall (51mm), adding to the list of dry months in 2022. So far in 2022, 538mm of rain has fallen on average in the UK and 348mm in England, meaning it has been the driest year so far for both the UK and England since 1976, ranking 15th and 5th driest respectively in a series that goes back to 1836.”
Sunnier than usual
The UK has broadly seen a sunnier than average summer, although parts of Northern Ireland and northern Scotland have been duller than average.
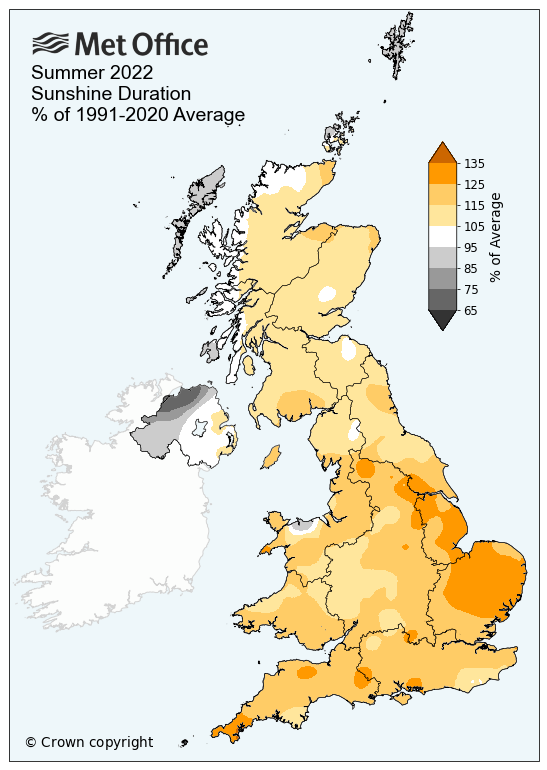
Through the summer the UK has received 115% (582 hrs) of the average summer sunshine hours, England 120%, Wales 116%, Scotland 108% and Northern Ireland 93%. Sunshine hours were the greatest across southern and eastern areas of the UK and a number of counties, Suffolk, Nottinghamshire, Norfolk, Lincolnshire and Essex saw 2022 rank in the top three sunniest summers.
In Northern Ireland, August brought 189 hours of sunshine, more than July (96 hours) or June (108 hours), ranking as the 5th sunniest August on record for Northern Ireland. However, the start to the summer means that for some areas it has been a dull summer, as the country of London Derry recorded their 5th dullest summer on record.
August
Like much of the year and summer August was a dry and warm month, ranking as the UK’s 5th warmest August with a mean temperature of 16.7°C. Rainfall was 54% of the August average for the UK overall, Wales saw the least of their monthly average, with 40.4mm (36%) falling. But the lowest amount of rainfall was in southern England where 31.1mm (46%) fell through the course of the month.
Provisional August 2022 statistics
| Maximum temp | Minimum temp | Mean temp | Rainfall | Sunshine | ||||||
|---|---|---|---|---|---|---|---|---|---|---|
| Area | Actual temp (°C) | Anomaly (°c) | Actual temp (°C) | Anomaly (°C) | Actual temp (°C) | Anomaly (°C) | Actual (mm) | Anomaly (%) | Actual (hours) | Anomaly (%) |
| UK | 21.7 | 2.4 | 11.6 | 0.7 | 16.7 | 1.5 | 50.8 | 54 | 207.2 | 128 |
| England | 24.0 | 3.1 | 12.8 | 1.0 | 18.3 | 2.0 | 34.8 | 47 | 238.3 | 132 |
| Wales | 22.0 | 3.0 | 11.8 | 0.5 | 16.9 | 1.8 | 40.4 | 36 | 222.3 | 139 |
| Scotland | 18.2 | 1.2 | 9.8 | 0.2 | 14.0 | 0.7 | 81.1 | 68 | 154.3 | 115 |
|
N. Ireland |
20.3 | 2.0 | 10.8 | 0.1 | 15.6 | 1.1 | 44.5 | 45 | 188.6 | 139 |
*At this stage the national statistics are provisional based on the observations we have available now. There is an ongoing data collection and quality control process so the numbers may be revised due to the slower time stations reporting and more comprehensive checks on the data. Usually the changes are small, but in this case a difference between 2018 and 2022 is not a statistically robust difference to be able to declare 2022 as an outright record holder.