
Mixed conditions bring warm and wet summer for the UK
Author: Press Office
13:26 (UTC+1) on Fri 1 Sep 2023
Record-breaking June temperatures means that the UK has had one of its ten warmest summers on record, despite an unsettled July and August, according to provisional Met Office figures.
Meteorological summer 2023 was the eighth warmest on record by mean temperature, thanks largely to June’s record breaking temperatures, in a series which dates back to 1884.
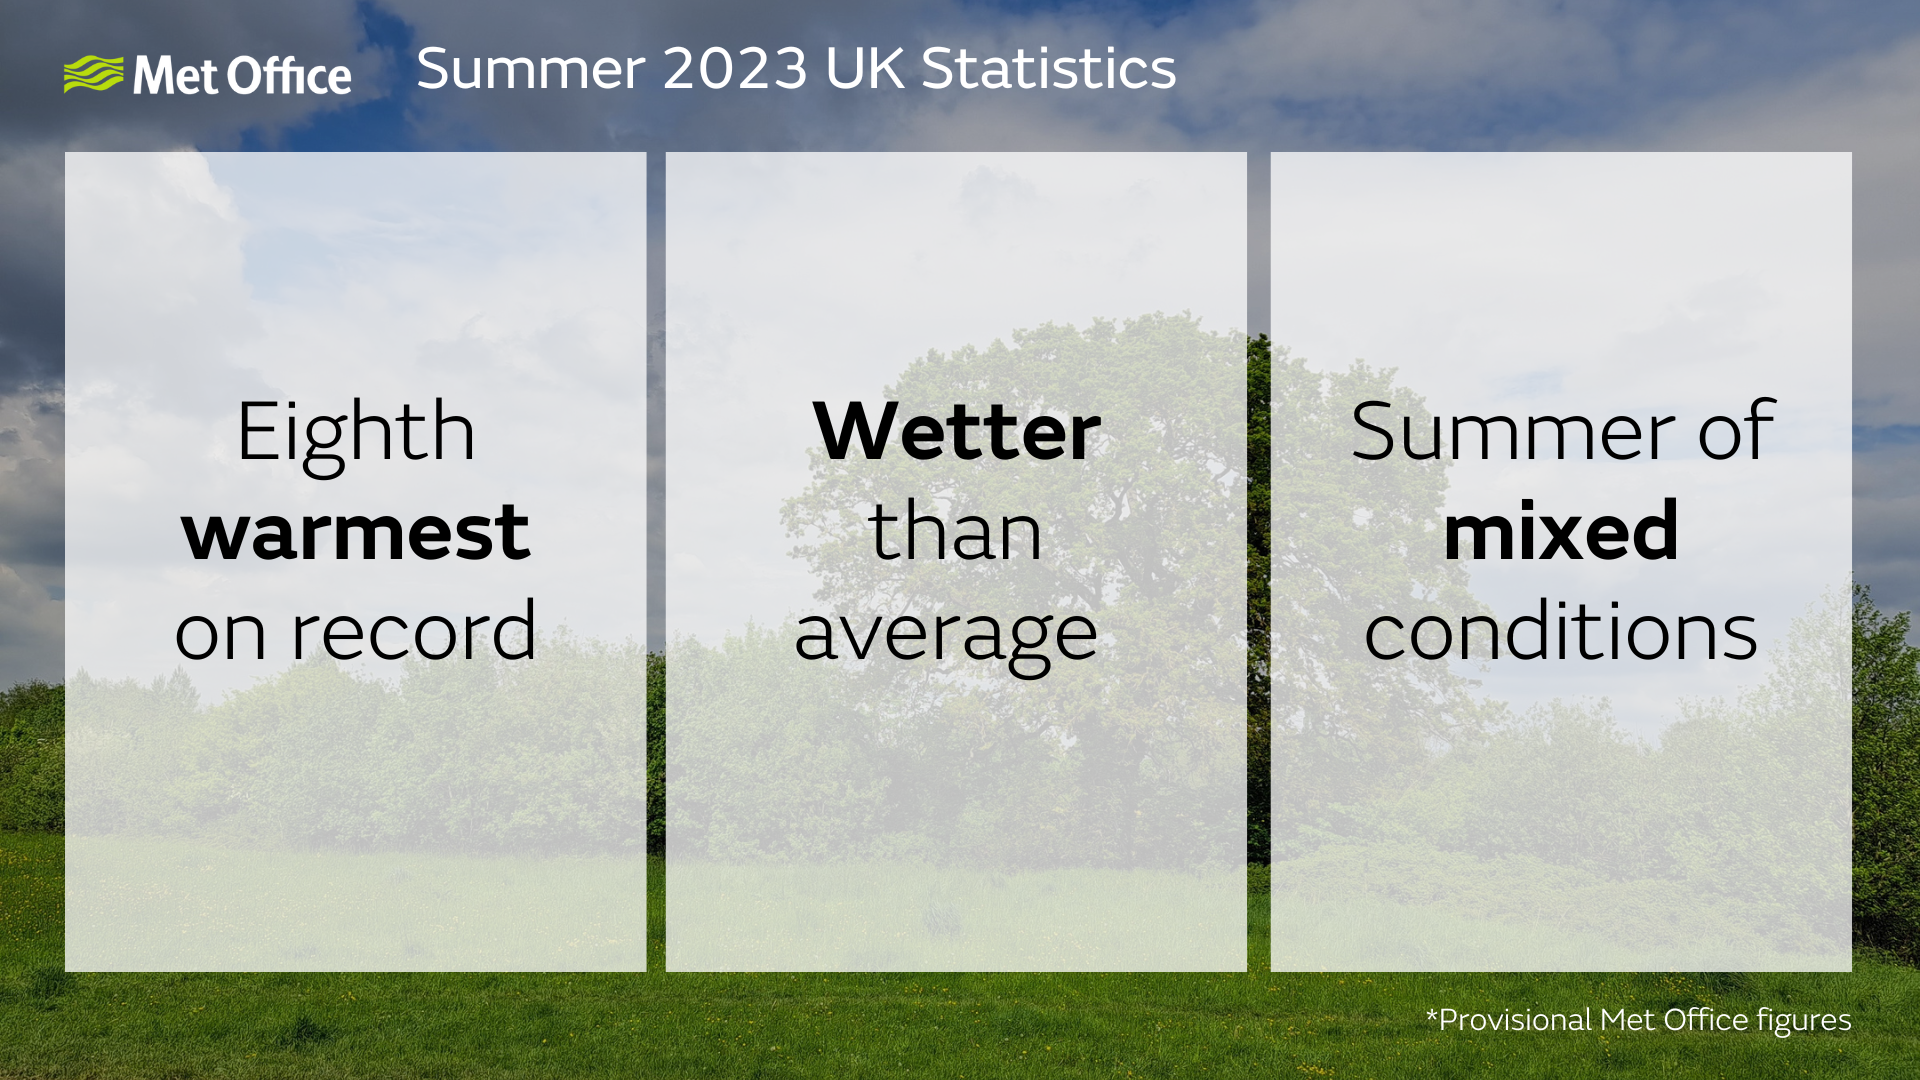
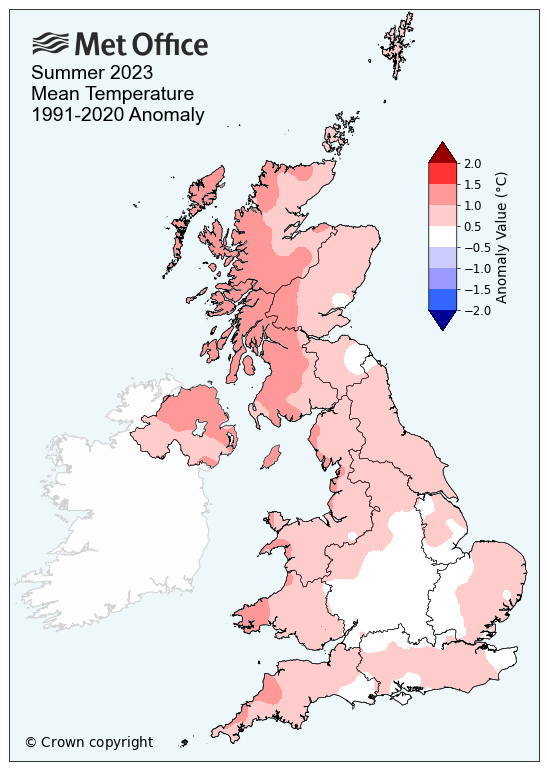
The average mean temperature for the UK during the season was 15.4°C, around 0.8°C warmer than average, though July and August’s respective average temperatures were generally closer to average.
However, despite above average temperatures for the season, it has also been a wetter than average summer, with July leading the way in terms of rainfall; which was provisionally the UK’s sixth wettest July on record. Interestingly, of the ten warmest summers on record by mean temperature, summer 2023 is the wettest.
Met Office Senior Scientist Mike Kendon said: “The lion’s share of fine and settled weather in summer 2023 for the UK occurred in June, when high pressure was widely established bringing many dry days of warm summer sunshine. After that, however, the jet stream shifted much further to the south, with low-pressure systems often bringing rather wet and windy conditions to the UK through much of July and August.
“The characteristic variability of the UK’s climate has once again been illustrated by this summer: the season’s temperature figures are influenced by how significantly hot June was, but the result is that summer 2023 will go down as a warm and wet one for the UK, with plenty of rainfall in the second half of the season.”
Mixed summer of temperatures
In a series which goes back to 1884, this is just the seventh time that June has been the warmest or equal-warmest summer month for the UK, with July and August more typically getting the higher temperatures.
High overnight temperatures have also influenced the temperature statistics, with both Wales and Northern Ireland having their highest average minimum temperatures for summer on record. By the same overnight measurement, Scotland had its fifth highest average minimum temperature on record, and England its seventh.
For the UK, average minimum temperatures for the season sit at 11°C, which is the fourth highest on record.
The highest individual temperature recorded this summer was a relatively modest 32.2°C at Chertsey, Surrey on 10 June and Coningsby, Lincolnshire on 25 June, falling a long way short of last year’s unprecedented 40.3°C at Coningsby but the same as 2021’s highest temperature of the year.
Wet season
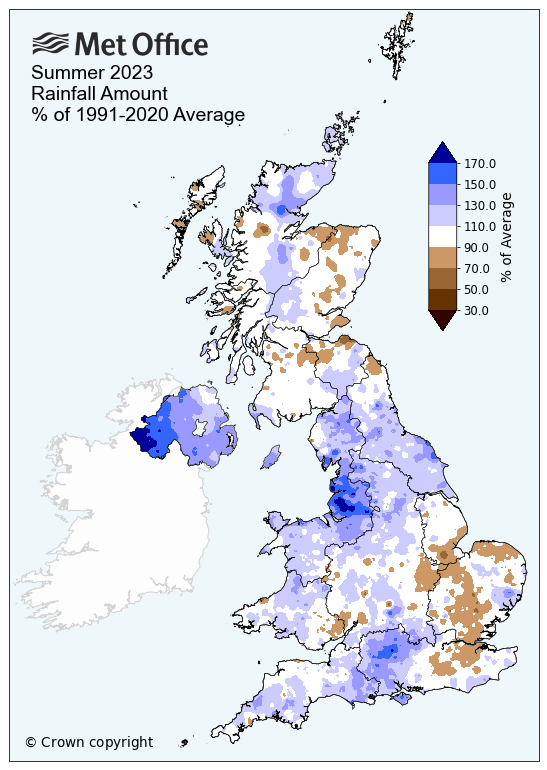
Summer was 11% wetter than average for the UK, with Northern Ireland and northern England more markedly wet, though not enough to trouble any seasonal records.
A relatively dry June was followed by a significantly wet July, and the wettest on record for Northern Ireland. Parts of south-west and northern England and Northern Ireland recorded more than twice the normal monthly rainfall. Totals were closer to average through August overall but two named storms, Antoni on 5th and Betty on 18th and 19th brought wet and windy weather and contributed to the generally mixed feel of the summer.
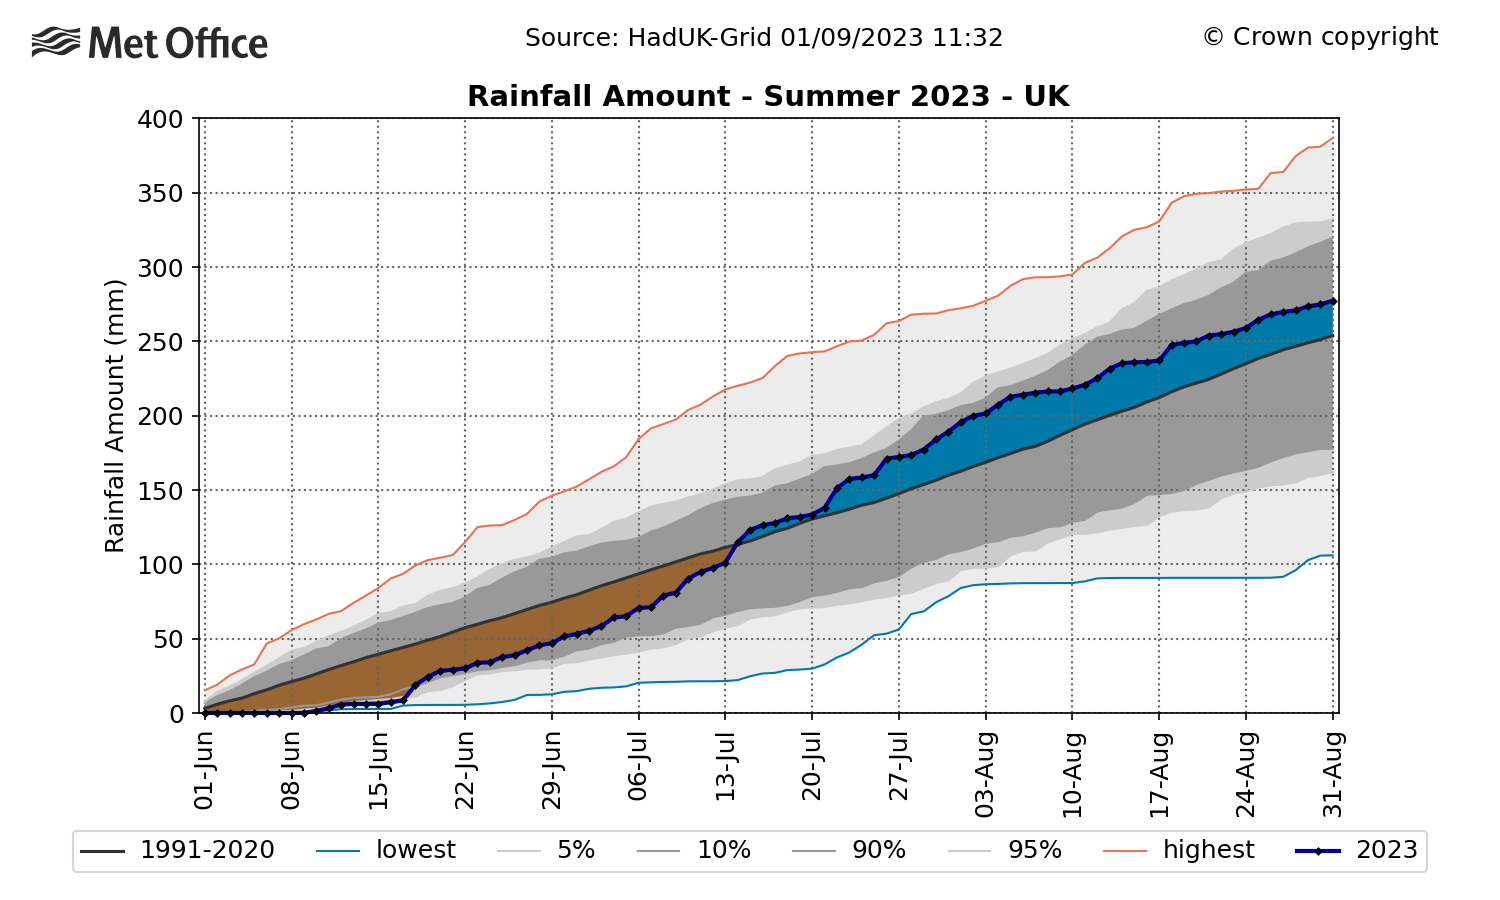
The graph shows rainfall amount over time for summer 2023 compared to average. A dry June was replaced with a largely wet July and August, resulting in a wetter than average season.
Sunshine for some
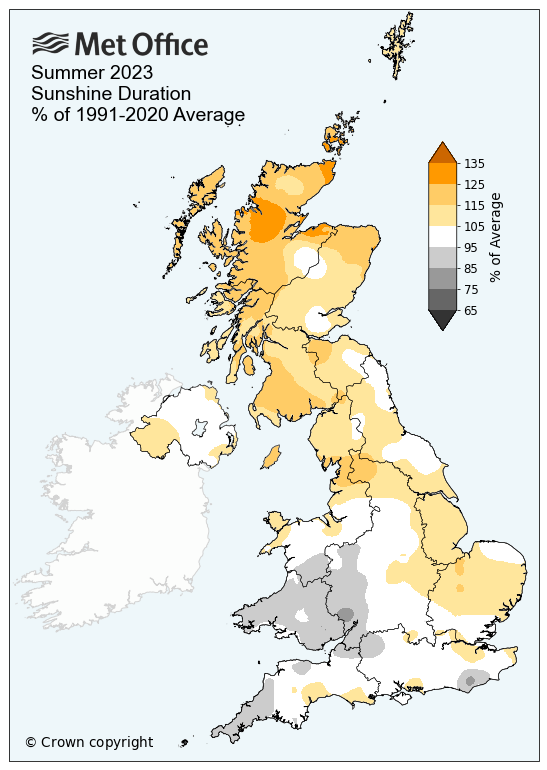
Sunshine hours will end the season relatively close to average, though areas to the north generally saw more clear skies than those further south.
The UK saw 6% more sunshine than average in the season, once again thanks largely to high pressure and clear skies through much of June. Scotland led the way compared to average with 486 hours of sunshine being 15% more than its average.
Provisional Summer 2023 statistics
| Maximum temp | Minimum temp | Mean temp | Rainfall | Sunshine | ||||||
|---|---|---|---|---|---|---|---|---|---|---|
| Area | Actual temp (°C) | Anomaly (°c) | Actual temp (°C) | Anomaly (°C) | Actual temp (°C) | Anomaly (°C) | Actual (mm) | Anomaly (%) | Actual (hours) | Anomaly (%) |
| UK | 19.7 | 0.9 | 11.0 | 0.7 | 15.4 | 0.8 | 281.4 | 111 | 535.9 | 106 |
| England | 21.0 | 0.6 | 11.7 | 0.6 | 16.3 | 0.6 | 233.2 | 113 | 582.0 | 103 |
| Wales | 19.4 | 0.7 | 11.6 | 0.9 | 15.4 | 0.8 | 343.1 | 113 | 492.0 | 96 |
| Scotland | 17.9 | 1.3 | 9.8 | 0.7 | 13.8 | 1.0 | 327.1 | 103 | 486.5 | 115 |
|
N. Ireland |
19.2 | 1.1 | 11.0 | 0.9 | 15.1 | 1.0 | 383.9 | 142 | 439.3 | 104 |
Slightly warmer August
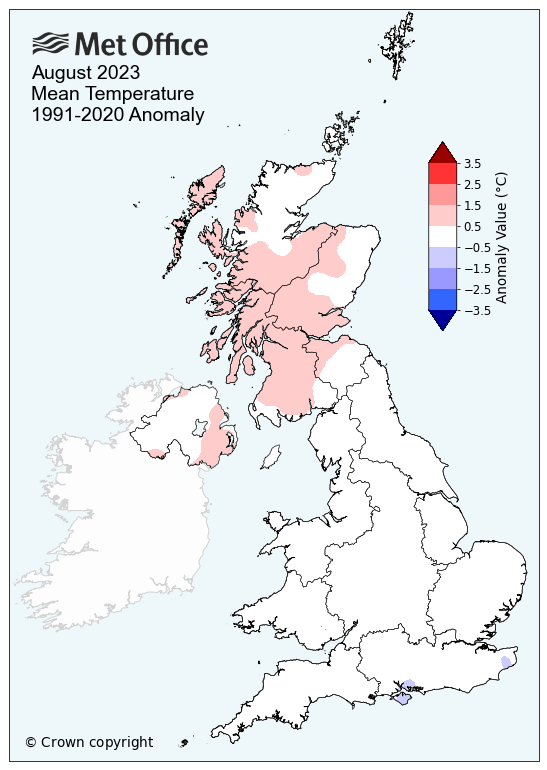
August mean temperatures were 0.2°C warmer than the long-term average for the UK. Scotland had the warmest month compared to its average, with a mean temperature of 13.8°C being 0.6°C above average. Northern Ireland was 0.5°C warmer than average, with 14.9°C the mean temperature for the month, while England and Wales were close to average.
Unsettled for some
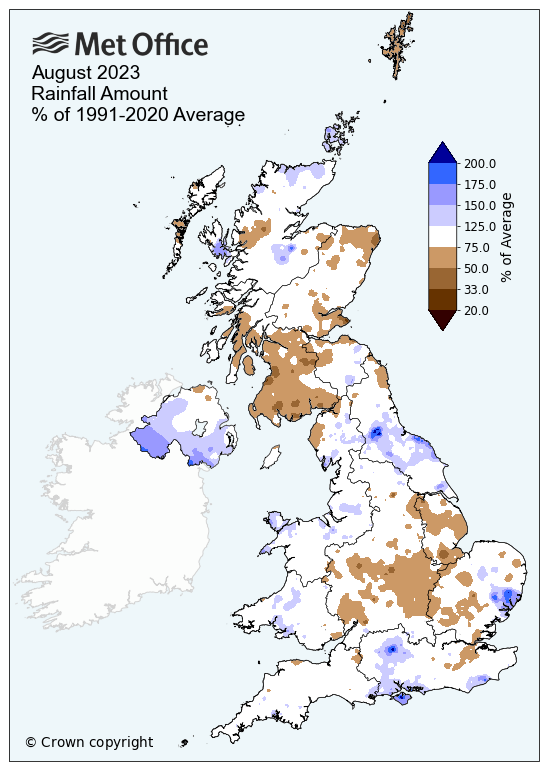
With the contrasts in rainfall from June and July, August will be closer to average; the month saw 95% of the average, totalling 89mm in the UK.
Northern Ireland had a much wetter than average month, with 126.5mm of rain (27% more than average), though not enough to trouble any records.
Dull August for many
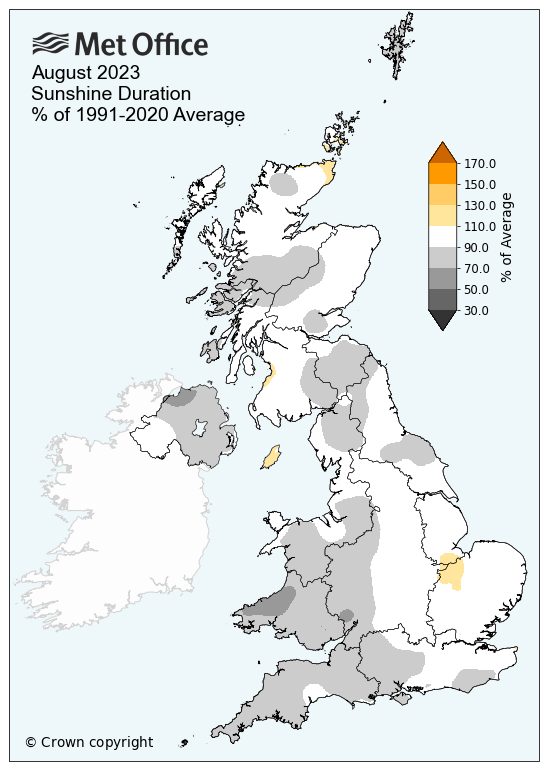
The UK had 8% fewer sunshine hours than average, with Wales particularly dull with 21% fewer sunshine hours than its average.
Provisional August 2023 statistics
| Maximum temp | Minimum temp | Mean temp | Rainfall | Sunshine | ||||||
|---|---|---|---|---|---|---|---|---|---|---|
| Area | Actual temp (°C) | Anomaly (°c) | Actual temp (°C) | Anomaly (°C) | Actual temp (°C) | Anomaly (°C) | Actual (mm) | Anomaly (%) | Actual (hours) | Anomaly (%) |
| UK | 19.3 | 0.0 | 11.4 | 0.4 | 15.3 | 0.2 | 89.0 | 95 | 148.1 | 92 |
| England | 20.5 | -0.3 | 12.0 | 0.2 | 16.2 | -0.1 | 72.1 | 97 | 167.3 | 93 |
| Wales | 18.6 | -0.4 | 11.8 | 0.6 | 15.2 | 0.1 | 119.7 | 107 | 126.0 | 79 |
| Scotland | 17.4 | 0.5 | 10.3 | 0.7 | 13.8 | 0.6 | 102.7 | 86 | 127.1 | 94 |
|
N. Ireland |
18.6 | 0.3 | 11.2 | 0.5 | 14.9 | 0.5 | 126.5 | 127 | 115.7 | 85 |