Ever wondered how we know if a summer was really the hottest on record? Or how we know if rainfall patterns are changing across the UK? The answer lies in a Met Office dataset that's been quietly mapping our weather history for around the last two centuries.
As we head towards the end of the spring season, we take a look at where the monthly stats come from, how it works, and how it differs from other datasets.
What is HadUK-Grid?
The Met Office's HadUK-Grid dataset takes weather observations from across the country and processes them into a detailed grid at a resolution of 1km x 1km, covering every part of the UK.
Some of these records stretch all the way back to 1836, meaning almost 200 years of weather data. From rainfall to monthly temperatures, this data allows our scientists to track climate patterns with confidence, helping us to understand how the UK’s climate is changing over time. The length of these records is particularly important because it provides the long-term context that is needed to determine trends beyond natural year-to-year variability.
What makes this data set so impressive is how comprehensive it is. Alongside spot observations from our weather stations across the UK, HadUK-Grid creates a scientifically robust and complete picture of the UK's climate, giving an indication of what conditions were like everywhere. Gridded data of this type alleviates the impact of the routine opening and closing of individual weather stations and enables a robust record of the UK’s climate, which is self-consistent through space and time.
What data does it track?
The HadUK Grid dataset tracks a variety of weather measurements from the UK’s land network of weather stations for differing periods of time, including:
-
Temperatures (maximum, minimum and average)
-
Rainfall
-
Sunshine hours
-
Wind speed
-
Days of snow
-
Days of ground frost and more
The grids and associated statistics, such as our UK and national climate series which are derived from them, are produced for daily, monthly, seasonal and annual timescales, as well as long-term averages.
When you say ‘compared to average’ what does it mean?
A 30-year period is an internationally accepted standard for calculating climate averages because it provides sufficient data to smooth out natural year-to-year variations while also helping to identify any long-term trends. HadUK-Grid data are provided for a number of 30-year climatological averaging periods, most notably 1961-1990, and 1991-2020.
We are currently using the 1991-2020 period so when we say ‘compared to average’, this means we are comparing the given value to the ‘average’ value over that time. For example, the 1991-2020 long-term meteorological average UK mean temperature for the whole of spring is 8.1°C. This compares to 7.1°C for the period 1961-1990.
When comparing the differing averages between 1991-2020 and 1961-1990, you can get a better sense of long-term changes that may be occurring due to climate change, because much of the shorter-term variability is averaged out. Even so, our climate is changing at sufficient speed that even this comparatively recent period, 1991-2020, can be considered out of date.
How is the data used?
At the end of each month, we look at the HadUK-Grid data and let you know the rainfall, temperature and sunshine stats for the UK. For some months, there isn’t much to say about the data if the period is close to average – and indeed the average represents what is most likely to happen. However, occasionally months may be exceptional, for example if weather patterns are particularly unusual or static for a long period of time, and therefore these may break long-term climate records. When analysed against historical data over multiple months and years, clear climate trends can emerge. This is true of temperatures both high and low, and rainfall both sparse and plentiful.
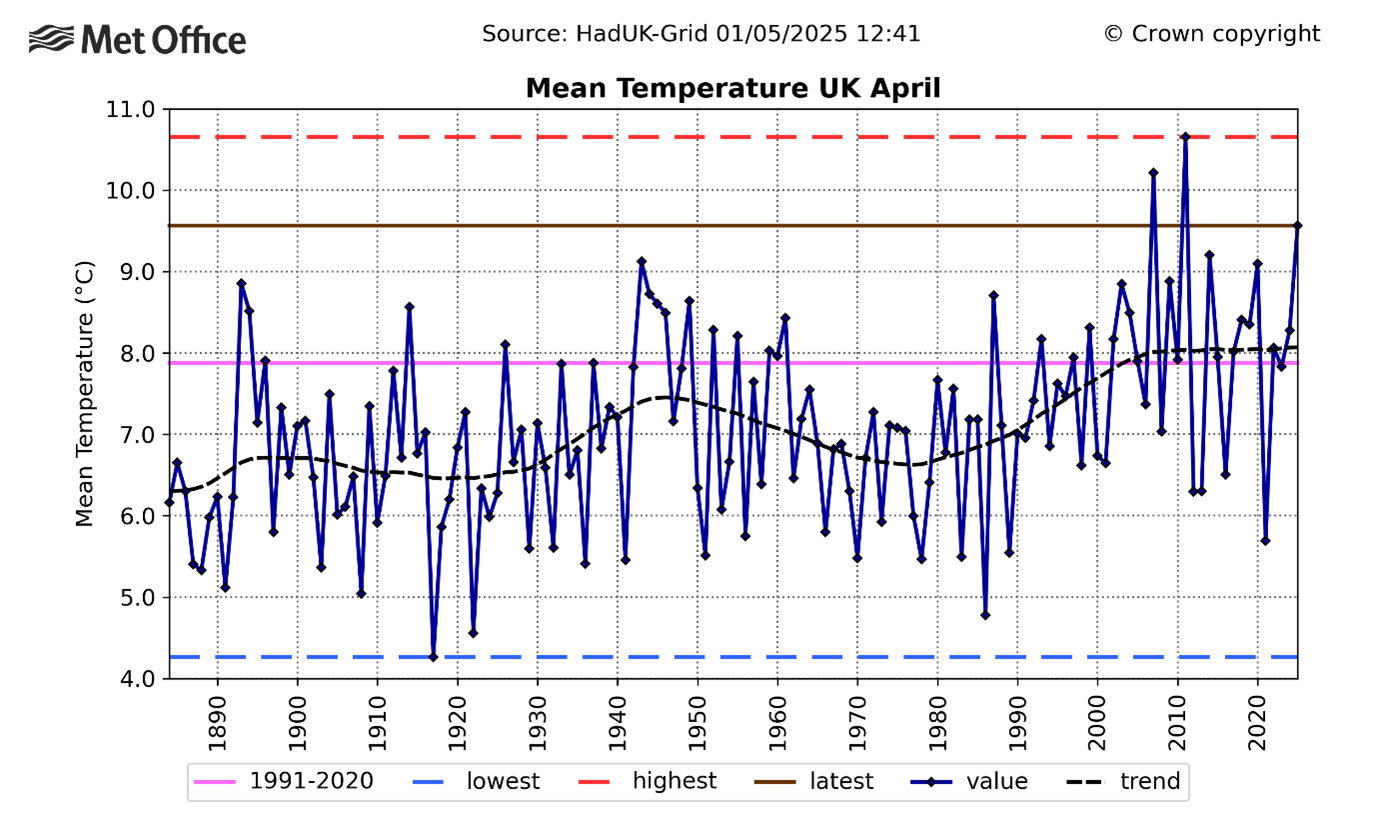
For example, the graph above shows the UK’s April mean temperature from 1884 to 2025. It shows the year-to-year variability of April temperatures.
Our data underpins critical climate monitoring and research, with scientists and government departments using it to monitor our changing climate and plan for the future. It helps answer important questions about how weather patterns are shifting, and what impacts we might expect in years to come.
The annual State of the UK Climate report, published each July, is based on HadUK-Grid data. It provides a comprehensive overview of our current climate, showing how our climate has already changed in the UK based on these long-term observations. These observations, from the UK’s land network of weather stations, represent ‘ground truth’.
How robust is the data?
Scientists at the Met Office update the HadUK-Grid dataset each year, not only adding the latest information but also quality checking the data and reviewing and adding historical records as they become available. These have previously included large volumes of historical data added as a result of work by public volunteers through project such as the Rainfall Rescue project run by Professor Ed Hawkins at the University of Reading. This ensures the dataset continuously improves, making the most of any newly available data, while maintaining its scientific integrity.
The station observations used to produce the grids have undergone a quality control process which corrects or removes erroneous data. These include both automatic and manual checks using a suite of tools managed by a team responsible for our historic station data archive. The observations and quality control processes we use comply with World Meteorological Organization (WMO) standards. Gridded datasets are used extensively by the science community both in the UK and internationally, and the gridding methodology undergoes independent external peer review following the normal scientific process.
So, next time you hear about a record-breaking month or wonder how today's climate compares to the past, remember our HadUK-Grid is quietly mapping our changing weather, one data point at a time.
Find out much more about HadUK-Grid here.