
Global impacts of climate change - observed trends
These maps show the observed regional trends in 6 types of climate extremes and impacts, with examples of impactful extreme weather events attributable partly or wholly to anthropogenic climate change.
Regions around the world are experiencing multiple increasing climate extremes and impacts. The maps show regions where recent decades have seen increases in extreme heat, heavy rainfall, agricultural drought, and the length of the fire weather season, as well as changes in river flows, and glacier mass. Regions with decreasing extremes are also shown. Confidence in attribution of trends to human-caused climate change varies between impacts and regions, and information is not available for all impacts. There are numerous other impacts related to human-induced climate change, such as coastal flooding and risks to biodiversity leading to widespread decline in ecosystems, that are also of concern but not shown here.
Projections of future climate impacts are also important for effective adaptation. For more information please see our page on climate impact projections.
Contents
Multiple changes in weather extremes and climate impacts
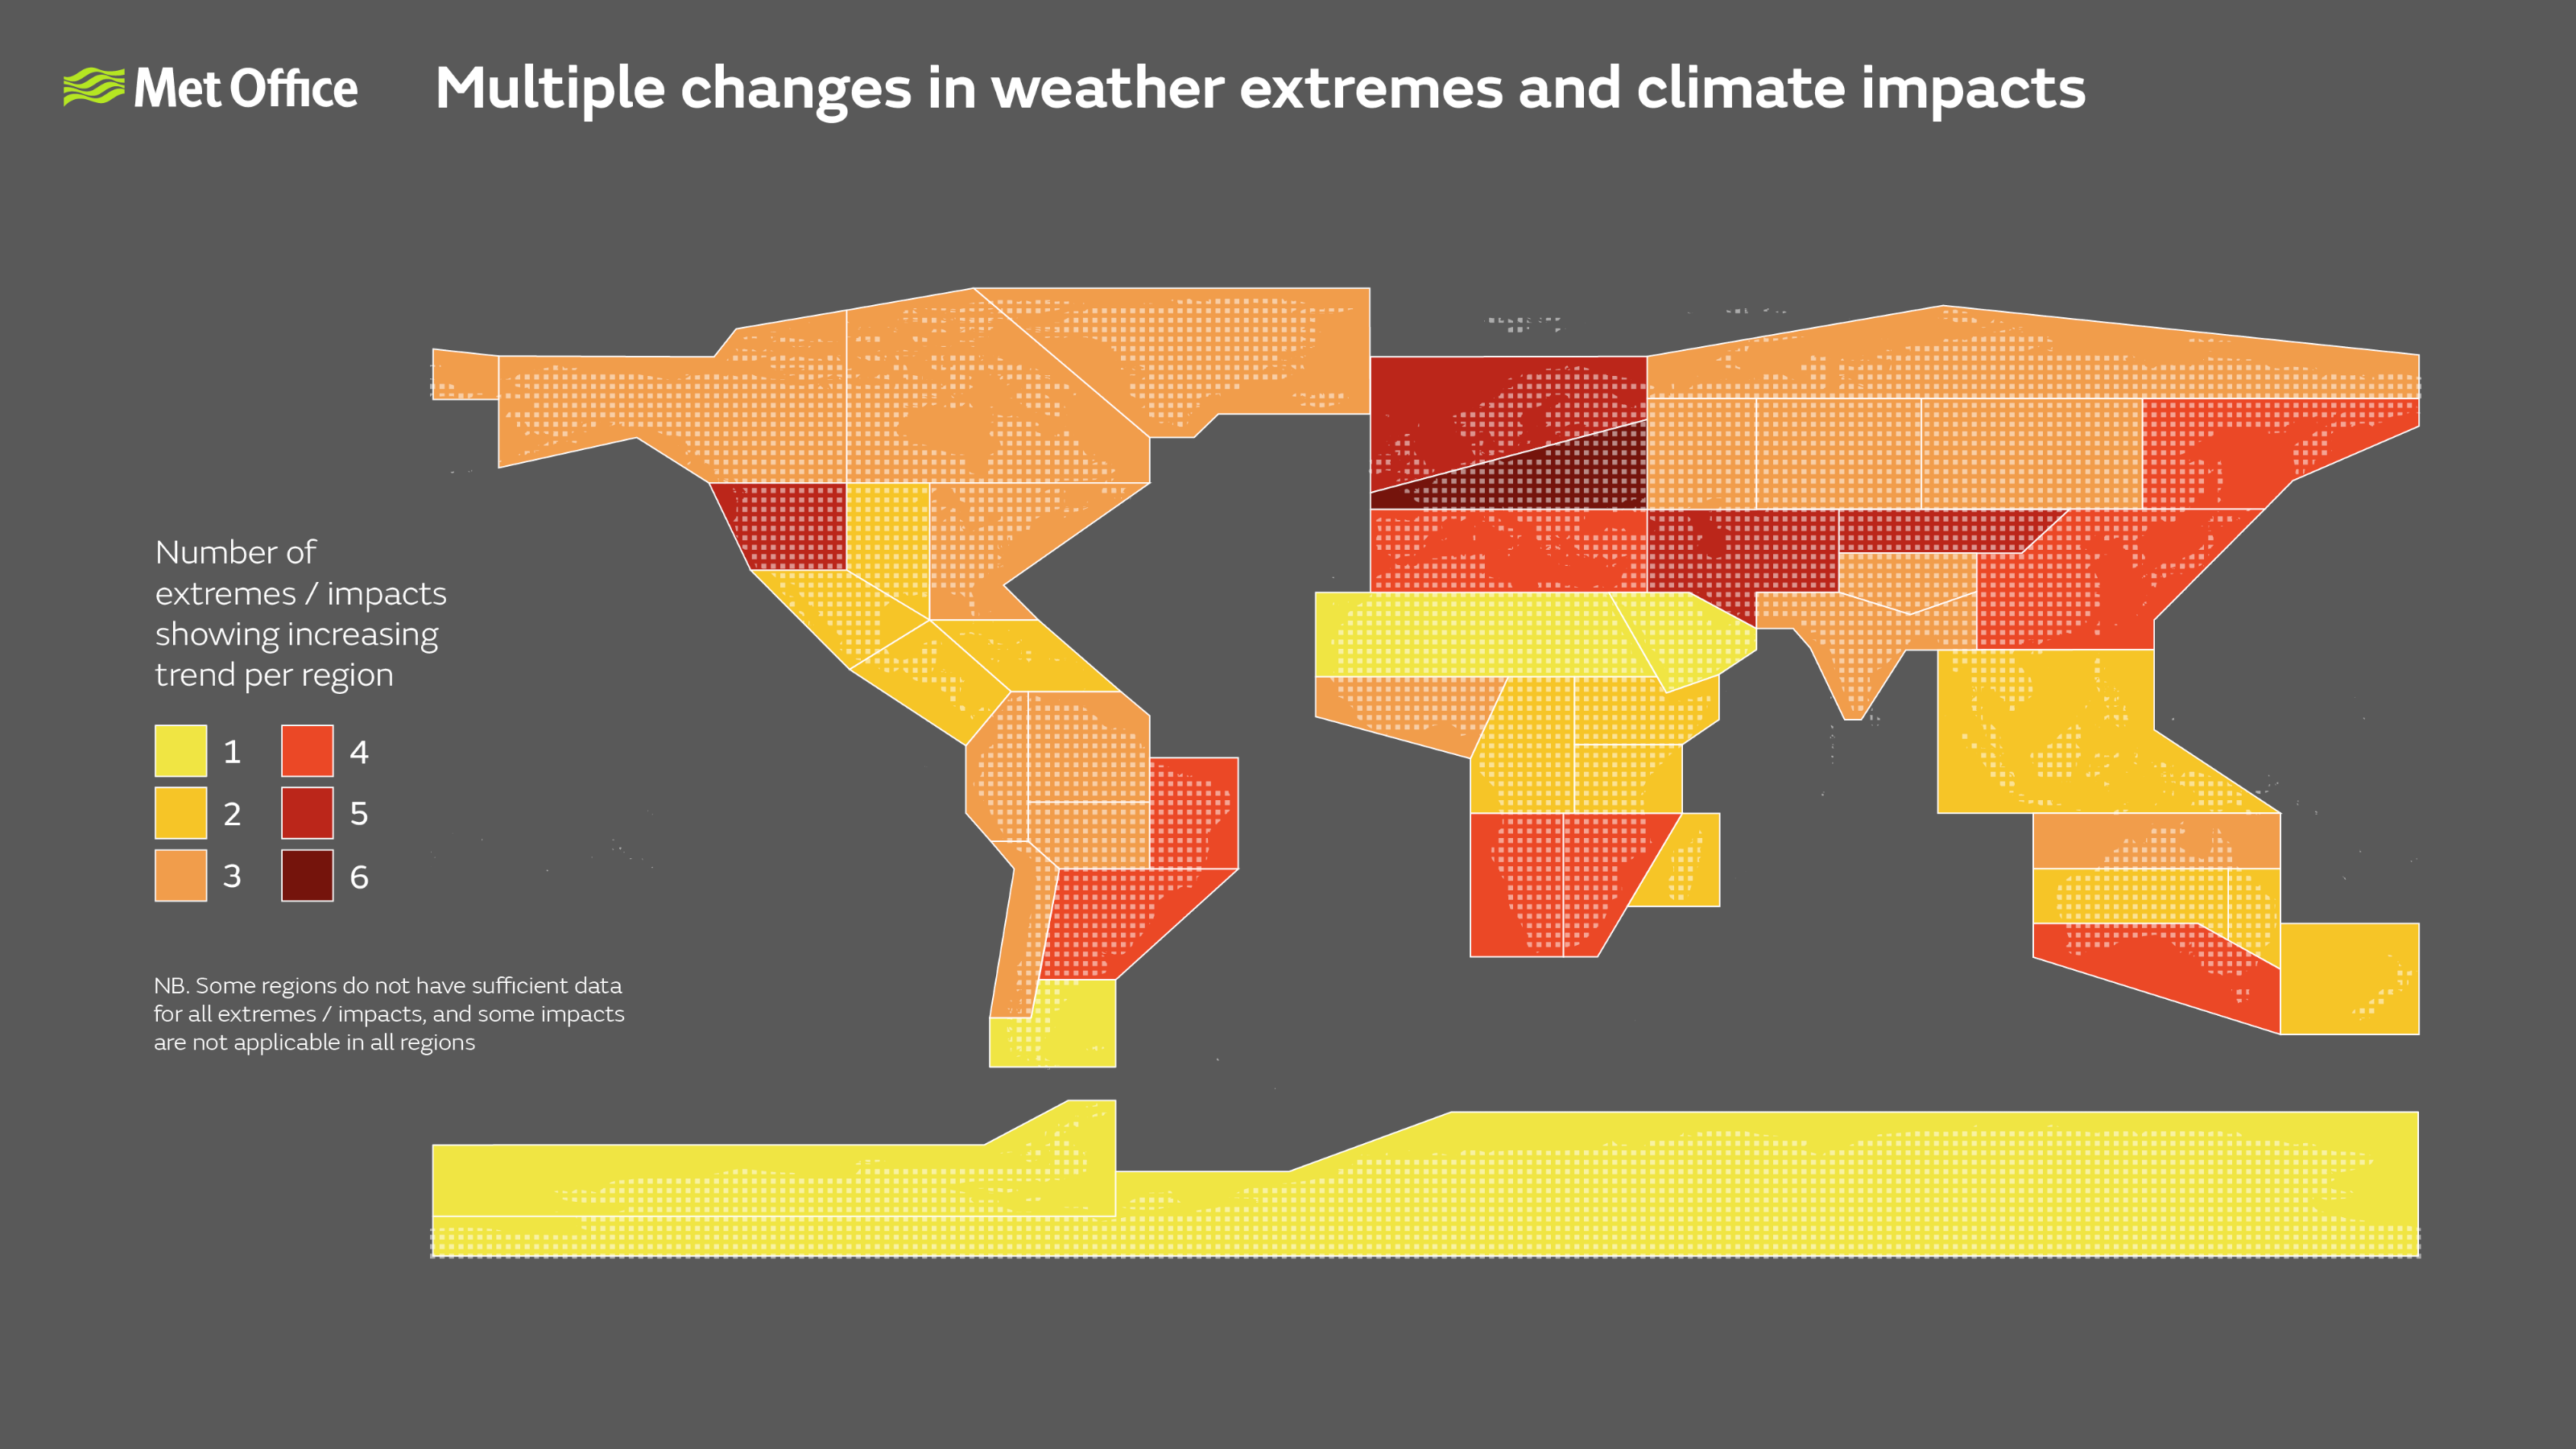
This map shows the number of extremes / impacts showing an increasing trend per region. The extremes and impacts include extreme high temperatures, heavy rainfall and flooding, river flows, agricultural drought, fire weather and glaciers. Some regions do not have sufficient data for all extremes / impacts, and some impacts are not applicable in all regions.
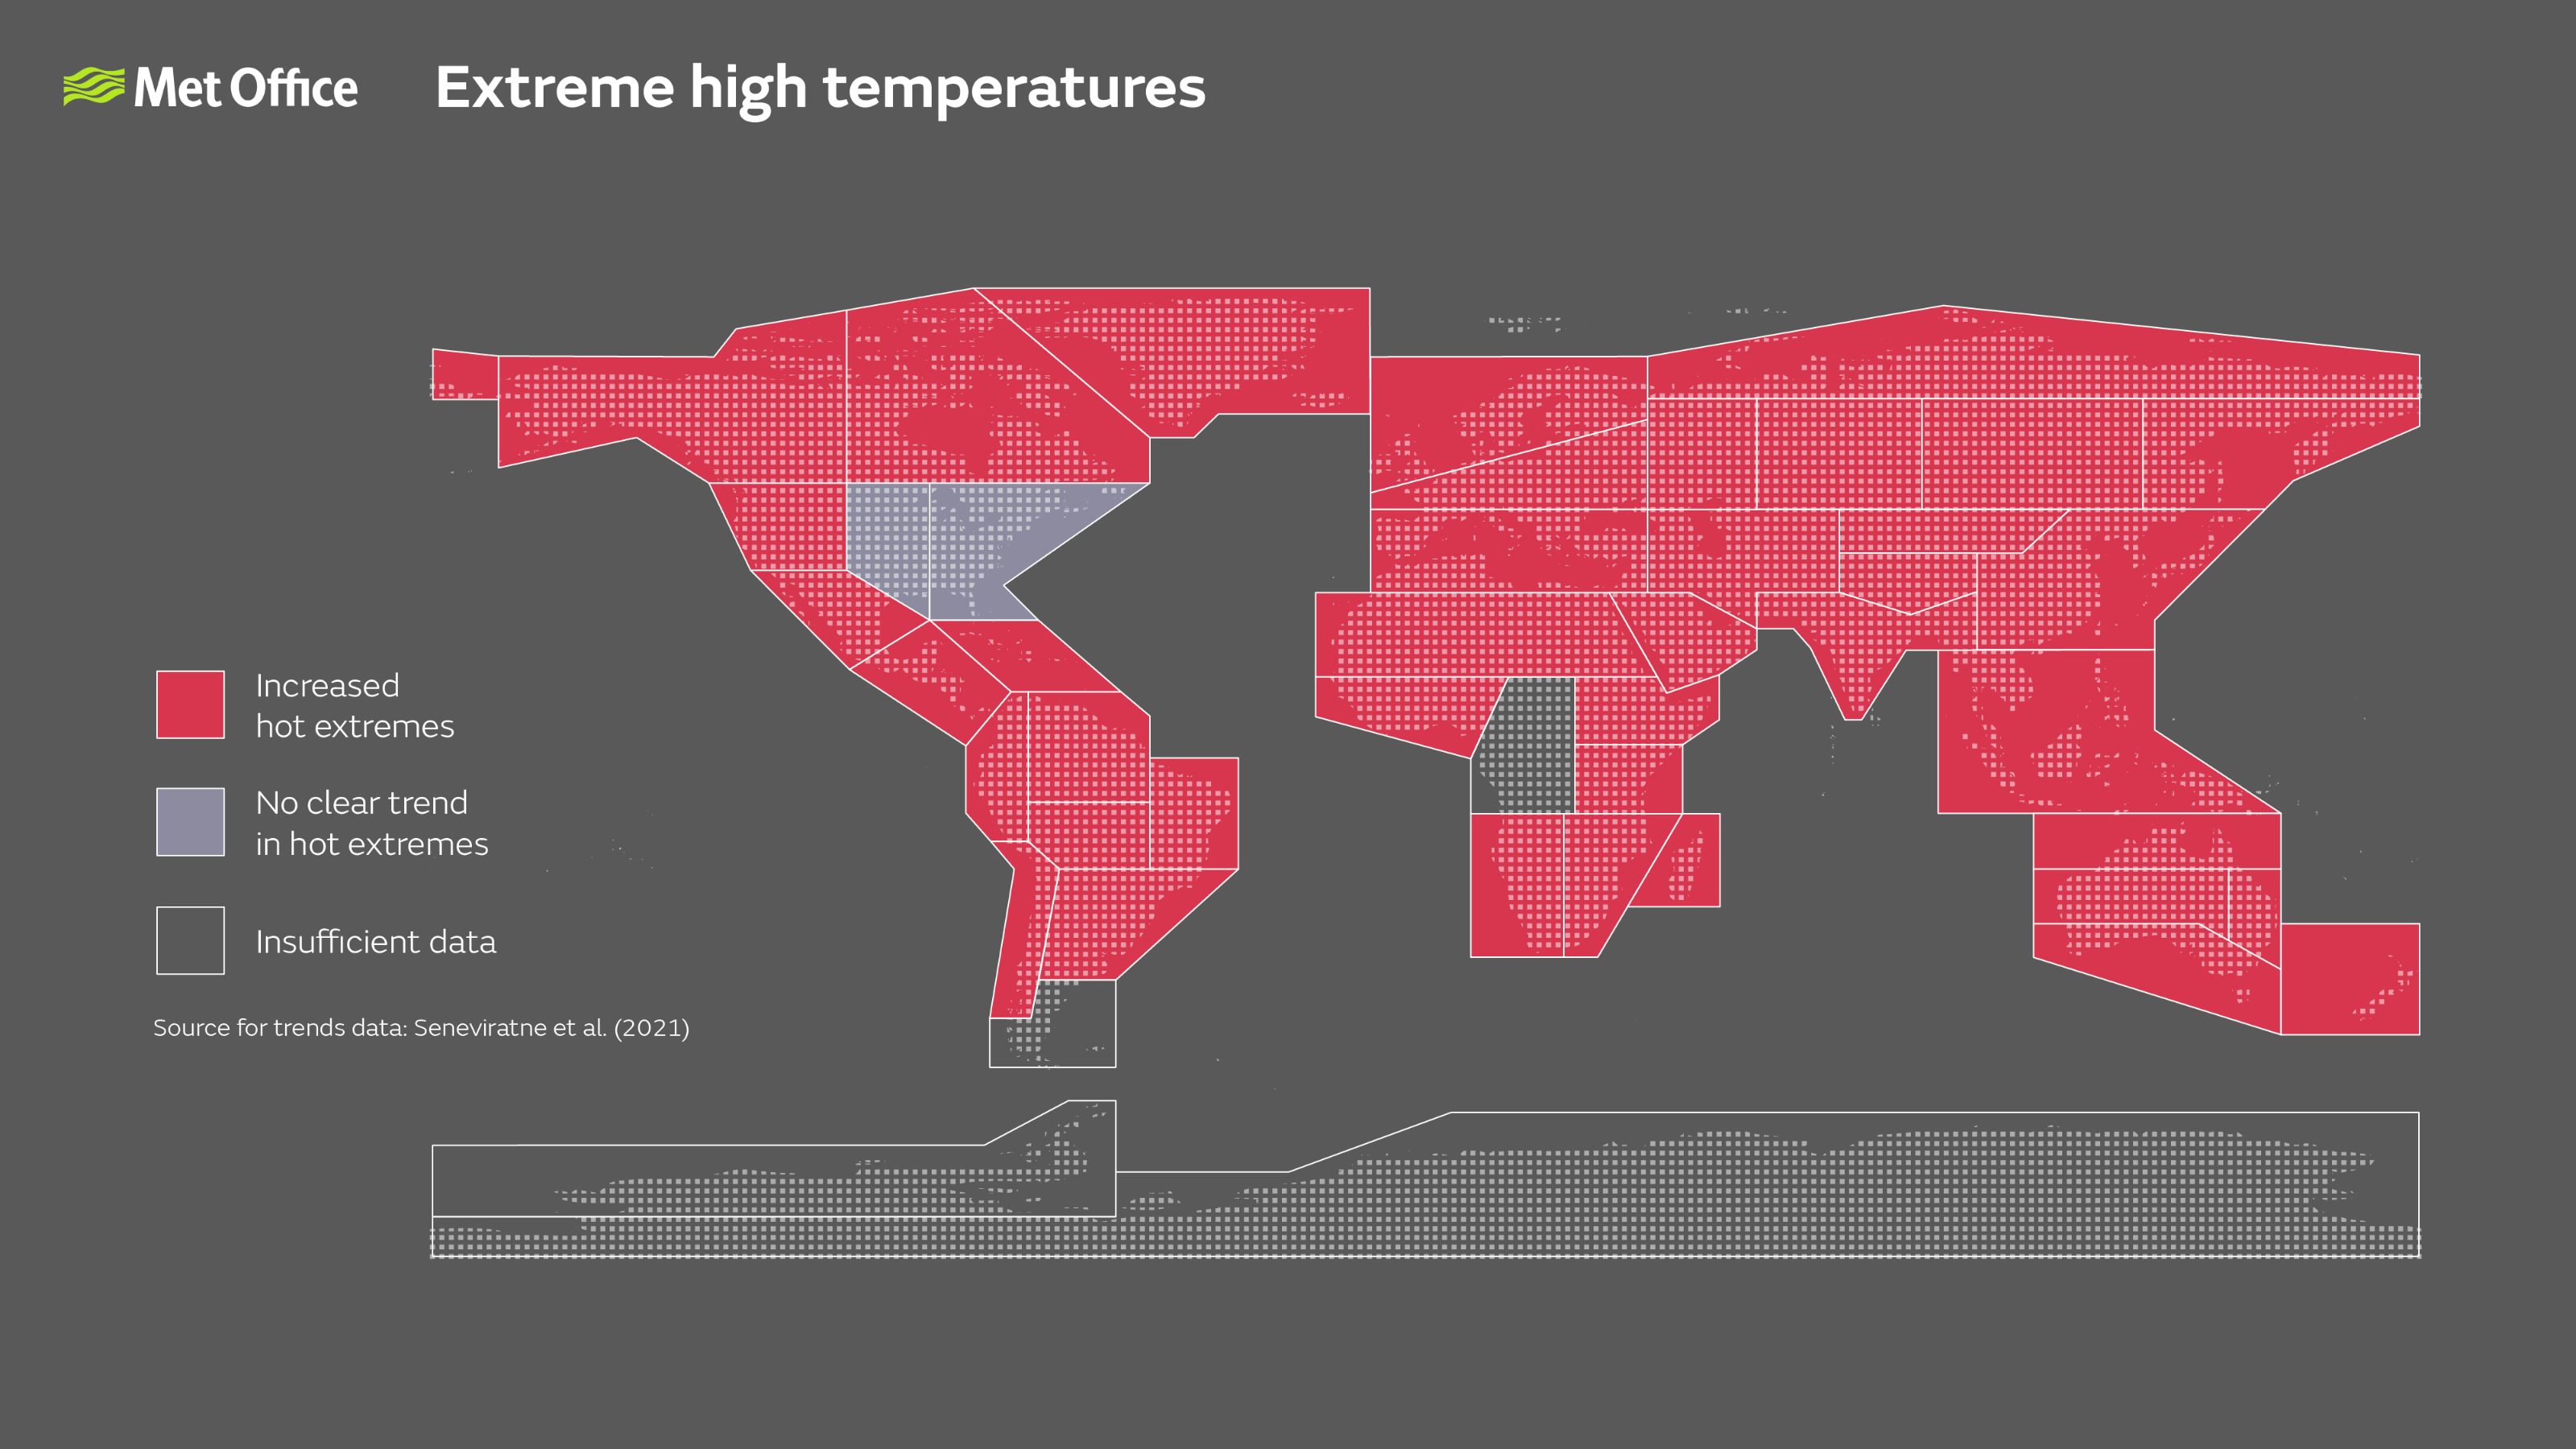
The map shows observed changes in hot extremes since the 1950s and examples of impactful extreme heat events with their severity / likelihood increased by anthropogenic climate change.
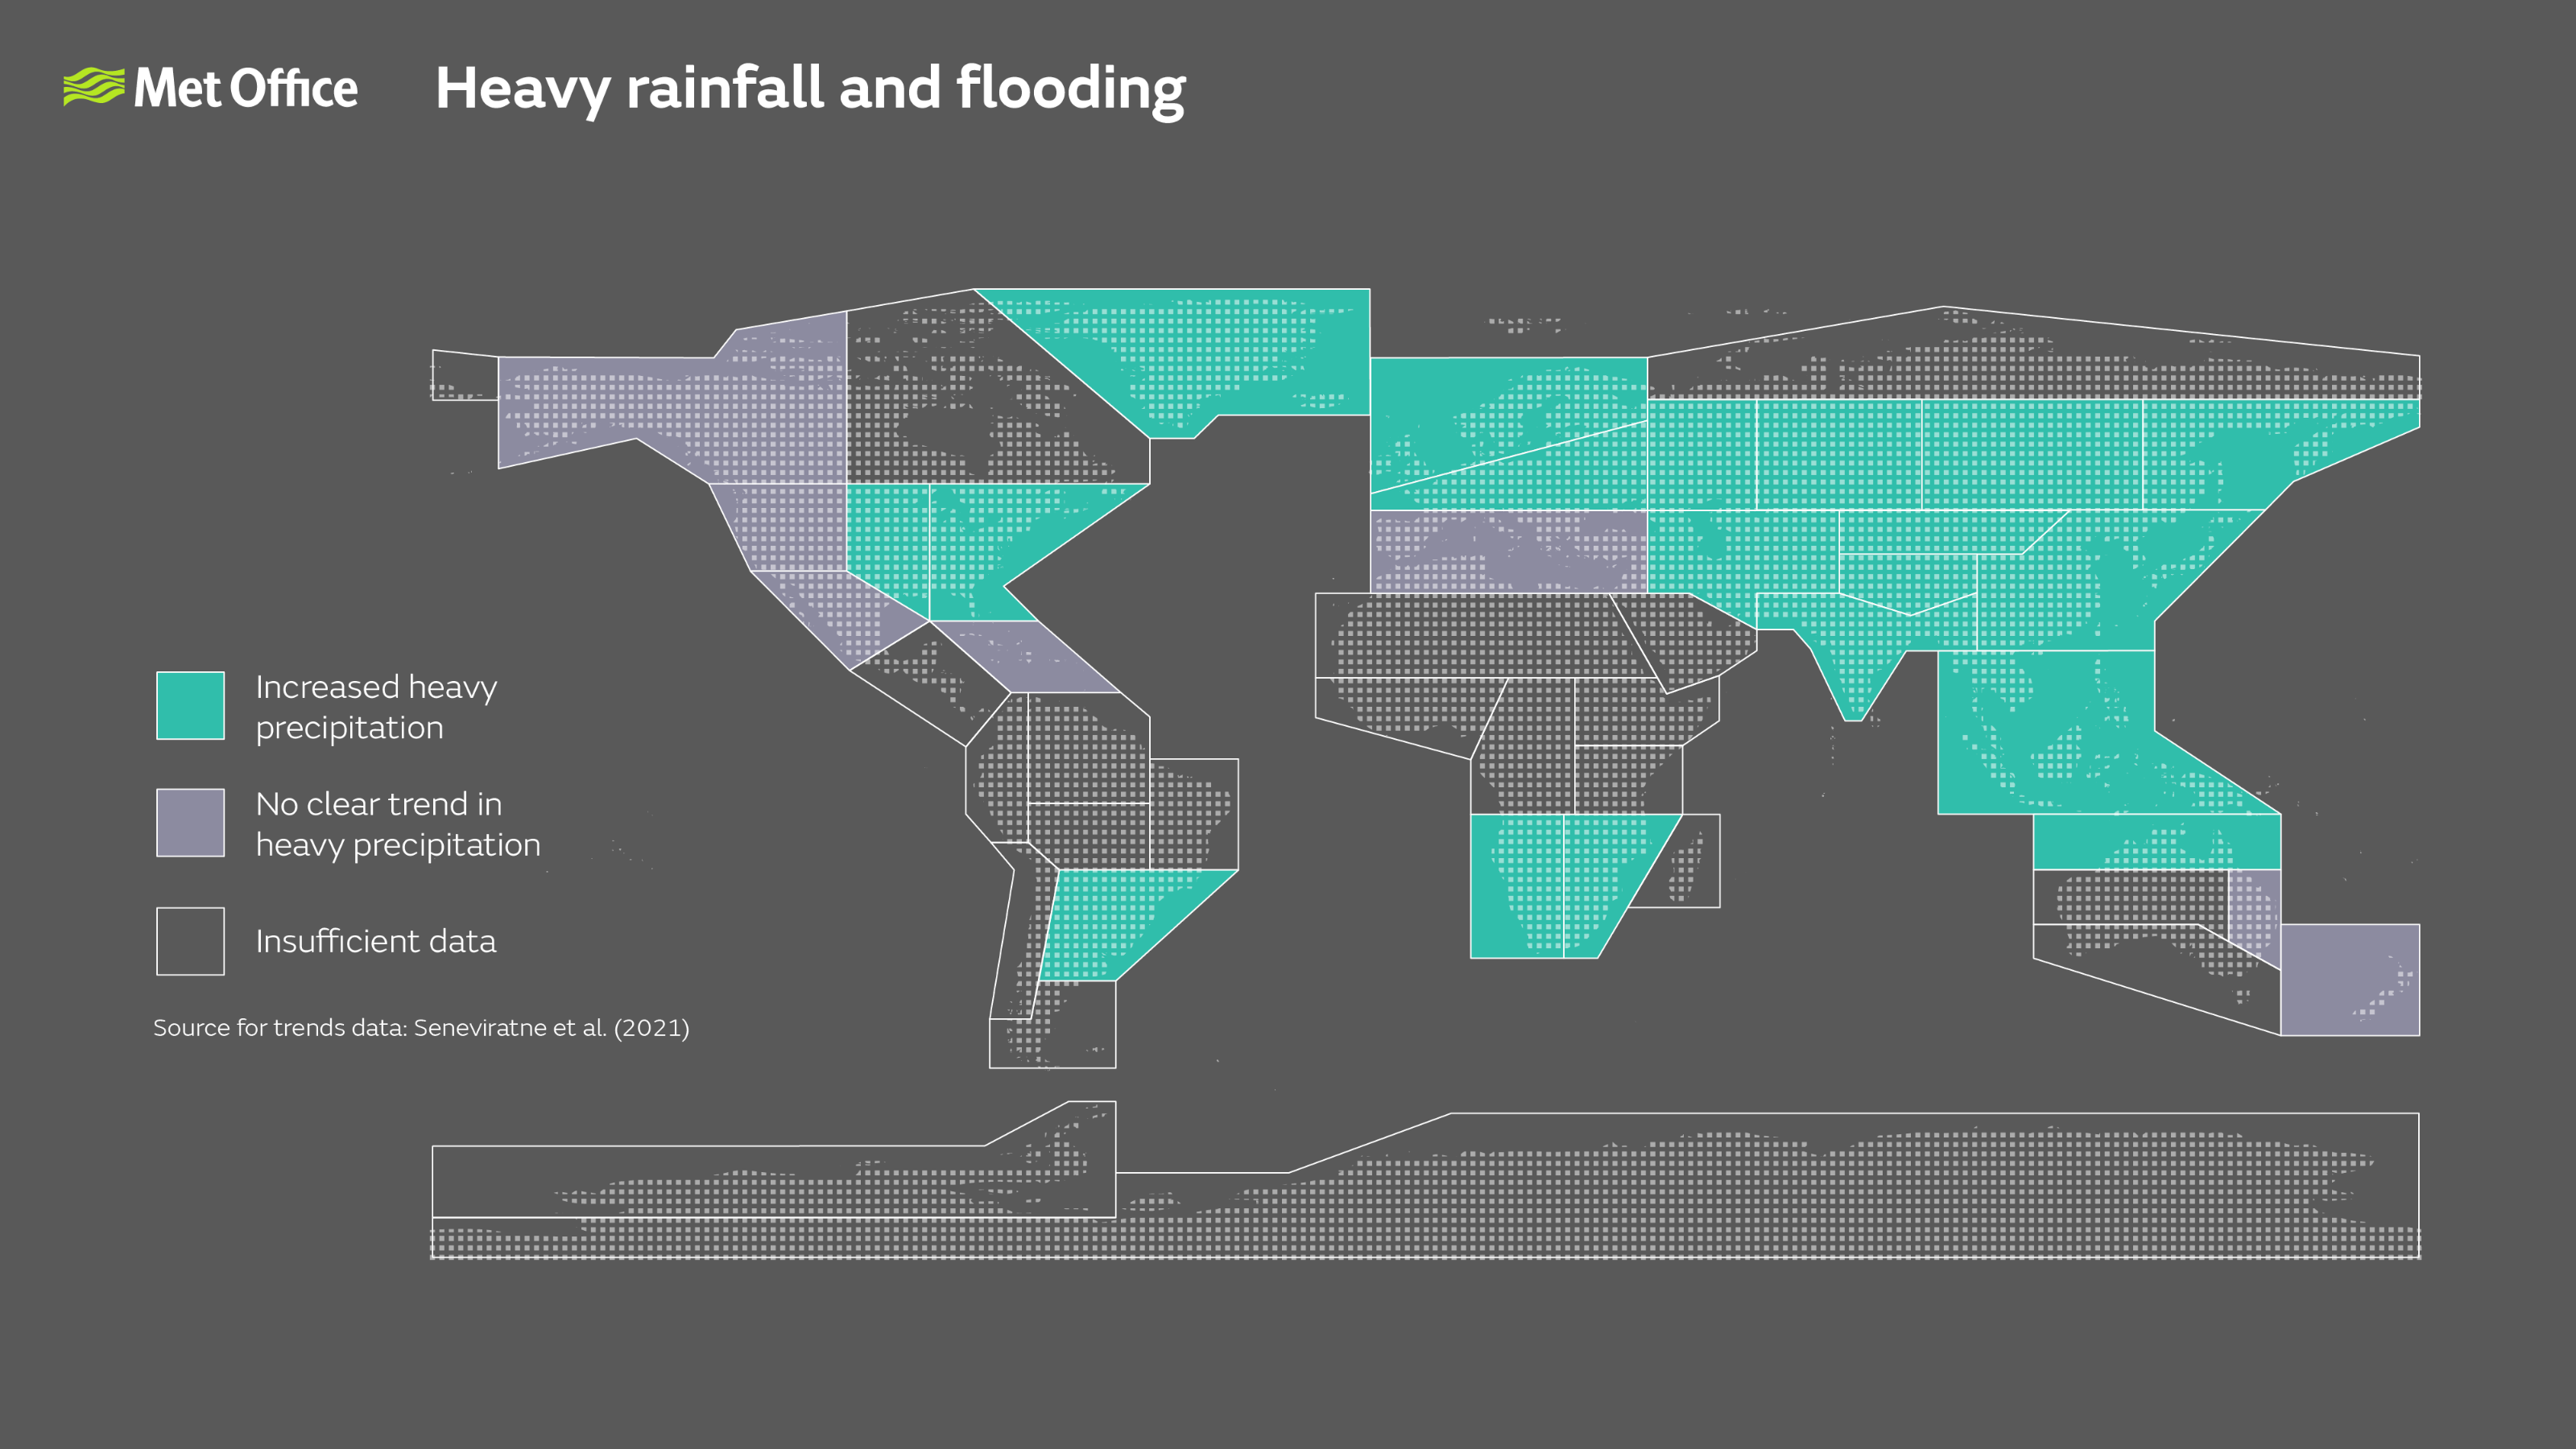
The map shows observed changes in heavy precipitation since the 1950s.
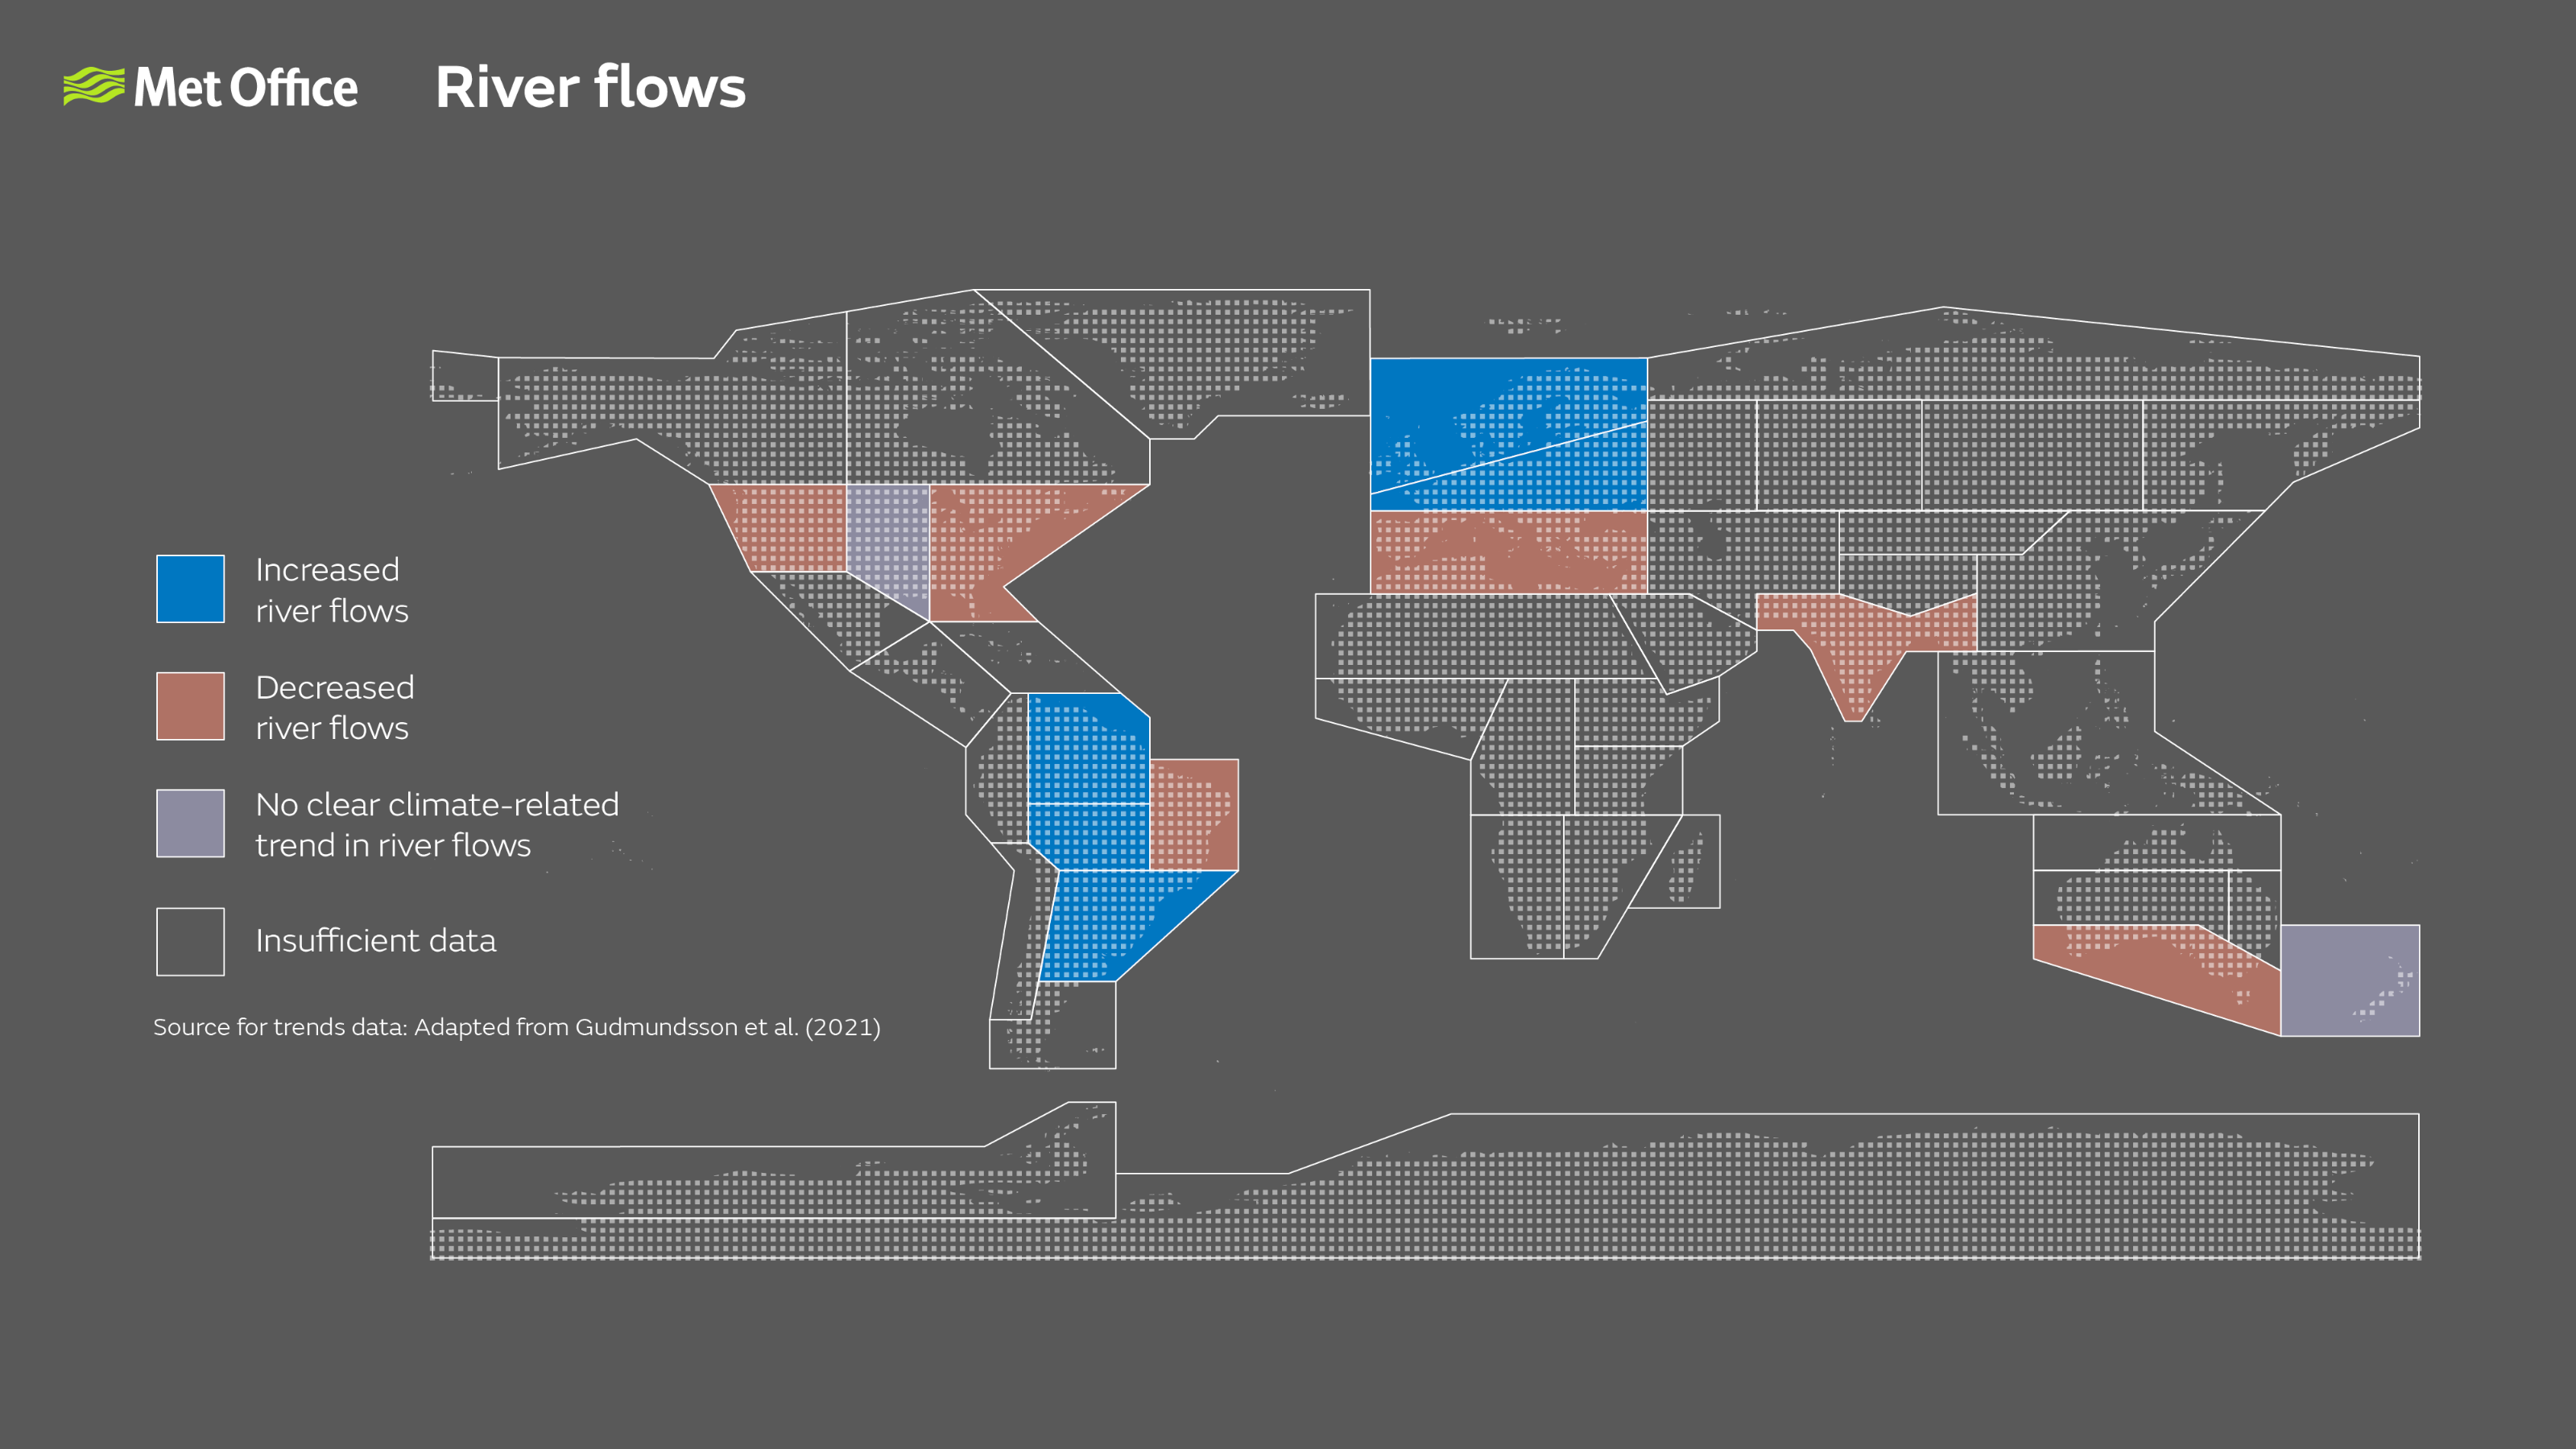
The map shows observed changes in river flows influenced by climate change, between 1971 and 2010.
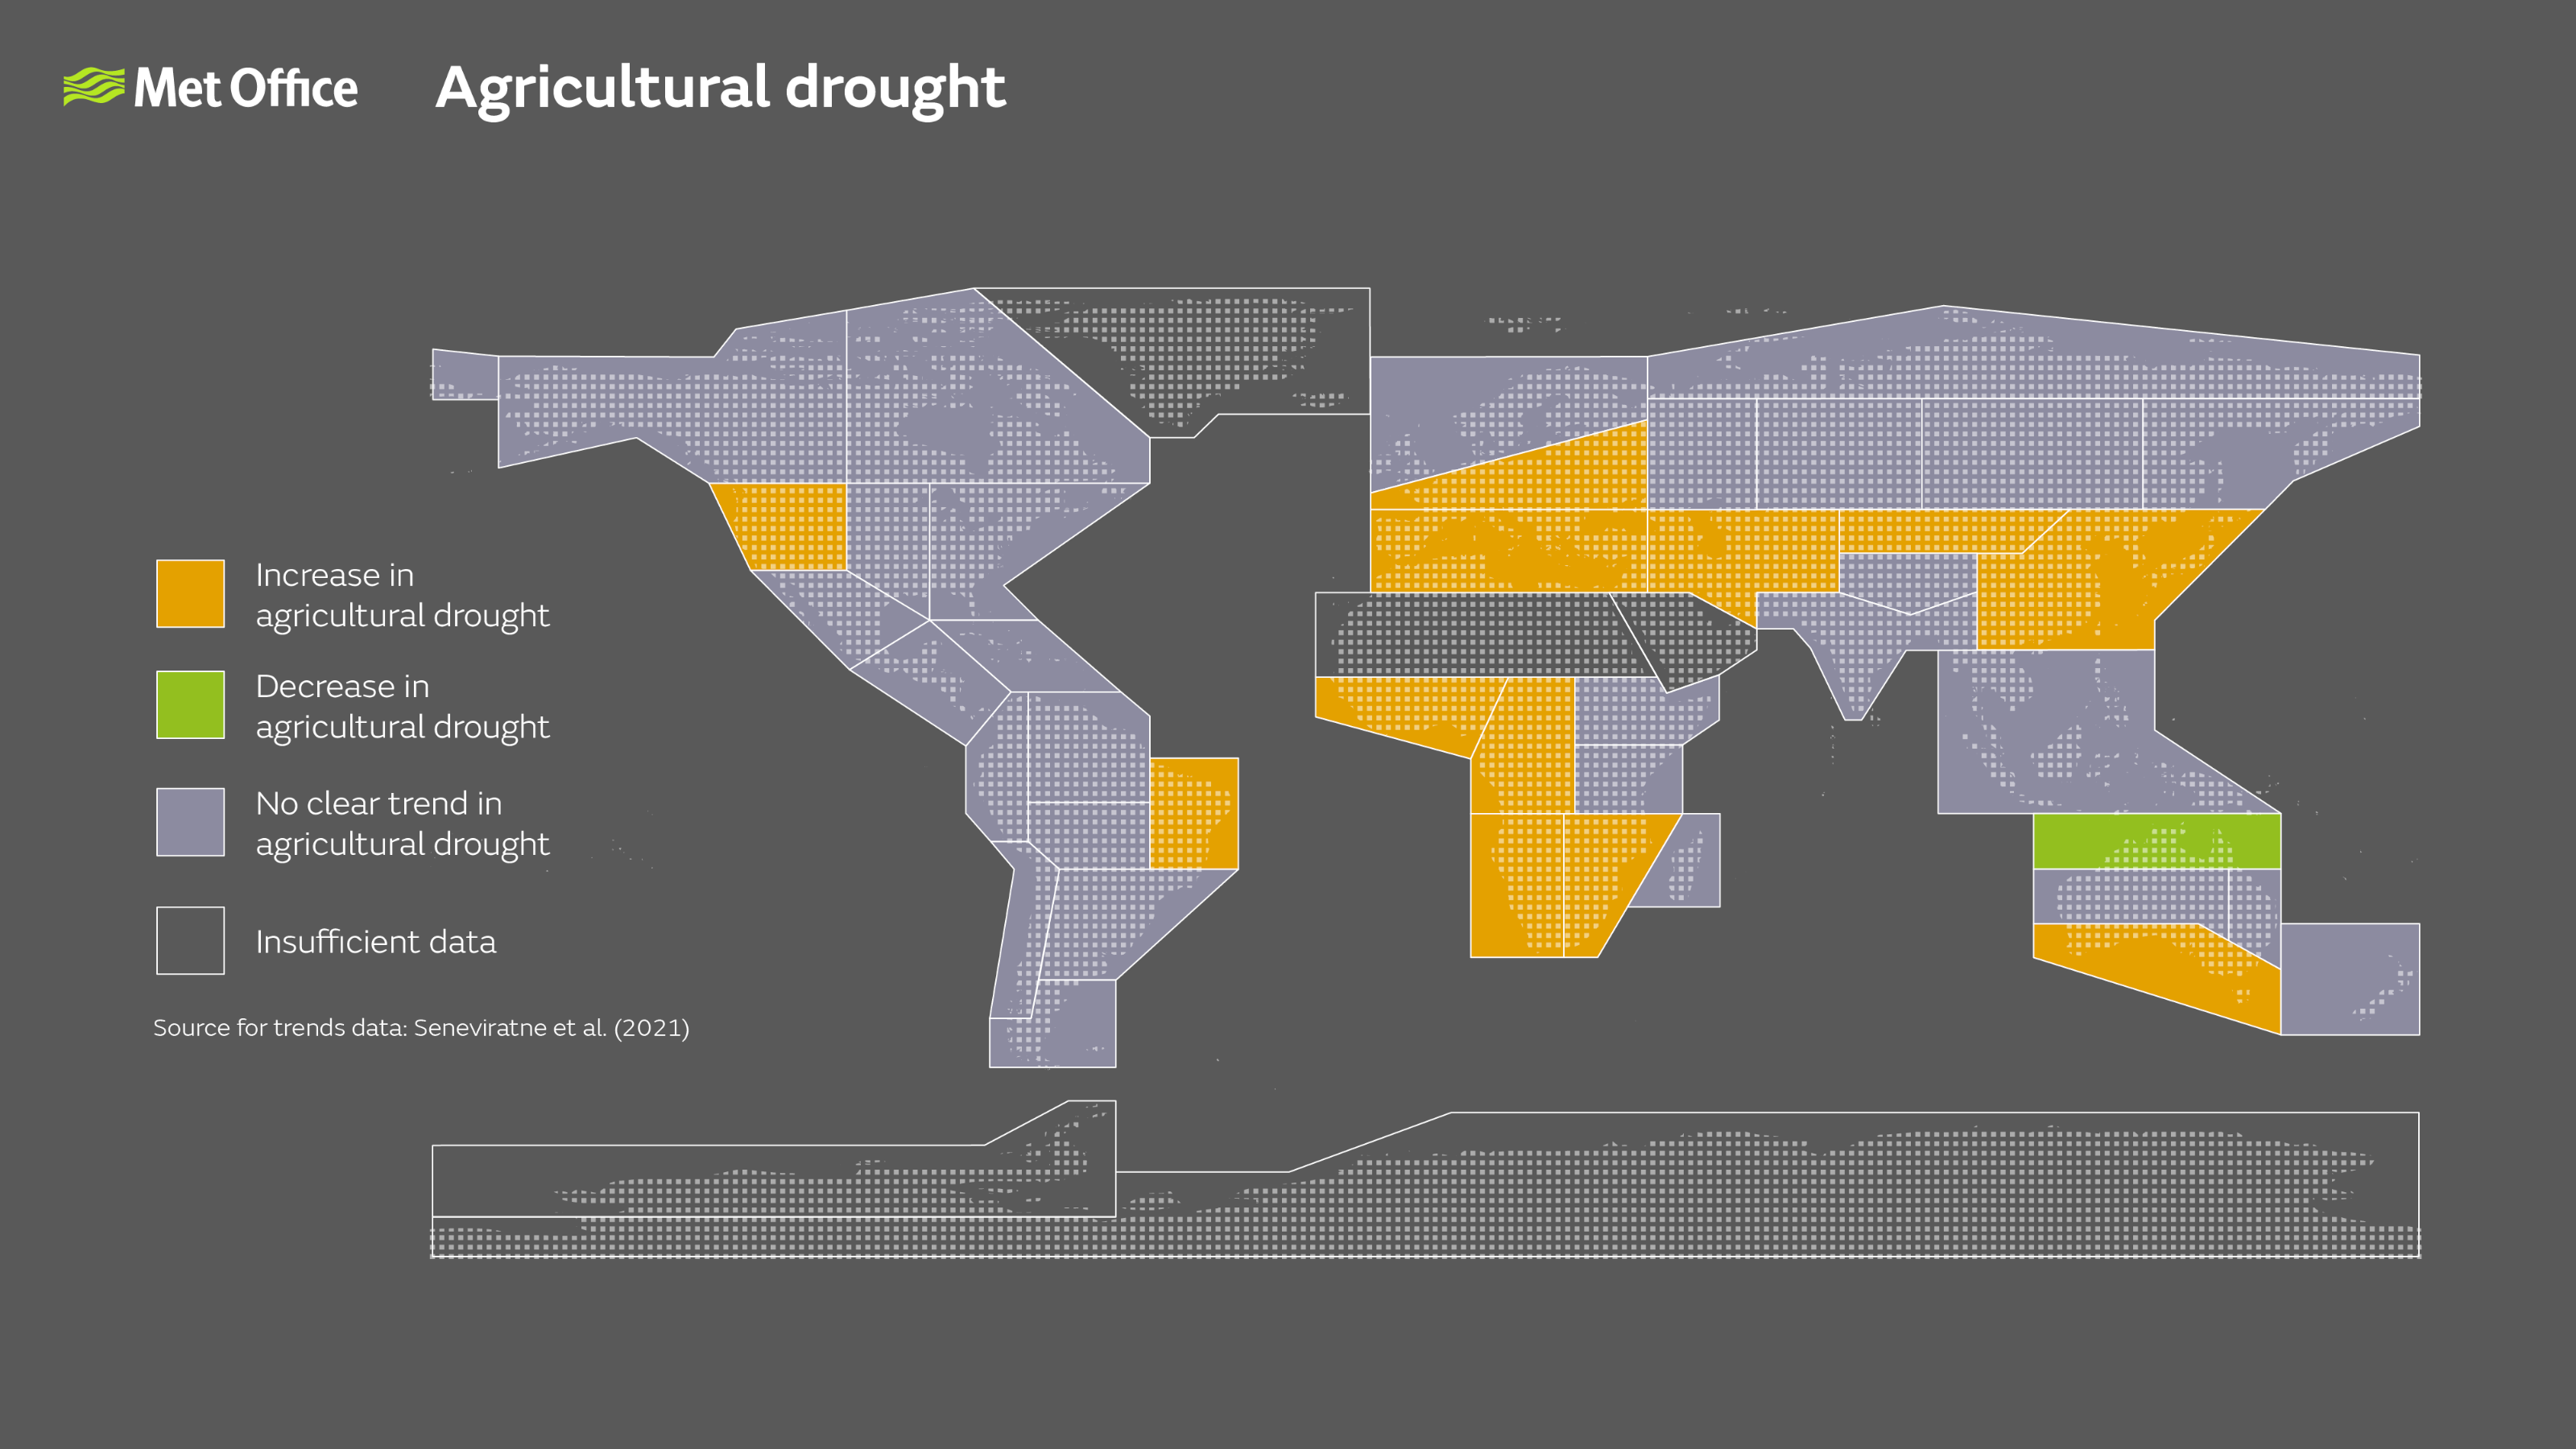
The map shows observed changes in agricultural (soil moisture) drought since the 1950s.
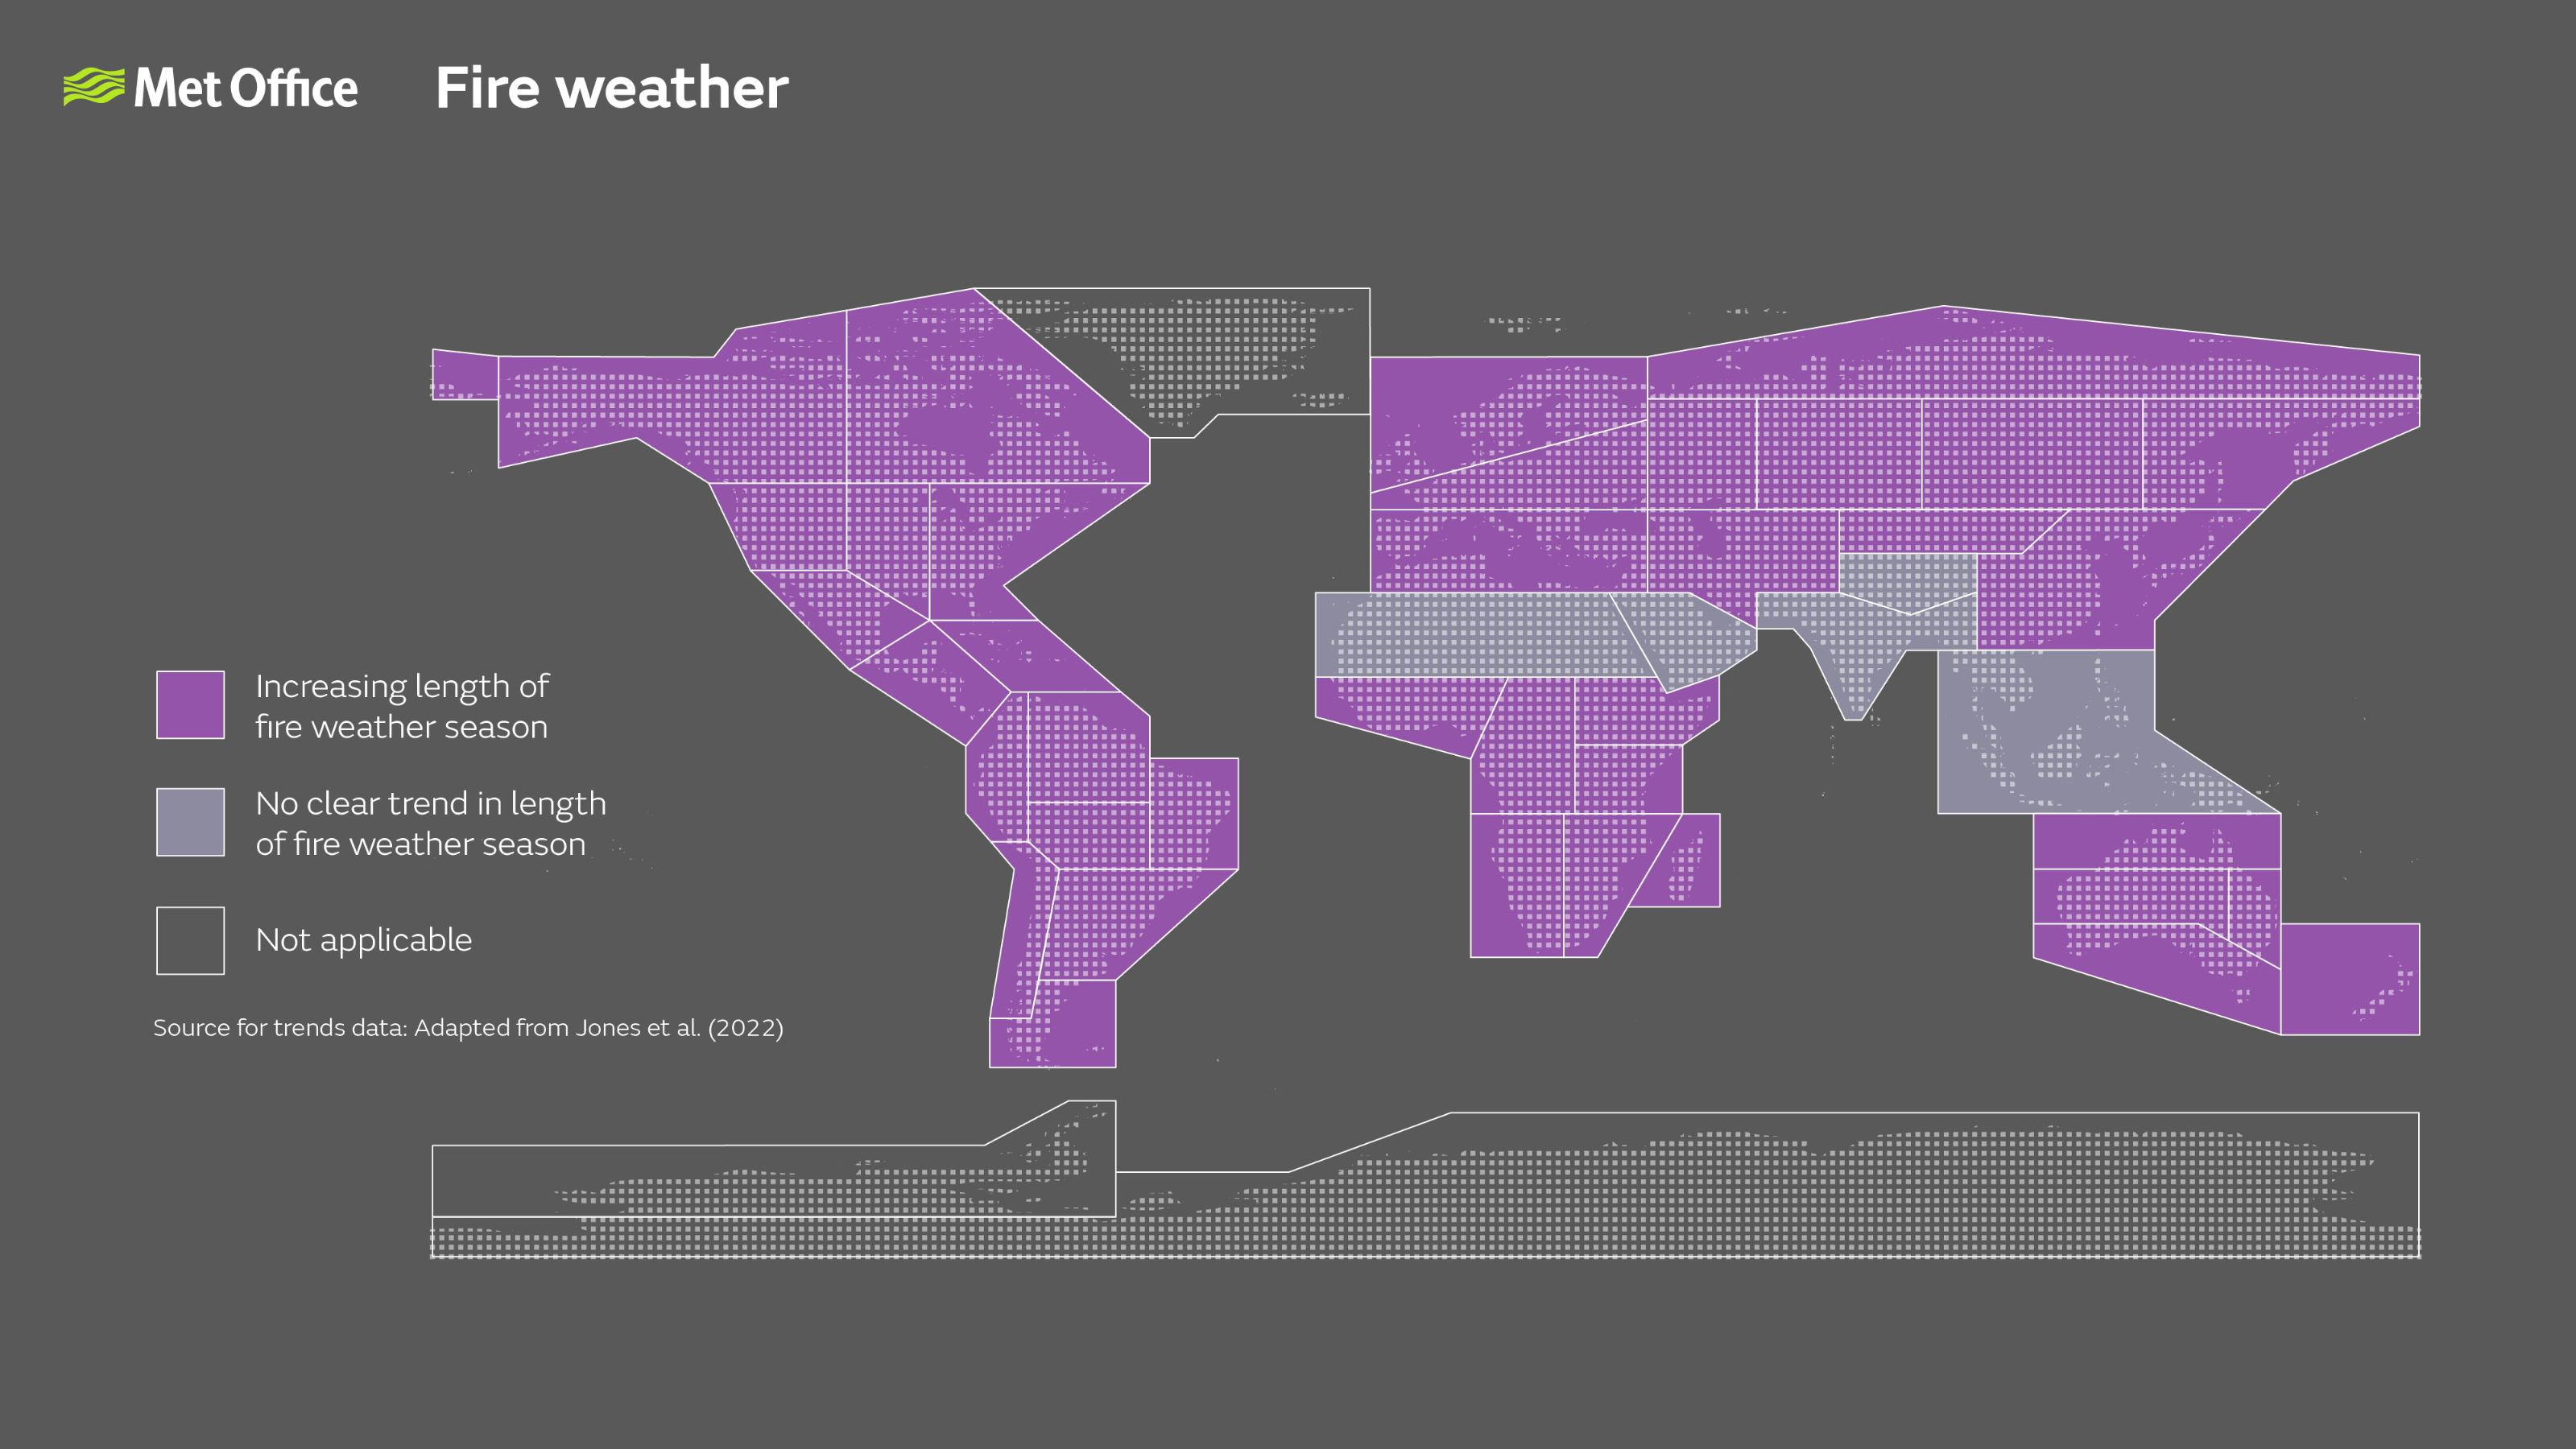
The map shows change in length of fire weather season between 1979 and 2019 from reanalysis, and examples of major fire events with severity / likelihood increased by anthropogenic climate change.
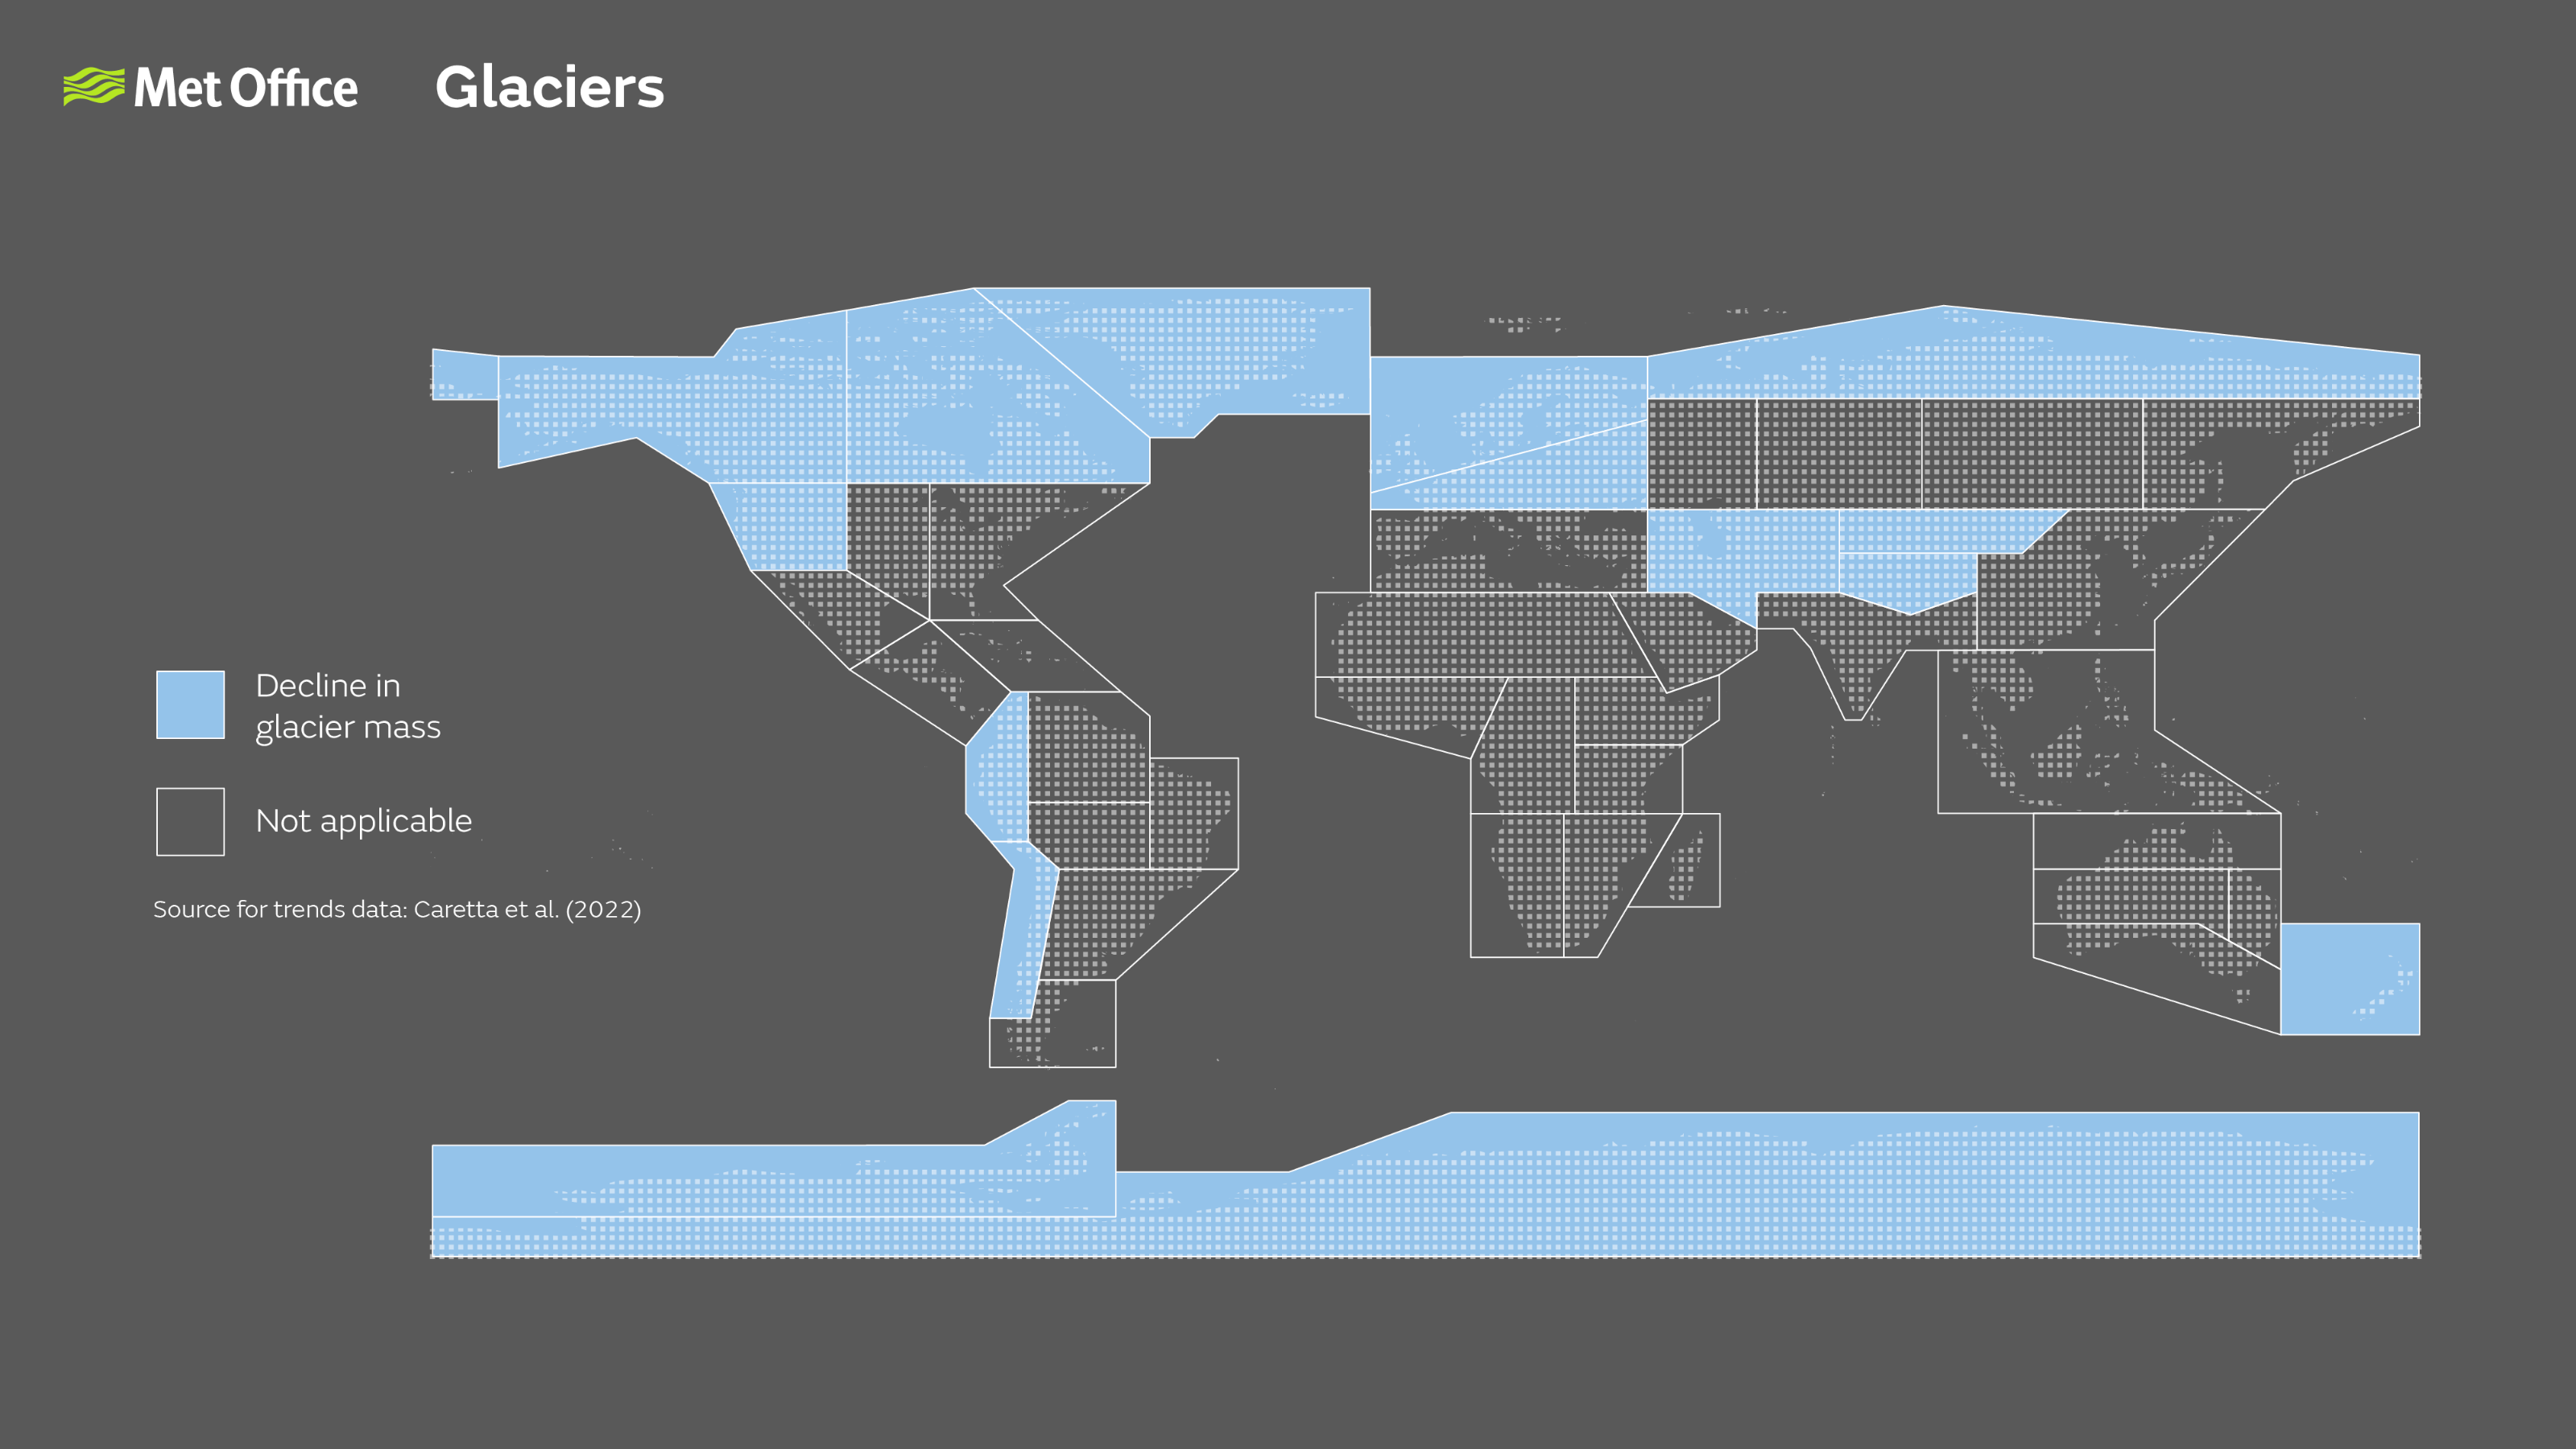
The map shows observed change in glacier mass 2000 - 2019.
For versions of these maps highlighting specific extreme events attributable to human activity, please see this report.